. 2014 Dec 10;28(30):1430015.
doi: 10.1142/S0217984914300154.

Understanding dynamic changes in live cell adhesion with neutron reflectometry

Affiliations

Understanding dynamic changes in live cell adhesion with neutron reflectometry

Ann Junghans et al. Mod Phys Lett B. .

Abstract

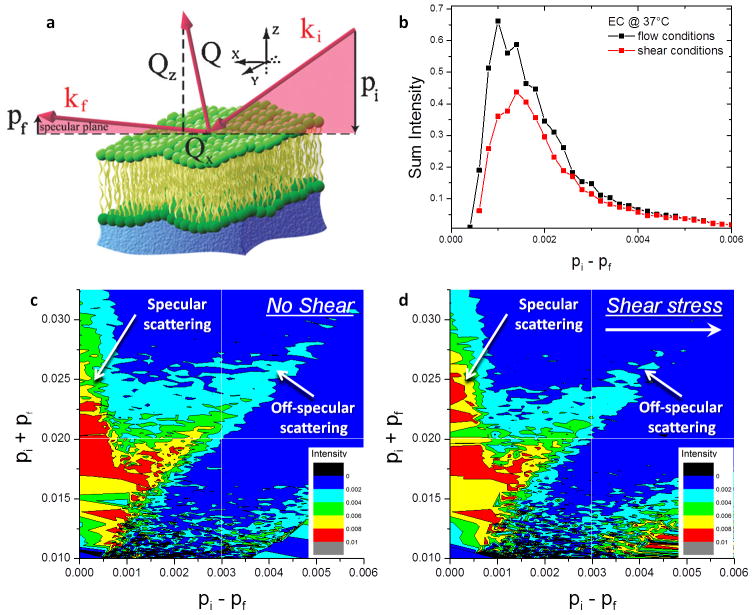
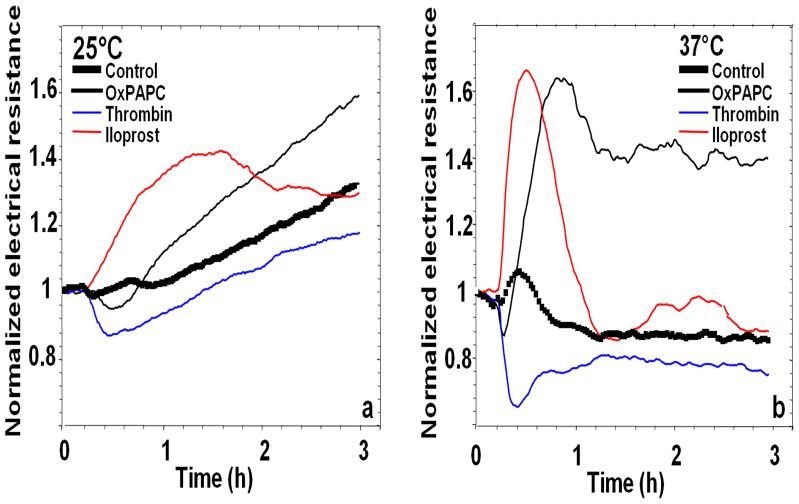
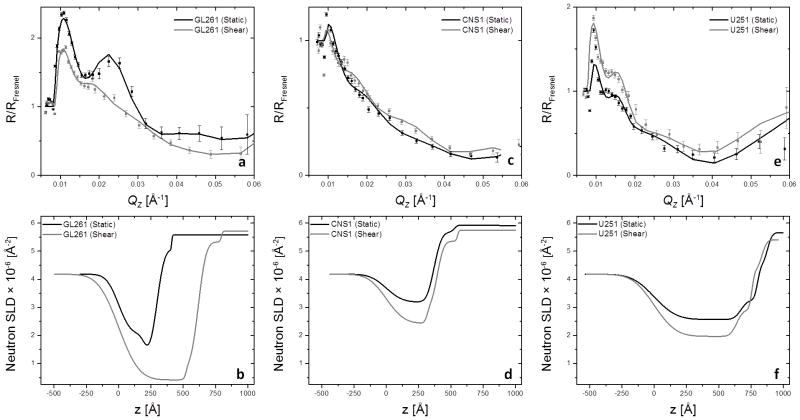
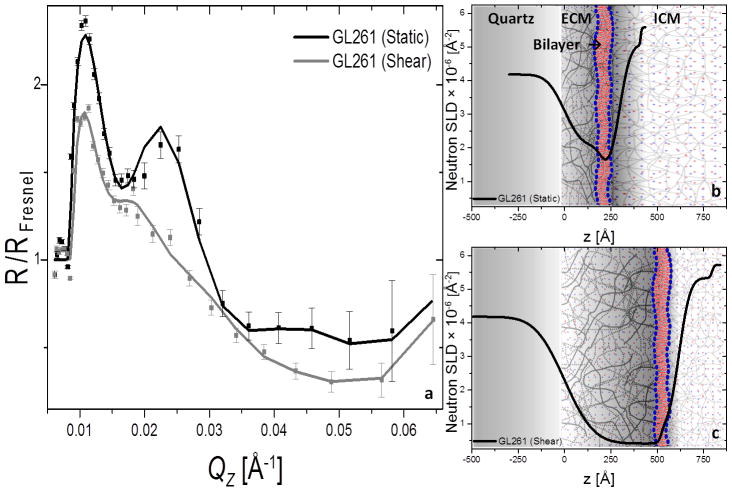
Neutron reflectometry (NR) was used to examine various live cells adhesion to quartz substrates under different environmental conditions, including flow stress. To the best of our knowledge, these measurements represent the first successful visualization and quantization of the interface between live cells and a substrate with sub-nanometer resolution. In our first experiments, we examined live mouse fibroblast cells as opposed to past experiments using supported lipids, proteins, or peptide layers with no associated cells. We continued the NR studies of cell adhesion by investigating endothelial monolayers and glioblastoma cells under dynamic flow conditions. We demonstrated that neutron reflectometry is a powerful tool to study the strength of cellular layer adhesion in living tissues, which is a key factor in understanding the physiology of cell interactions and conditions leading to abnormal or disease circumstances. Continuative measurements, such as investigating changes in tumor cell - surface contact of various glioblastomas, could impact advancements in tumor treatments. In principle, this can help us to identify changes that correlate with tumor invasiveness. Pursuit of these studies can have significant medical impact on the understanding of complex biological problems and their effective treatment, e.g. for the development of targeted anti-invasive therapies.

Keywords: adhesion; cells; endothelial monolayer; glioblastomas; neutron scattering; shear stress.


Figures

Figure 1
Figure 1. Schematic of the neutron scattering solid-liquid interface flow cell
(a) Schematic of the solid-liquid cell with clamping mechanism and gear pump. (c) Side view of the flow cell used for the experiments. (b) Results of hydrodynamic simulations of the fluid velocity distribution in the flow cell close to the quartz block, at the approximate live cell location. (d) Schematic of the live cells adhered to quartz wafer. After culturing the cells, the quartz substrate was clamped against a Macor disk with a 0.1–0.3 mm thick, subphase-filled gap created by an O-ring. The neutron beam penetrates the lateral face of the quartz substrate and is scattered from the solid-liquid interface.
Figure 2
Figure 2. Simulated SLD distributions and corresponding calculated NR spectra
Left panel (a) – three SLD distributions corresponding to the same density of the scattering components but with the thickness of the extracellular cellular matrix (ECM) varied. Right panel (b) - simulated Fresnel divided NR spectra corresponding to the SLD profiles shown in (a). (c) - SLD distributions corresponding to the same thickness of the scattering components but with the amount of proteins in the ECM varied. (d) - calculated NR spectra corresponding to the SLD profiles shown in (c). The NR spectra are offset along y-axis for clarity. Parameters for the lipid bilayer (thickness, SLDs, roughness) of the cells and the intracellular matrix (ICM) have been kept constant.
Figure 3
Figure 3. NR profiles and corresponding SLD distributions of mouse fibroblasts
Fresnel divided NR profiles (a) and corresponding SLD profiles (b) for high (black) and low (gray) cell surface densities. NR data are shown by closed squares, and error bars indicate 1 standard deviation (SD). The lower surface cell density is evident from the decreased scattering intensity (a) and the increased SLD in the membrane region (360–440 Å) and interior of the cell (440–600 Å) (b).
Figure 4
Figure 4. Differences in response to shear flow of healthy endothelial cells at ambient and physiological temperatures
Left (a): Fresnel-divided NR measurements (circles/squares with error bars) and corresponding best-fit models (solid lines) at the conditions studied. Black (open circles): 25° (Static), Black (closed circles): 25° Shear), Red (open squares): 37° (Static), Red (closed squares): 37° (Shear). The NR spectra are offset along y-axis for clarity. Right (b-e): SLD profiles obtained by fitting the data sets using a 3-box model (extracellular matrix – cell membrane – partial cell interior).
Figure 5
Figure 5. Off-specular data depicts changes in surface roughness
Data is shown as two-dimensional intensity maps as a function of pi and pf. (a) pi = 2π sin αi/λ and pf = 2π sin αf/λ are the components perpendicular to the sample surface of the incoming and outgoing neutron wave vectors, respectively . The dominating intensity peak at pipf = 0 corresponds to the specular reflection Qz. The off-specular (Yoneda scattering) is visible to the right from the specular line along picture’s diagonal indicating the presence of surface and substrate roughness. (b) Comparison of the intensity distribution along the Yoneda peaks vs. pi−pf of endothelial cells under static (black) and shear (red) conditions show decrease in scattering under shear stress. (c) and (d) show experimental two-dimensional intensity maps of endothelial cells at 37°C at static and shear conditions, respectively. The extension of the off-specular signal (right top corner) in (c) compared to (d) indicates more in-plane fluctuations at static conditions. The colors in all three panels correspond to the same intensity distributions pictured in a.
Figure 6
Figure 6. Temperature decrease suppresses endothelial cell permeability responses to agonists
Human pulmonary EC monolayers, at 25°C (a) and 37°C (b), grown on microelectrodes were stimulated with barrier-enhancing agonists OxPAPC (10 μg/ml) or iloprost (100 ng/ml), or cells were stimulated with barrier-disruptive agonist thrombin (1 U/ml). Trans-endothelial electrical resistance (TER) reflecting monolayer barrier property was measured over time. Sustained barrier enhancement by OxPAPC and transient barrier enhancement by iloprost was reflected by increases in TER. In contrast, thrombin-induced barrier compromise was reflected by rapid TER decline. The amplitude and rapidity of EC biological response to agonist stimulation observed at +37°C was significantly reduced at +25°C.
Figure 7
Figure 7. Differences in response to shear flow conditions of different GBM cell types
(a, c, e): Fresnel divided NR measurements (squares with error bars) and corresponding best-fit models (solid lines) of the three cell lines in contact with D2O + 10% DMEM at 37°C. (b, d, f): SLD profiles obtained by fitting the data sets using a 3-box model (extracellular matrix – cell membrane – partial cell interior). (a, b): GL261, (c, d): CNS1, (e, f): U251.
Figure 8
Figure 8. Behavior of GL261 cells under static and shear flow conditions
(a): Fresnel divided NR measurements (squares with error bars) and corresponding best-fit models (solid lines) of GL261 monolayer in contact with D2O +10% DMEM at 37°C at static (black) and shear conditions (gray). (b, c): SLD profiles obtained by fitting the data shown in a using a 3-box model (extracellular matrix – cell membrane – partial cell interior) at static (b) and shear conditions (c).
Figure 9
Figure 9
Cells transfected with HAS2 gene produces large pericellular coats of HA. U251 glioma cells expressing red fluorescent protein were transfected with a plasmid carrying the HA-synthase enzyme HAS2 or a negative control. Two days after transfection, live cells were incubated with fixed erythrocytes, which cannot permeate the HA mesh, and imaged by fluorescence (to reveal the cytoplasm) and phase-contrast (to reveal their pericellular coats, marked by arrows). Bar: 40 μm. This research was originally published in: Sim et al. Reduced expression of the hyaluronan and proteoglycan link proteins in malignant gliomas. J Biol Chem (2009) 284:26547. (c) The American Society for Biochemistry and Molecular Biology.

Similar articles

References

    1. Birukov KG, Leitinger N, Bochkov VN, Garcia JGN. Microvascular Research. 2004;67:18. - PubMed
    1. Fung YC. Biomechanics: Mechanical Properties of Living Tissues. 2. Springer-Verlag; New York: 1993.
    1. Fung YC, Liu SQ. J Biomech Eng. 1993;115:1. - PubMed
    1. Curtis AS. J Cell Biol. 1964;20:199. - PMC - PubMed
    1. Gingell D, Todd I. Biophys J. 1979;26:507. - PMC - PubMed

LinkOut - more resources