

Cellular mechanisms of mutations in Kv7.1: auditory functions in Jervell and Lange-Nielsen syndrome vs. Romano-Ward syndrome
- PMID: 25705178
- PMCID: PMC4319400
- DOI: 10.3389/fncel.2015.00032
Cellular mechanisms of mutations in Kv7.1: auditory functions in Jervell and Lange-Nielsen syndrome vs. Romano-Ward syndrome
Abstract
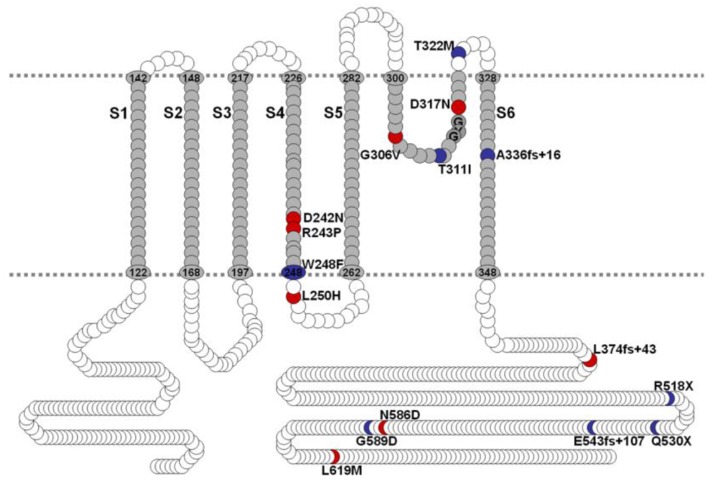
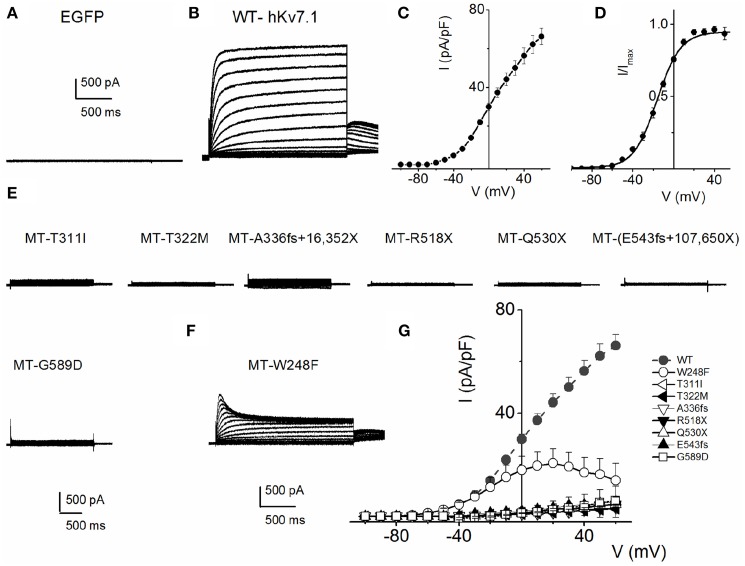
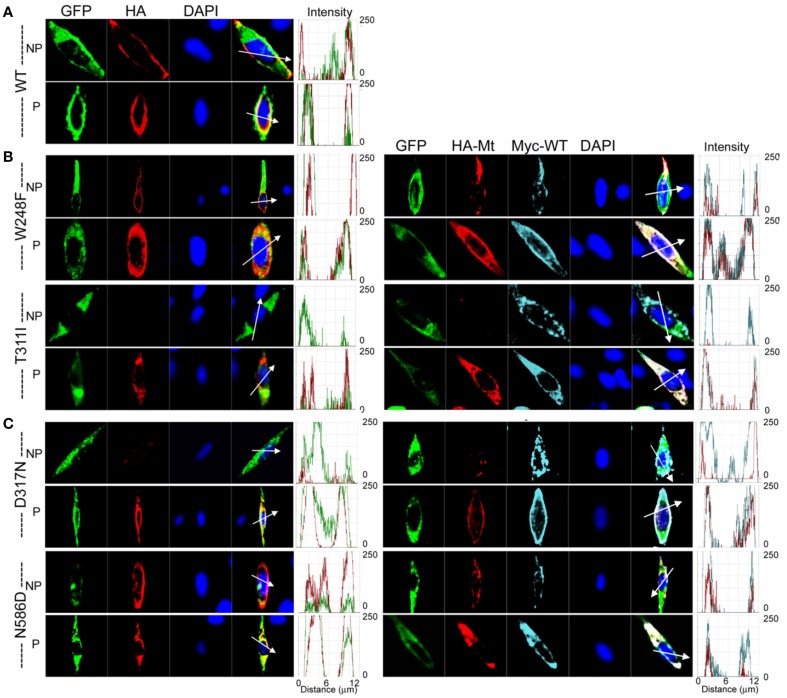
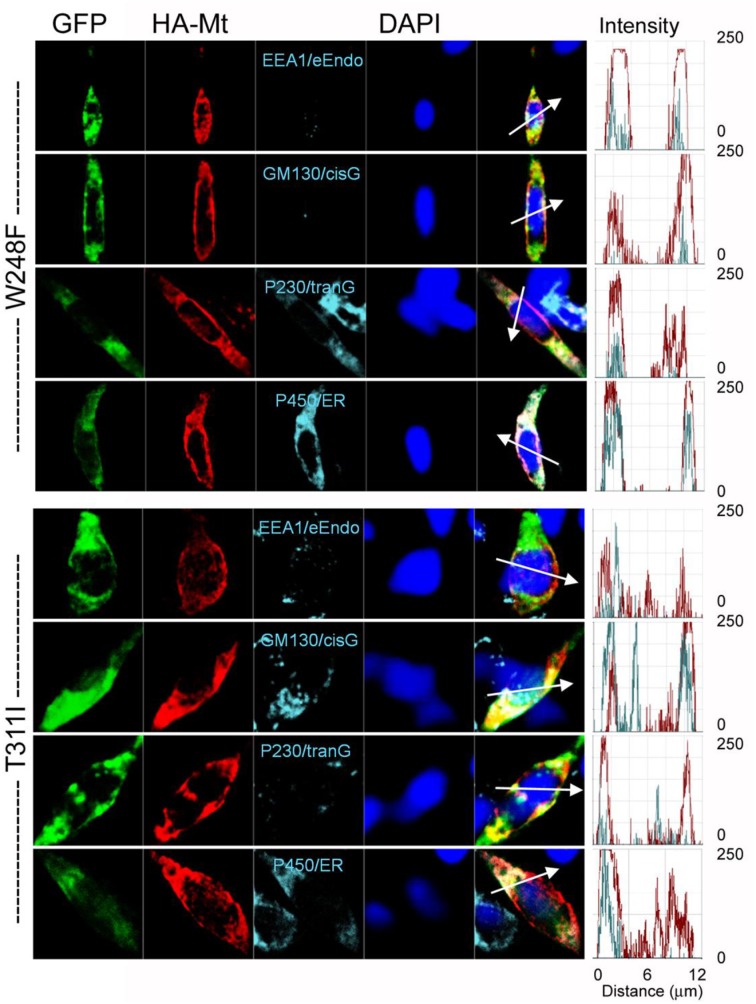
As a result of cell-specific functions of voltage-activated K(+) channels, such as Kv7.1, mutations in this channel produce profound cardiac and auditory defects. At the same time, the massive diversity of K(+) channels allows for compensatory substitution of mutant channels by other functional channels of their type to minimize defective phenotypes. Kv7.1 represents a clear example of such functional dichotomy. While several point mutations in the channel result in a cardio-auditory syndrome called Jervell and Lange-Nielsen syndrome (JLNS), about 100-fold mutations result in long QT syndrome (LQTS) denoted as Romano-Ward syndrome (RWS), which has an intact auditory phenotype. To determine whether the cellular mechanisms for the diverse phenotypic outcome of Kv7.1 mutations, are dependent on the tissue-specific function of the channel and/or specialized functions of the channel, we made series of point mutations in hKv7.1 ascribed to JLNS and RWS. For JLNS mutations, all except W248F yielded non-functional channels when expressed alone. Although W248F at the end of the S4 domain yielded a functional current, it underwent marked inactivation at positive voltages, rendering the channel non-functional. We demonstrate that by definition, none of the JLNS mutants operated in a dominant negative (DN) fashion. Instead, the JLNS mutants have impaired membrane trafficking, trapped in the endoplasmic reticulum (ER) and Cis-Golgi. The RWS mutants exhibited varied functional phenotypes. However, they can be summed up as exhibiting DN effects. Phenotypic differences between JLNS and RWS may stem from tissue-specific functional requirements of cardiac vs. inner ear non-sensory cells.
Keywords: genetic diseases; hearing loss; membrane trafficking; mutant; potassium channels.
Figures
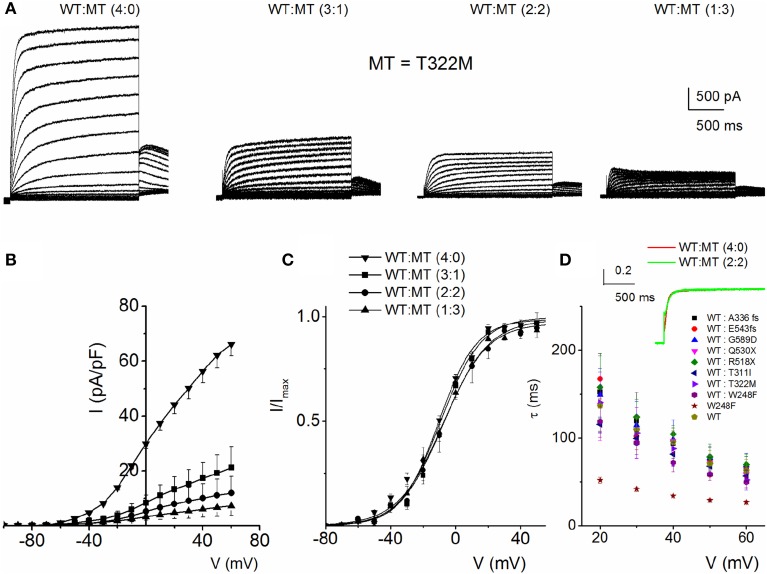
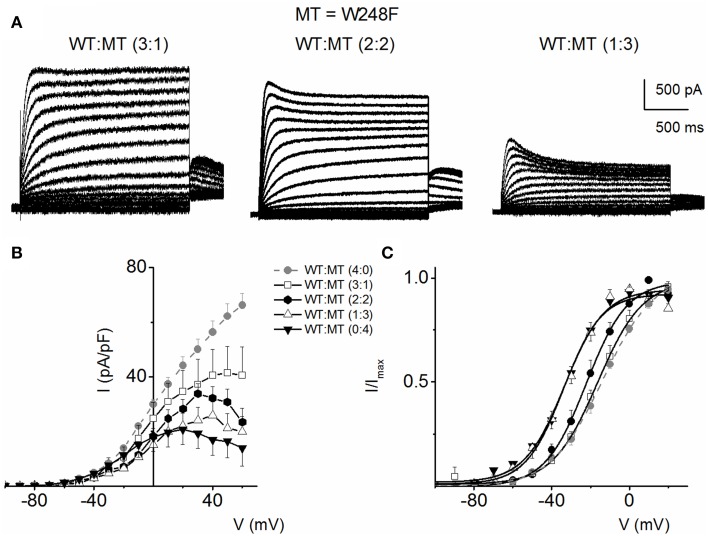
 ) with WT-hKv7.1:MT-W248F (3:1, ◻), (2:2, ⚫), (1:3, ▵) and (0:4, ▾). In contrast to the WT channel-alone outward currents, co-expression of the WT and MT, as well as the MT channel by itself, yielded currents which showed robust inward rectification at depolarizing voltages greater than 0 mV step (data were generated from 14 cells for each group (3:1), (2:2), (1:3) and (0:4). (C) Summary data of the steady-state voltage-dependent activation of WT-hKv7.1 alone (), WT-hKv7.1:MT-W248F (3:1, ◻), (2:2, ⚫), (1:3, ▵) and (0:4, ▾). The V1/2 of the steady-state activation curves of the five combinatorial expressions and the resulting currents were (in mV): WT-hKv7.1 alone (1:0), (3:1), (2:2), (1:3) and (0:4) −16.2 ± 0.9, −16.1 ± 0.8, −21.9 ± 1.6, −32.0 ± 0.7, −31.9 ± 1.2 (n = 9), respectively. The slope factors (k) of the resulting Boltzmann function curves were also not statistically different. The k values (in mV) for WT-hKv7.1 alone (),WT-hKv7.1:MT-W248F (3:1, ◻), (2:2, ⚫), (1:3, ▵) and (0:4, ▴) were 11.4 ± 0.8, 12.1 ± 0.5, 11.6 ± 1.1, 12.1 ± 0.7 and 12.2 ± 0.6 (n = 11; p = 0.7), respectively.
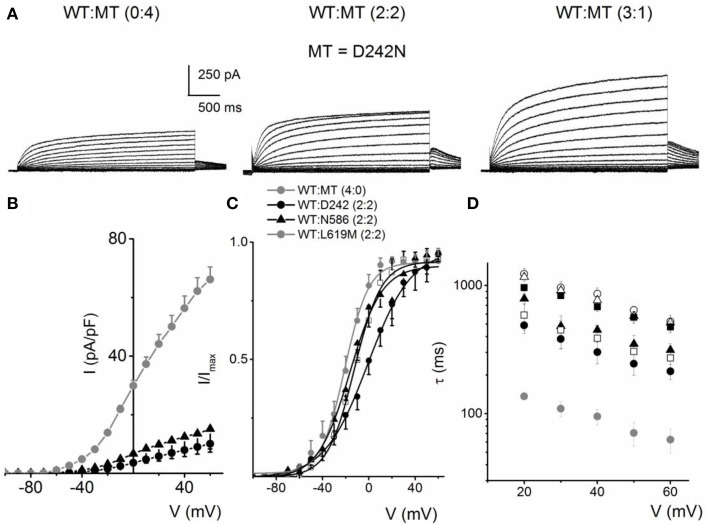 ) and a combination (ratio 2:2) of WT Kv7.1 and mutants (MT-D242N, ⚫, MT-N586D, ▴, and MT-L619M, ◻). (C) Heteromeric association between the WT hKv7.1 and MT-D242N, N586D and L619M at a ratio (2:2) altered the voltage-dependent activation of the ensuing currents. Steady-state activation curves of hKv7.1 alone () and after suppression by co-joint expression with the MT channels are shown. Tail currents were measured immediately after pulsing to −40 mV, normalized to the largest tail recorded, and plotted against the preceding pre-pulse voltages. The midpoint (V1/2, in mV) and the slope factors (k, in mV) were as follows: V1/2 and k for WT-hKv7.1 alone and in combination WT-hKv7.1:D242N, WT-hKv7.1:N586D, and WT-hKv7.1:L619M were −16.3 ± 0.8, 11.4 ± 0.9; −1.0 ± 1.5, 13.1 ± 1.1; −12.8 ± 1.2, 11.7 ± 0.6; −13.2 ± 0.9, 11.8 ± 0.9 mV (n = 10), respectively. (D) Homomeric MT channels and combined expression of the MT channels (D242N, N586D, and L619M) and WT hKv7.1 produced ~3-8-fold increase in the time constant of activation (WT-hKv7.1 (), D242N (○), N586D (▵), L619M (◾), WT-hKv7.1:D242N (2:2) (⚫), WT-hKv7.1:N586D (▴), WT-hKv7.1:L619M (◻) (n = 11 cell for each group).
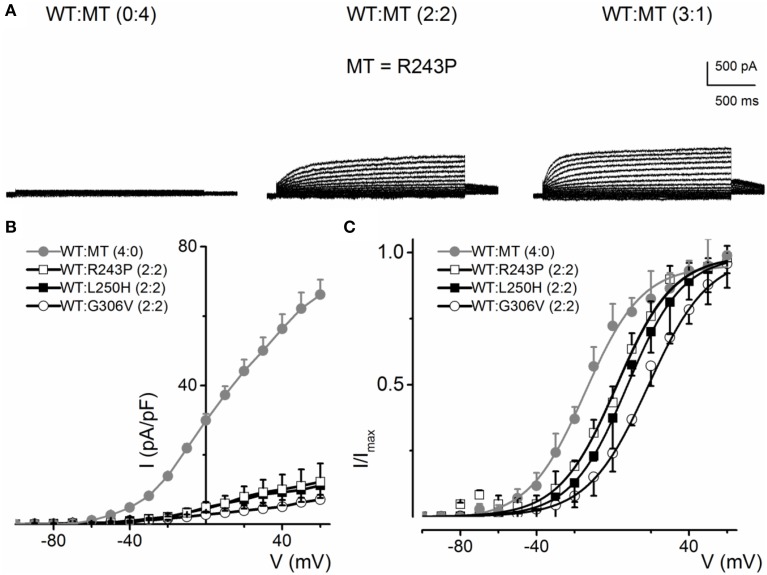 ) and a combination (ratio 2:2) of WT Kv7.1 and MTs (MT-R243P ◻, MT-L250H ◾, and MT-G306V ○). (C) Co-expression of WT hKv7.1 and MT-R243P, L250H and G306V at a ratio (2:2) produced a right-ward shift in the voltage-dependent activation of the resulting currents. Steady-state activation curves of hKv7.1 alone () and after suppression by co-expression with the MT channels are shown. Tail currents were measured at −40 mV, and normalized to the largest tail current magnitude, and plotted against the preceding pre-pulse voltages. The midpoint (V1/2, in mV) and the slope factors (k, in mV) were as follows: V1/2 and k for WT-hKv7.1 alone and in combination WT-hKv7.1:R243P, WT-hKv7.1:L250H, and WT-hKv7.1:G306V were −15.8 ± 1.2, 11.8 ± 0.9; 2.5 ± 1.1, 12.4 ± 0.6; 7.6 ± 2.2, 12.7 ± 1.0; 15.7 ± 2.4, 12.8 ± 1.6 mV (n = 11), respectively.
Similar articles
-
A novel KCNQ1 nonsense variant in the isoform-specific first exon causes both jervell and Lange-Nielsen syndrome 1 and long QT syndrome 1: a case report.BMC Med Genet. 2017 Jun 8;18(1):66. doi: 10.1186/s12881-017-0430-7. BMC Med Genet. 2017. PMID: 28595573 Free PMC article.
-
Identification of a novel KCNQ1 mutation associated with both Jervell and Lange-Nielsen and Romano-Ward forms of long QT syndrome in a Chinese family.BMC Med Genet. 2008 Apr 9;9:24. doi: 10.1186/1471-2350-9-24. BMC Med Genet. 2008. PMID: 18400097 Free PMC article.
-
LQTS in Northern BC: homozygosity for KCNQ1 V205M presents with a more severe cardiac phenotype but with minimal impact on auditory function.Clin Genet. 2014 Jul;86(1):85-90. doi: 10.1111/cge.12235. Epub 2013 Jul 30. Clin Genet. 2014. PMID: 23844633
-
[Jervell and Lange-Nielsen syndrome].Lin Chuang Er Bi Yan Hou Tou Jing Wai Ke Za Zhi. 2019 Sep;33(9):825-829. doi: 10.13201/j.issn.1001-1781.2019.09.007. Lin Chuang Er Bi Yan Hou Tou Jing Wai Ke Za Zhi. 2019. PMID: 31446697 Review. Chinese.
-
The long QT syndromes: genetic basis and clinical implications.J Am Coll Cardiol. 2000 Jul;36(1):1-12. doi: 10.1016/s0735-1097(00)00716-6. J Am Coll Cardiol. 2000. PMID: 10898405 Review.
Cited by
-
Association of the P441L KCNQ1 variant with severity of long QT syndrome and risk of cardiac events.Front Cardiovasc Med. 2022 Oct 31;9:922335. doi: 10.3389/fcvm.2022.922335. eCollection 2022. Front Cardiovasc Med. 2022. PMID: 36386331 Free PMC article.
-
Even pore-localizing missense variants at highly conserved sites in KCNQ1-encoded Kv7.1 channels may have wild-type function and not cause type 1 long QT syndrome: Do not rely solely on the genetic test company's interpretation.HeartRhythm Case Rep. 2017 Dec 11;4(2):37-44. doi: 10.1016/j.hrcr.2017.04.006. eCollection 2018 Feb. HeartRhythm Case Rep. 2017. PMID: 29876285 Free PMC article. No abstract available.
-
Long-QT founder variant T309I-Kv7.1 with dominant negative pattern may predispose delayed afterdepolarizations under β-adrenergic stimulation.Sci Rep. 2021 Feb 11;11(1):3573. doi: 10.1038/s41598-021-81670-1. Sci Rep. 2021. PMID: 33574382 Free PMC article.
-
Long QT syndrome-associated calmodulin variants disrupt the activity of the slowly activating delayed rectifier potassium channel.J Physiol. 2023 Sep;601(17):3739-3764. doi: 10.1113/JP284994. Epub 2023 Jul 10. J Physiol. 2023. PMID: 37428651 Free PMC article.
-
Molecular pathogenesis of long QT syndrome type 1.J Arrhythm. 2016 Oct;32(5):381-388. doi: 10.1016/j.joa.2015.12.006. Epub 2016 Jan 27. J Arrhythm. 2016. PMID: 27761162 Free PMC article. Review.
References
Grants and funding
LinkOut - more resources
Full Text Sources
Other Literature Sources
Molecular Biology Databases
Research Materials