

Non-canonical Notch signaling represents an ancestral mechanism to regulate neural differentiation
- PMID: 25705370
- PMCID: PMC4335385
- DOI: 10.1186/2041-9139-5-30
Non-canonical Notch signaling represents an ancestral mechanism to regulate neural differentiation
Abstract
Background: Cellular differentiation is a critical process during development of multicellular animals that must be tightly controlled in order to avoid precocious differentiation or failed generation of differentiated cell types. Research in flies, vertebrates, and nematodes has led to the identification of a conserved role for Notch signaling as a mechanism to regulate cellular differentiation regardless of tissue/cell type. Notch signaling can occur through a canonical pathway that results in the activation of hes gene expression by a complex consisting of the Notch intracellular domain, SuH, and the Mastermind co-activator. Alternatively, Notch signaling can occur via a non-canonical mechanism that does not require SuH or activation of hes gene expression. Regardless of which mechanism is being used, high Notch activity generally inhibits further differentiation, while low Notch activity promotes differentiation. Flies, vertebrates, and nematodes are all bilaterians, and it is therefore unclear if Notch regulation of differentiation is a bilaterian innovation, or if it represents a more ancient mechanism in animals.
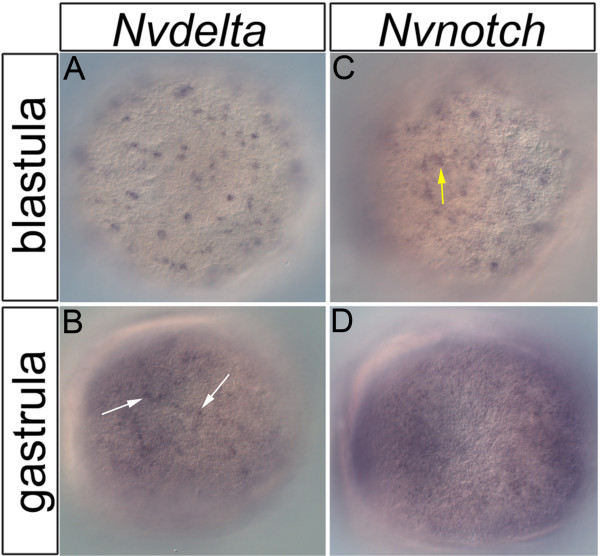
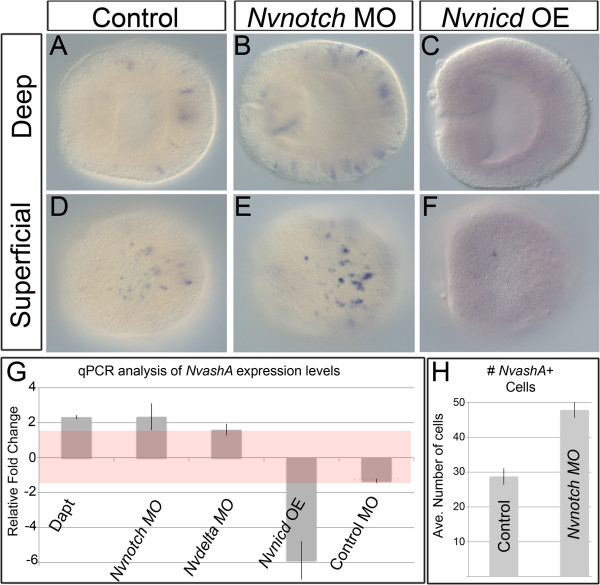
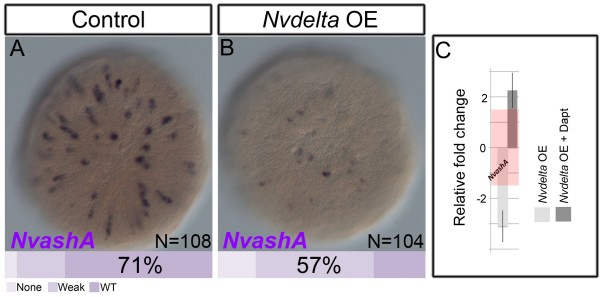
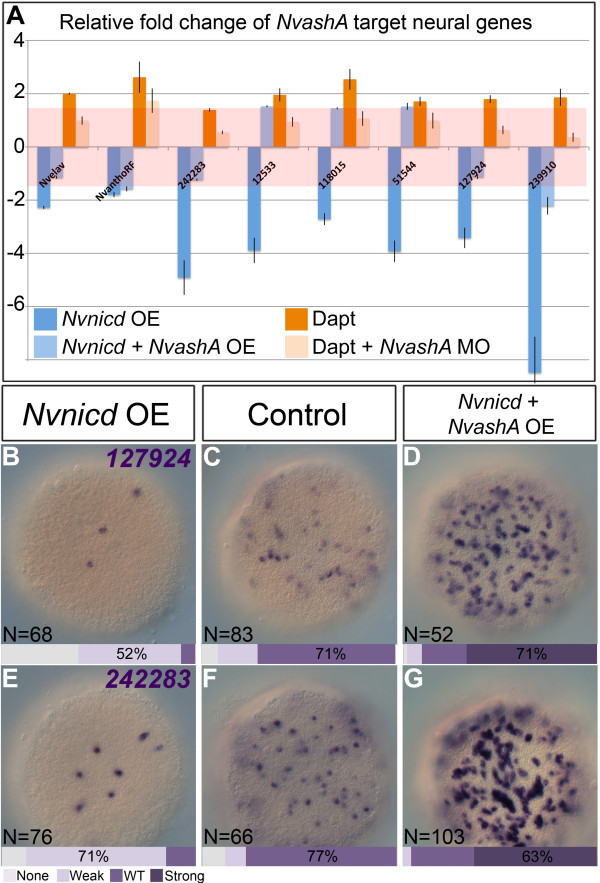
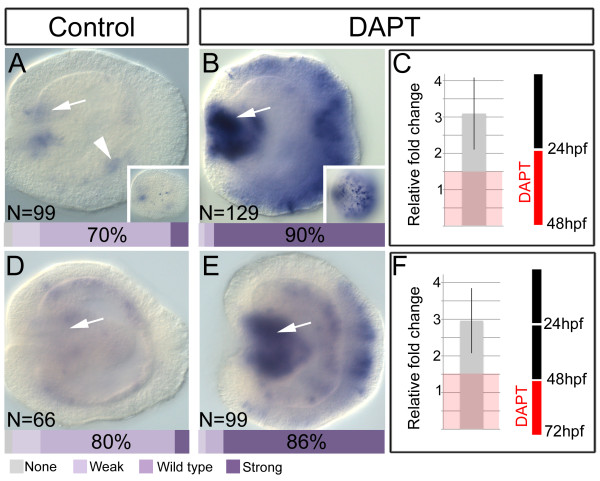
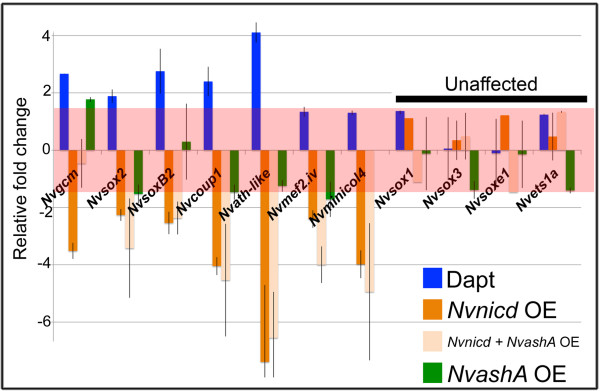
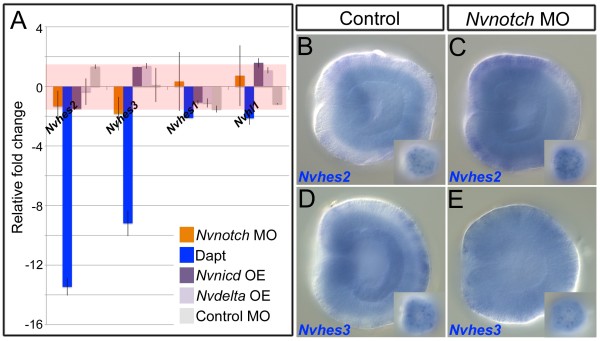
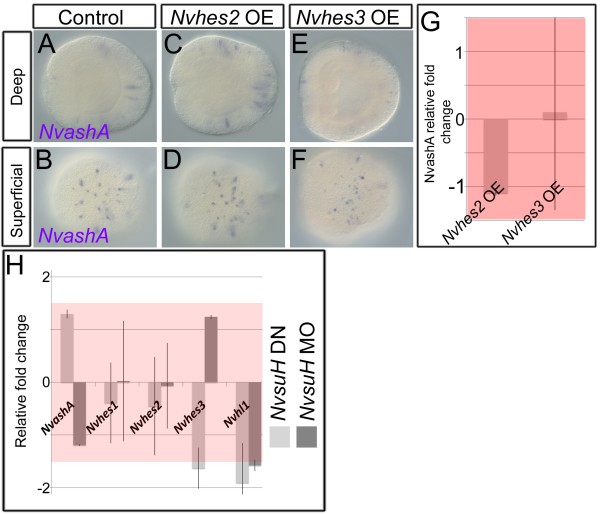
Results: To reconstruct the ancestral function of Notch signaling we investigate Notch function in a non-bilaterian animal, the sea anemone Nematostella vectensis (Cnidaria). Morpholino or pharmacological knockdown of Nvnotch causes increased expression of the neural differentiation gene NvashA. Conversely, overactivation of Notch activity resulting from overexpression of the Nvnotch intracellular domain or by overexpression of the Notch ligand Nvdelta suppresses NvashA. We also knocked down or overactivated components of the canonical Notch signaling pathway. We disrupted NvsuH with morpholino or by overexpressing a dominant negative NvsuH construct. We saw no change in expression levels for Nvhes genes or NvashA. Overexpression of Nvhes genes did not alter NvashA expression levels. Lastly, we tested additional markers associated with neuronal differentiation and observed that non-canonical Notch signaling broadly suppresses neural differentiation in Nematostella.
Conclusions: We conclude that one ancestral role for Notch in metazoans was to regulate neural differentiation. Remarkably, we found no evidence for a functional canonical Notch pathway during Nematostella embryogenesis, suggesting that the non-canonical hes-independent Notch signaling mechanism may represent an ancestral Notch signaling pathway.
Keywords: Cellular differentiation; Evolution; Nematostella vectensis; Notch; Nvnotch.
Figures
Similar articles
-
Functional roles of Notch signaling in the cnidarian Nematostella vectensis.Dev Biol. 2012 Feb 15;362(2):295-308. doi: 10.1016/j.ydbio.2011.11.012. Epub 2011 Dec 1. Dev Biol. 2012. PMID: 22155407 Free PMC article.
-
Nematostella vectensis achaete-scute homolog NvashA regulates embryonic ectodermal neurogenesis and represents an ancient component of the metazoan neural specification pathway.Development. 2012 Mar;139(5):1013-22. doi: 10.1242/dev.073221. Development. 2012. PMID: 22318631 Free PMC article.
-
Regulation of Nematostella neural progenitors by SoxB, Notch and bHLH genes.Development. 2015 Oct 1;142(19):3332-42. doi: 10.1242/dev.123745. Development. 2015. PMID: 26443634 Free PMC article.
-
Notch/Hes signaling and miR-9 engage in complex feedback interactions controlling neural progenitor cell proliferation and differentiation.Neurogenesis (Austin). 2017 May 12;4(1):e1313647. doi: 10.1080/23262133.2017.1313647. eCollection 2017. Neurogenesis (Austin). 2017. PMID: 28573150 Free PMC article. Review.
-
HES and HERP families: multiple effectors of the Notch signaling pathway.J Cell Physiol. 2003 Mar;194(3):237-55. doi: 10.1002/jcp.10208. J Cell Physiol. 2003. PMID: 12548545 Review.
Cited by
-
Histone demethylase Lsd1 is required for the differentiation of neural cells in Nematostella vectensis.Nat Commun. 2022 Jan 24;13(1):465. doi: 10.1038/s41467-022-28107-z. Nat Commun. 2022. PMID: 35075108 Free PMC article.
-
Differential gene regulation in DAPT-treated Hydra reveals candidate direct Notch signalling targets.J Cell Sci. 2021 Aug 1;134(15):jcs258768. doi: 10.1242/jcs.258768. Epub 2021 Aug 4. J Cell Sci. 2021. PMID: 34346482 Free PMC article.
-
Analysis of SMAD1/5 target genes in a sea anemone reveals ZSWIM4-6 as a novel BMP signaling modulator.Elife. 2024 Feb 7;13:e80803. doi: 10.7554/eLife.80803. Elife. 2024. PMID: 38323609 Free PMC article.
-
The cnidarian origin of the proto-oncogenes NF-κB/STAT and WNT-like oncogenic pathway drives the ctenophores (Review).Int J Oncol. 2015 Oct;47(4):1211-29. doi: 10.3892/ijo.2015.3102. Epub 2015 Jul 23. Int J Oncol. 2015. PMID: 26239915 Free PMC article. Review.
-
Phylogenetic evidence for the modular evolution of metazoan signalling pathways.Philos Trans R Soc Lond B Biol Sci. 2017 Feb 5;372(1713):20150477. doi: 10.1098/rstb.2015.0477. Philos Trans R Soc Lond B Biol Sci. 2017. PMID: 27994120 Free PMC article. Review.
References
-
- Ryan JF, Pang K, Schnitzler CE, Nguyen AD, Moreland RT, Simmons DK, Koch BJ, Francis WR, Havlak P, Comparative Sequencing Program NISC, Smith SA, Putnam NH, Haddock SHD, Dunn CW, Wolfsberg TG, Mullikin JC, Martindale MQ, Baxevanis AD. The genome of the ctenophore mnemiopsis leidyi and its implications for cell type evolution. Science. 2013;342 doi:1126/science. 124592. - PMC - PubMed
-
- Dunn CW, Hejnol A, Matus DQ, Pang K, Browne WE, Smith SA, Seaver E, Rouse GW, Obst M, Edgecombe GD, Sørensen MV, Haddock SHD, Schmidt-Rhaesa A, Okusu A, Kristensen RM, Wheeler WC, Martindale MQ, Giribet G. Broad phylogenomic sampling improves resolution of the animal tree of life. Nature. 2008;452:745–749. doi: 10.1038/nature06614. - DOI - PubMed
-
- Srivastava M, Begovic E, Chapman J, Putnam NH, Hellsten U, Kawashima T, Kuo A, Mitros T, Salamov A, Carpenter ML, Signorovitch AY, Moreno MA, Kamm K, Grimwood J, Schmutz J, Shapiro H, Grigoriev IV, Buss LW, Schierwater B, Dellaporta SL, Rokhsar DS. The Trichoplax genome and the nature of placozoans. Nature. 2008;454:955–960. doi: 10.1038/nature07191. - DOI - PubMed
-
- Srivastava M, Simakov O, Chapman J, Fahey B, Gauthier MEA, Mitros T, Richards GS, Conaco C, Dacre M, Hellsten U, Larroux C, Putnam NH, Stanke M, Adamska M, Darling A, Degnan SM, Oakley TH, Plachetzki DC, Zhai Y, Adamski M, Calcino A, Cummins SF, Goodstein DM, Harris C, Jackson DJ, Leys SP, Shu S, Woodcroft BJ, Vervoort M, Kosik KS. et al.The Amphimedon queenslandica genome and the evolution of animal complexity. Nature. 2010;466:720–726. doi: 10.1038/nature09201. - DOI - PMC - PubMed
-
- Liu J, Sato C, Cerletti M, Wagers A. Notch Signaling in the Regulation of Stem Cell Self-Renewal and Differentiation. Curr Top Dev Biol. 2010;92:367–409. - PubMed
Grants and funding
LinkOut - more resources
Full Text Sources
Other Literature Sources
