Validating a new methodology for optical probe design and image registration in fNIRS studies
- PMID: 25705757
- PMCID: PMC4431570
- DOI: 10.1016/j.neuroimage.2014.11.022
Validating a new methodology for optical probe design and image registration in fNIRS studies
Abstract
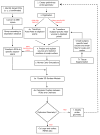
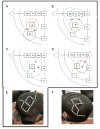
Functional near-infrared spectroscopy (fNIRS) is an imaging technique that relies on the principle of shining near-infrared light through tissue to detect changes in hemodynamic activation. An important methodological issue encountered is the creation of optimized probe geometry for fNIRS recordings. Here, across three experiments, we describe and validate a processing pipeline designed to create an optimized, yet scalable probe geometry based on selected regions of interest (ROIs) from the functional magnetic resonance imaging (fMRI) literature. In experiment 1, we created a probe geometry optimized to record changes in activation from target ROIs important for visual working memory. Positions of the sources and detectors of the probe geometry on an adult head were digitized using a motion sensor and projected onto a generic adult atlas and a segmented head obtained from the subject's MRI scan. In experiment 2, the same probe geometry was scaled down to fit a child's head and later digitized and projected onto the generic adult atlas and a segmented volume obtained from the child's MRI scan. Using visualization tools and by quantifying the amount of intersection between target ROIs and channels, we show that out of 21 ROIs, 17 and 19 ROIs intersected with fNIRS channels from the adult and child probe geometries, respectively. Further, both the adult atlas and adult subject-specific MRI approaches yielded similar results and can be used interchangeably. However, results suggest that segmented heads obtained from MRI scans be used for registering children's data. Finally, in experiment 3, we further validated our processing pipeline by creating a different probe geometry designed to record from target ROIs involved in language and motor processing.
Conflict of interest statement
DAB's interests were reviewed and are managed by Massachusetts General Hospital and Partners HealthCare in accordance with their conflict of interest policies.
Figures


Similar articles
-
Validating an image-based fNIRS approach with fMRI and a working memory task.Neuroimage. 2017 Feb 15;147:204-218. doi: 10.1016/j.neuroimage.2016.12.007. Epub 2016 Dec 8. Neuroimage. 2017. PMID: 27939793
-
Bayesian filtering of human brain hemodynamic activity elicited by visual short-term maintenance recorded through functional near-infrared spectroscopy (fNIRS).Opt Express. 2010 Dec 6;18(25):26550-68. doi: 10.1364/OE.18.026550. Opt Express. 2010. PMID: 21165006
-
Spatial registration for functional near-infrared spectroscopy: from channel position on the scalp to cortical location in individual and group analyses.Neuroimage. 2014 Jan 15;85 Pt 1:92-103. doi: 10.1016/j.neuroimage.2013.07.025. Epub 2013 Jul 25. Neuroimage. 2014. PMID: 23891905 Review.
-
A human brain atlas derived via n-cut parcellation of resting-state and task-based fMRI data.Magn Reson Imaging. 2016 Feb;34(2):209-18. doi: 10.1016/j.mri.2015.10.036. Epub 2015 Oct 31. Magn Reson Imaging. 2016. PMID: 26523655 Free PMC article.
-
A brief review on the use of functional near-infrared spectroscopy (fNIRS) for language imaging studies in human newborns and adults.Brain Lang. 2012 May;121(2):79-89. doi: 10.1016/j.bandl.2011.03.009. Epub 2011 Apr 19. Brain Lang. 2012. PMID: 21507474 Review.
Cited by
-
Processing pipeline for image reconstructed fNIRS analysis using both MRI templates and individual anatomy.Neurophotonics. 2021 Apr;8(2):025010. doi: 10.1117/1.NPh.8.2.025010. Epub 2021 Jun 12. Neurophotonics. 2021. PMID: 35106319 Free PMC article.
-
Optical imaging and spectroscopy for the study of the human brain: status report.Neurophotonics. 2022 Aug;9(Suppl 2):S24001. doi: 10.1117/1.NPh.9.S2.S24001. Epub 2022 Aug 30. Neurophotonics. 2022. PMID: 36052058 Free PMC article.
-
Photogrammetry-based stereoscopic optode registration method for functional near-infrared spectroscopy.J Biomed Opt. 2020 Sep;25(9):095001. doi: 10.1117/1.JBO.25.9.095001. J Biomed Opt. 2020. PMID: 32880124 Free PMC article.
-
Early adversity in rural India impacts the brain networks underlying visual working memory.Dev Sci. 2019 Sep;22(5):e12822. doi: 10.1111/desc.12822. Epub 2019 Mar 21. Dev Sci. 2019. PMID: 30803122 Free PMC article.
-
Guiding functional near-infrared spectroscopy optode-layout design using individual (f)MRI data: effects on signal strength.Neurophotonics. 2021 Apr;8(2):025012. doi: 10.1117/1.NPh.8.2.025012. Epub 2021 Jun 17. Neurophotonics. 2021. PMID: 34155480 Free PMC article.
References
-
- Alloway TP. Working memory, reading, and mathematical skills in children with developmental coordination disorder. J Exp Child Psychol. 2007;96:20–36. - PubMed
-
- Boas DA, Elwell CE, Ferrari M, Taga G. Twenty years of functional near-infrared spectroscopy: introduction for the special issue. Neurolmage. 2014;85(Pt 1):1–5. - PubMed
Publication types
MeSH terms
Grants and funding
LinkOut - more resources
Full Text Sources
