. 2015 Feb 23;10(2):e0116948.
doi: 10.1371/journal.pone.0116948. eCollection 2015.

Requirement of cAMP signaling for Schwann cell differentiation restricts the onset of myelination

Affiliations

Requirement of cAMP signaling for Schwann cell differentiation restricts the onset of myelination

Ketty Bacallao et al. PLoS One. .

Abstract

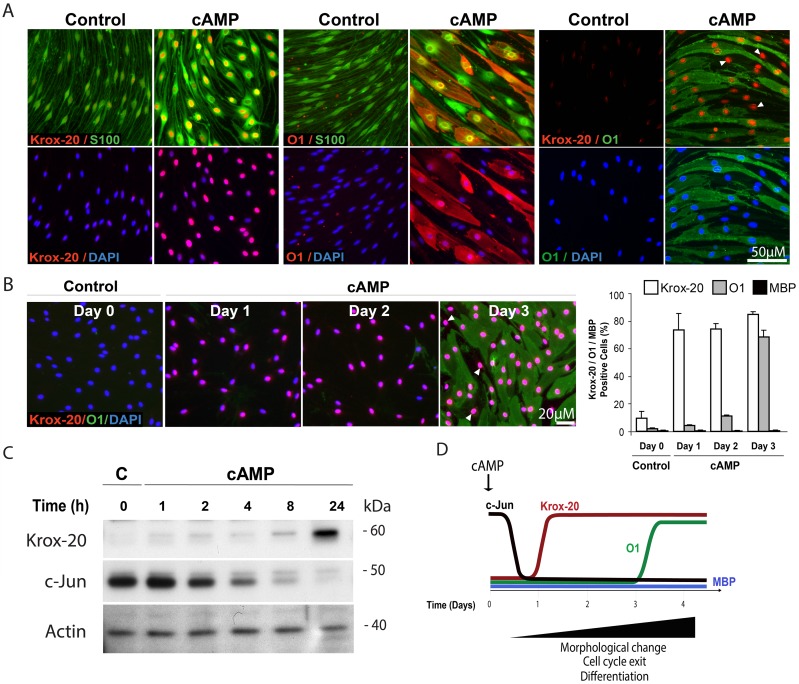
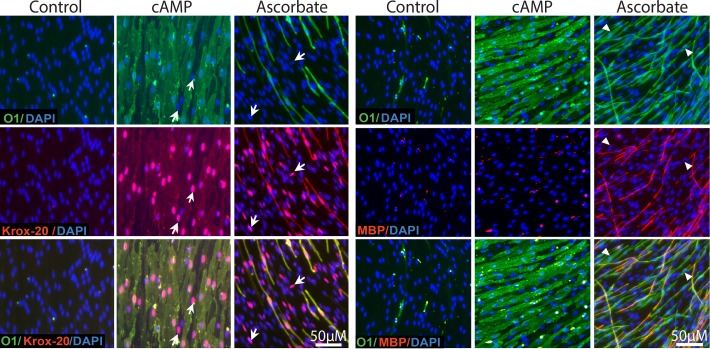
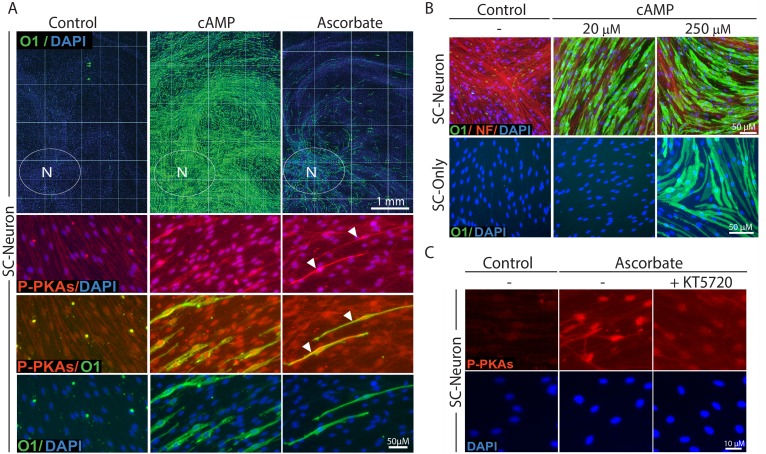
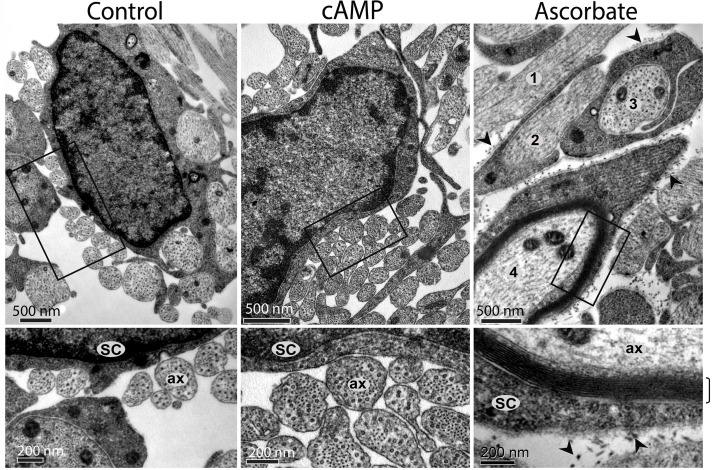
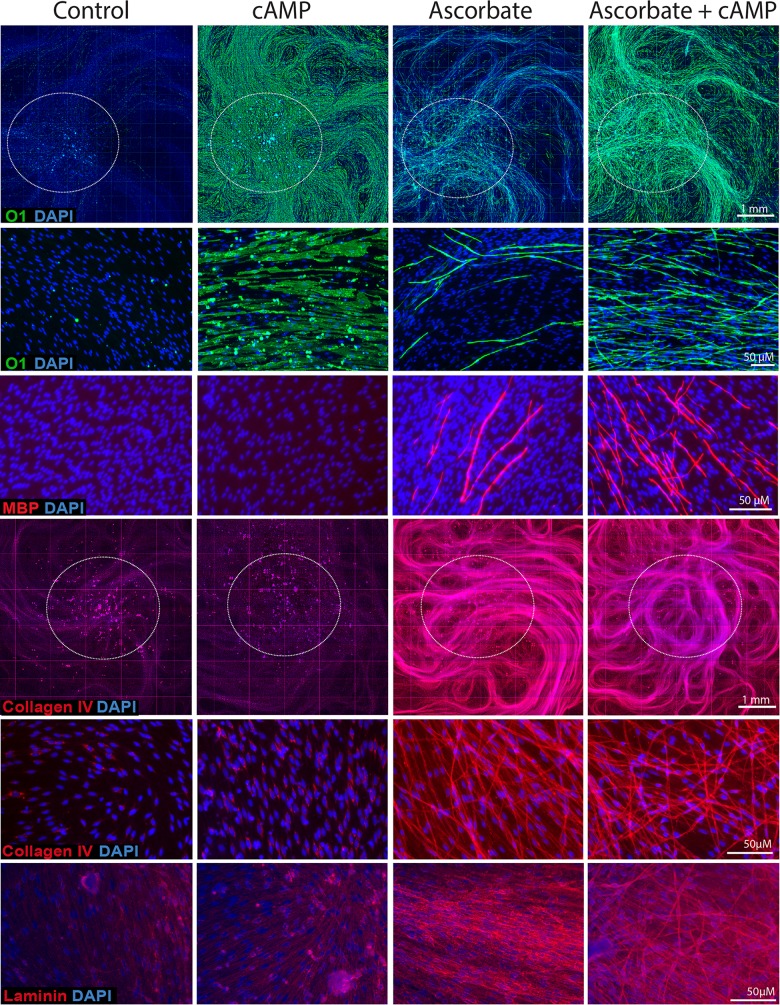
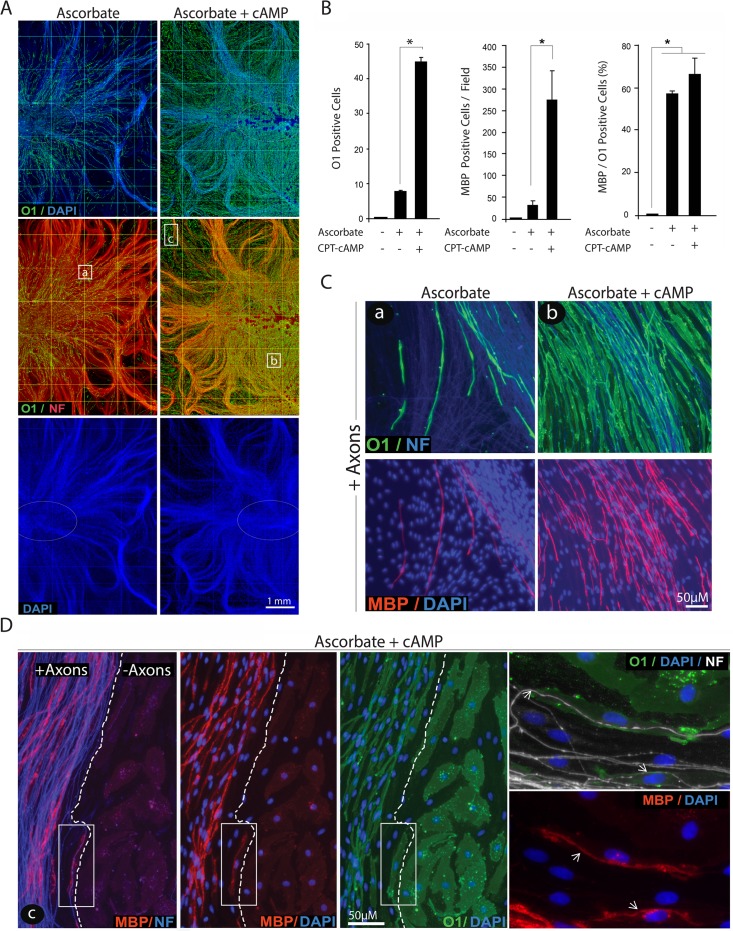
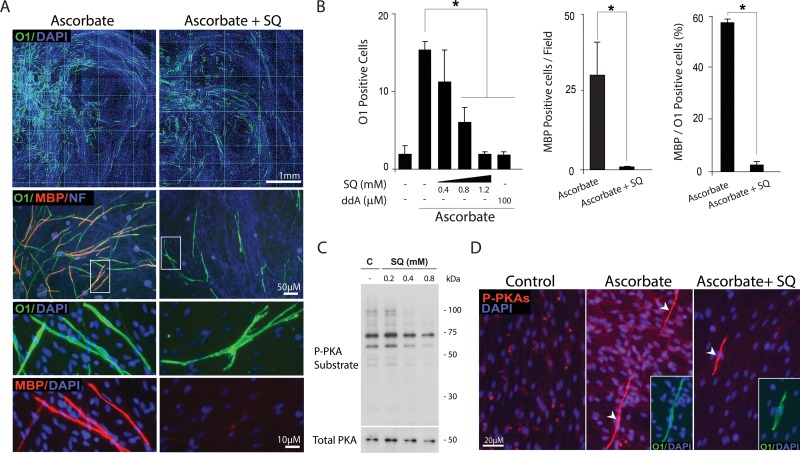
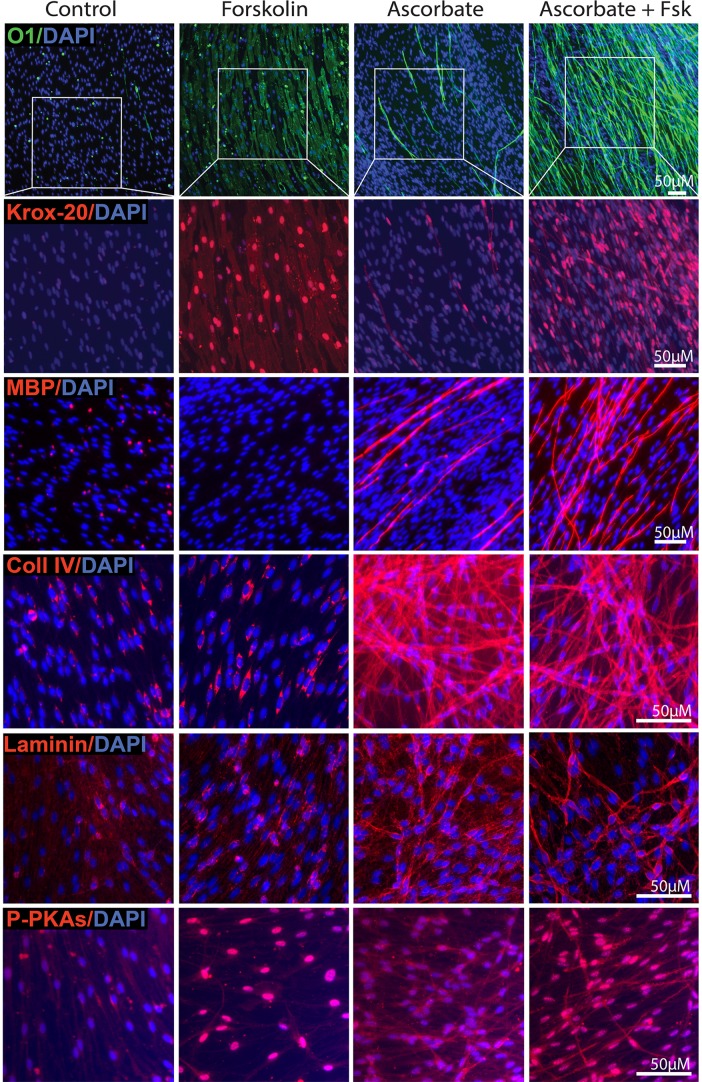
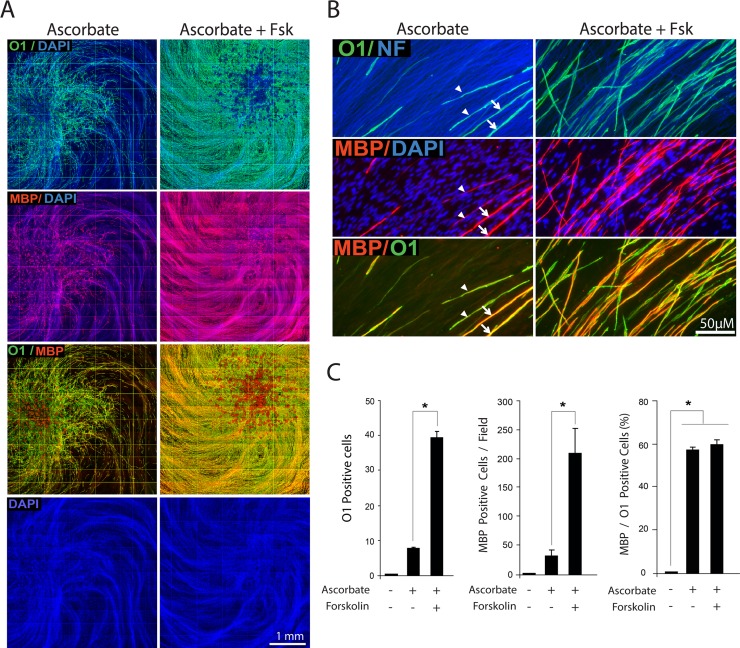
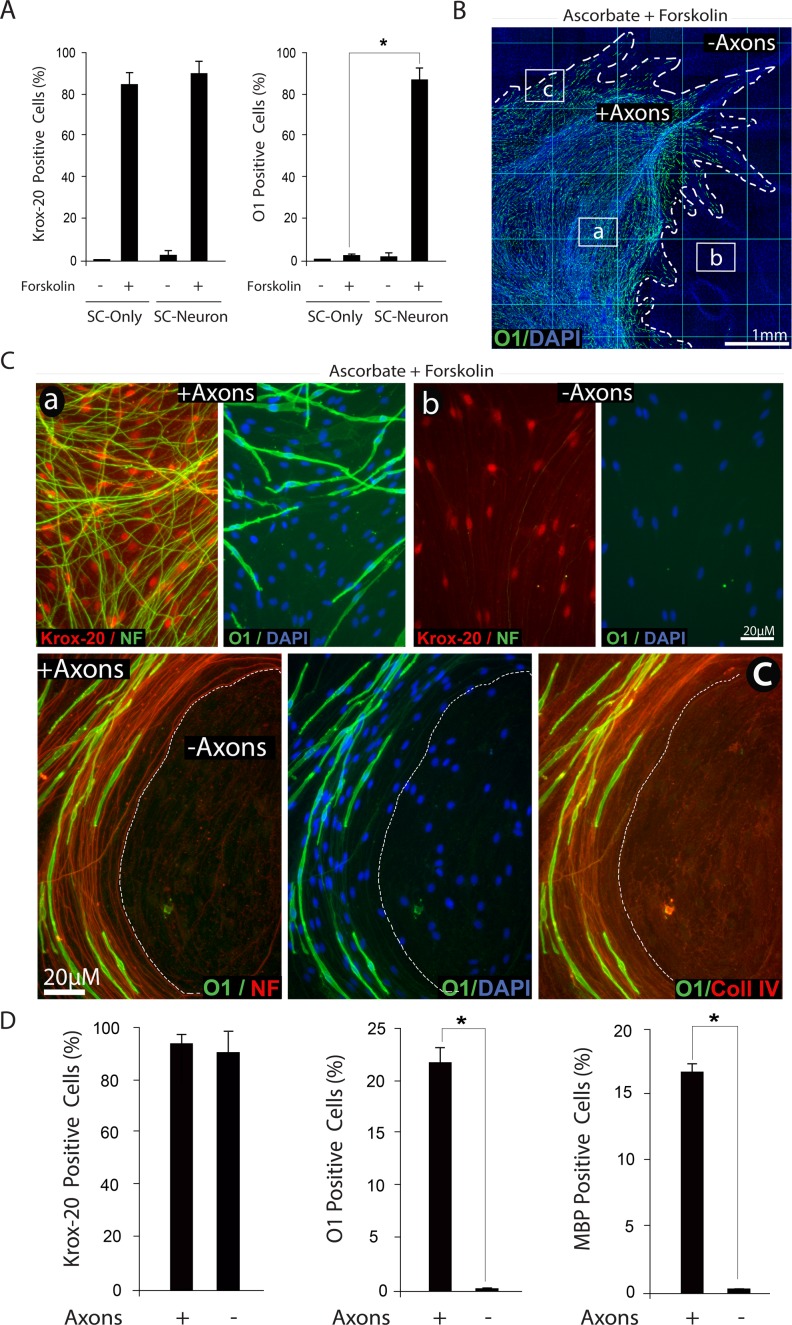
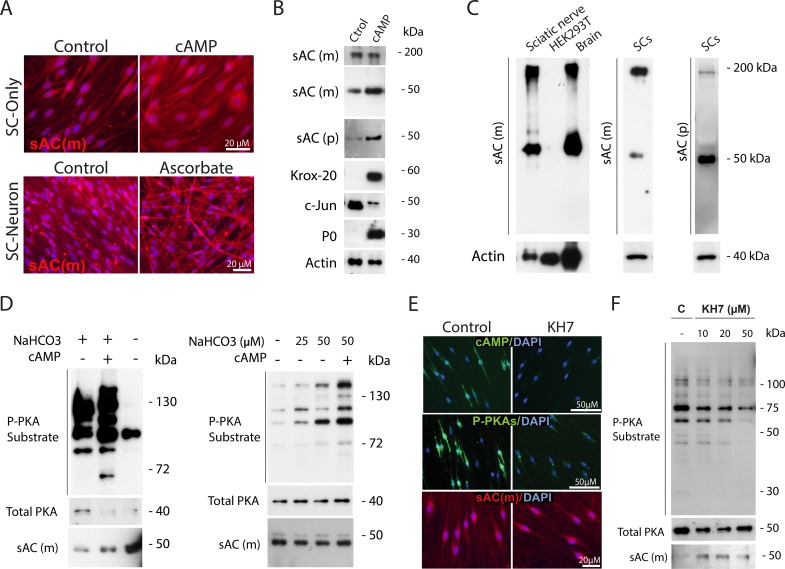
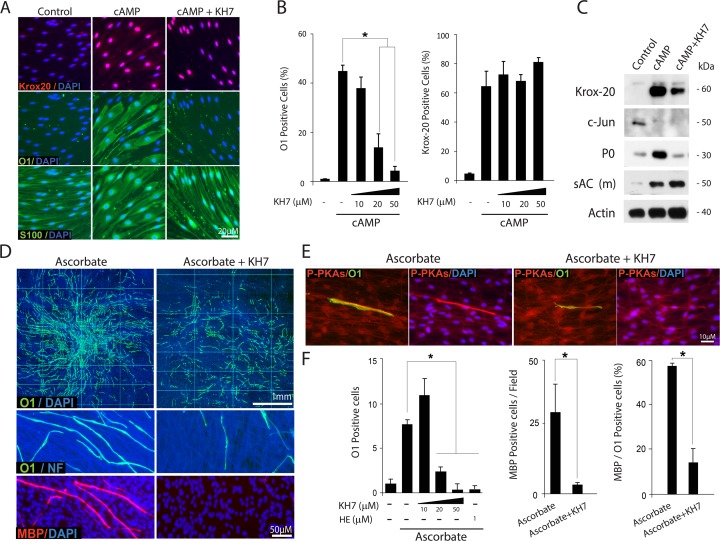
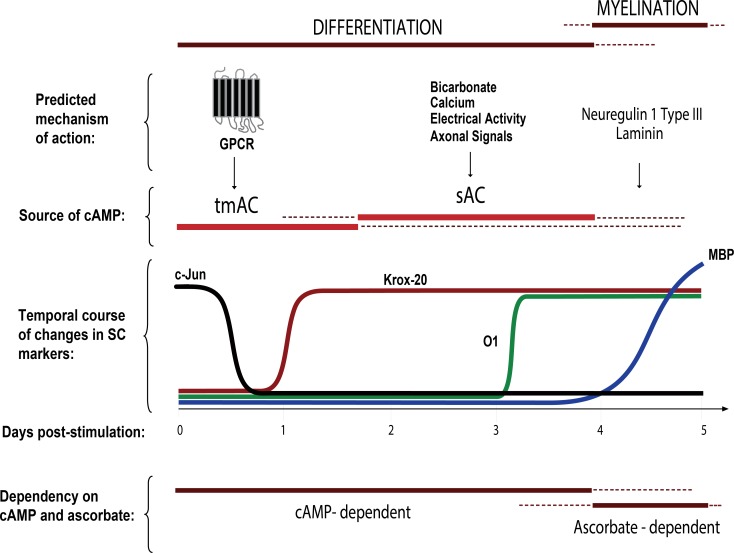
Isolated Schwann cells (SCs) respond to cAMP elevation by adopting a differentiated post-mitotic state that exhibits high levels of Krox-20, a transcriptional enhancer of myelination, and mature SC markers such as the myelin lipid galactocerebroside (O1). To address how cAMP controls myelination, we performed a series of cell culture experiments which compared the differentiating responses of isolated and axon-related SCs to cAMP analogs and ascorbate, a known inducer of axon ensheathment, basal lamina formation and myelination. In axon-related SCs, cAMP induced the expression of Krox-20 and O1 without a concomitant increase in the expression of myelin basic protein (MBP) and without promoting axon ensheathment, collagen synthesis or basal lamina assembly. When cAMP was provided together with ascorbate, a dramatic enhancement of MBP expression occurred, indicating that cAMP primes SCs to form myelin only under conditions supportive of basal lamina formation. Experiments using a combination of cell permeable cAMP analogs and type-selective adenylyl cyclase (AC) agonists and antagonists revealed that selective transmembrane AC (tmAC) activation with forskolin was not sufficient for full SC differentiation and that the attainment of an O1 positive state also relied on the activity of the soluble AC (sAC), a bicarbonate sensor that is insensitive to forskolin and GPCR activation. Pharmacological and immunological evidence indicated that SCs expressed sAC and that sAC activity was required for morphological differentiation and the expression of myelin markers such as O1 and protein zero. To conclude, our data indicates that cAMP did not directly drive myelination but rather the transition into an O1 positive state, which is perhaps the most critical cAMP-dependent rate limiting step for the onset of myelination. The temporally restricted role of cAMP in inducing differentiation independently of basal lamina formation provides a clear example of the uncoupling of signals controlling differentiation and myelination in SCs.


Conflict of interest statement

Competing Interests: The authors have declared that no competing interests exist.

Figures

Fig 1
Fig 1. Induction of Krox-20 and O1 expression but not MBP in cAMP-treated isolated SCs.
The figure depicts the temporal progression of phenotypic changes during cAMP-induced differentiation in isolated nerve-derived SC cultures. SCs were subjected to mitogen and serum starvation (Methods) prior to treatment with CPT-cAMP (250 μM) for 3 days unless otherwise indicated. The control condition in this and subsequent figures refers to cells that were incubated in the absence of cAMP-stimulating agents for the whole time course of the experiment. In panels B-C, the control (C) condition refers to cells that were fixed or lysed for analysis at the time of stimulation (day/hour zero). Cells were analyzed for the expression of c-Jun, Krox-20, O1 and MBP by immunofluorescence microscopy and western blot, as marked in the figure. In A, SCs were co-stained with the SC-specific marker S-100 to label all cells and reveal the changes in cell morphology that occur in response to prolonged CPT-cAMP stimulation. The schematic diagram (D) depicts the temporal course of changes during cAMP-induced differentiation as revealed by this and our previous time course studies [8]. Arrowheads in A-B point out to representative Krox-20 positive cells (nuclear localization) that fail to express O1. Cells that labeled positive for O1 and negative for Krox-20 were not found. Of note, staining with MBP antibodies did not detect a specific signal in either control or cAMP-treated cells (B, quantification shown on the right). All antibodies used are indicated in the figure; nuclei were labeled with DAPI (blue) in this and all subsequent figures.
Fig 2
Fig 2. Induction of Krox-20 and O1 expression but not MBP in cAMP-treated SC-neuron cultures.
SCs growing in co-culture with purified DRG neurons were established and stimulated as described in Methods. Co-cultures were left untreated (control), treated with CPT-cAMP (20 μM) or ascorbate (50 μg/ml), and analyzed by immunofluorescence microscopy 12 days after treatment initiation. A side-by-side analysis of Krox-20, O1 and MBP expression is shown. In this and all other experiments, specific treatments were provided every 3 days throughout the time course of the experiment. Representative areas of SC-neuron cultures where SCs maintain an association with DRG axons were selected to denote the quality of the changes in SC differentiation. Prolonged CPT-cAMP administration induced Krox-20 and O1 expression in the majority of the SCs but failed to induce myelination, as judged by the enlarged, non-compacted morphology of the O1 positive SCs and their lack of MBP expression. The arrows indicate representative Krox-20 positive, O1 negative SCs (left panels); the arrowheads indicate O1 positive, MBP negative SCs (right panels). Virtually no O1 negative, MBP positive cells were observed under this or any other culture condition.
Fig 3
Fig 3. Induction of O1 expression in cAMP-treated SC-neuron cultures: dose dependency, spatial distribution and comparison to ascorbate’s effect.
SCs growing alone (SC-only) or together with purified DRG neurons (SC-neuron) were treated with CPT-cAMP (20 μM unless otherwise specified) or ascorbate (50 μg/ml) and analyzed by immunofluorescence microscopy at 12 days (A, upper panels), 5 days (A, lower panels, and C) or 3 days (B) after treatment initiation. Representative cultures are shown at low (A, upper panels) and high magnification (A, lower panels, and B-C) to represent the magnitude and quality of the changes in O1 expression, respectively. Note that ascorbate induced the appearance of O1 positive cells only in a minor proportion of the SC population that was usually restricted to the axonal environment adjacent to the neuronal bodies (N, white ovals). On the contrary, cAMP induced O1 expression in the majority of the SCs regardless of their relative location within the axonal web. Images of double immunostaining with O1 and P-PKA substrate (P-PKAs) antibodies are shown to denote the effectiveness of cAMP and ascorbate treatment (A, lower panels). As a control for signal specificity, SC-neuron cultures were treated with ascorbate in the absence or presence of the PKA antagonist KT5720 (0.5 μM) prior to cell fixation and immunostaining with P-PKA substrate antibodies (C). The arrowheads in B point out to O1 positive cells that display high cytoplasmic P-PKA substrate labeling along the main axis of the cell. In this and all subsequent experiments, P-PKA substrate immunoreactivity is shown at 5 days post-stimulation because the signal intensity usually declines thereafter.
Fig 4
Fig 4. Absence of axon ensheathment, myelin and basal lamina in cAMP-treated SC-neuron cultures.
Cells that were subjected to the same experimental treatments as in Fig. 2 were fixed and analyzed by TEM (Methods). Higher magnification images of selected areas (boxes) are shown to better resolve the interaction between SC processes (SC) and axons (ax). As opposed to ascorbate, CPT-cAMP treatment did not support the ensheathment of axons, the formation of a basal lamina, the deposition of extracellular collagen fibers (arrowheads) or the production of myelin membranes (bracket). Similar to the control condition (left panels), CPT-cAMP-treated SCs (cAMP) associated with multiple low diameter axons leaving many neurites deprived of direct contact with SC processes. The asynchronous responses in myelination induced by ascorbate are illustrated by the multiple ensheathment profiles shown in the upper right panel, as follows: (1) – No ensheathment; (2) Partial ensheathment; (3) Complete ensheathment, no myelin; (4) Complete ensheathment, myelin.
Fig 5
Fig 5. Expression of markers of differentiation and basal lamina in SC-neuron cultures treated with CPT-cAMP and ascorbate provided alone and in combination.
SC-neuron cultures were obtained and stimulated essentially as described in Fig. 2A with the exception of the inclusion of a condition where CPT-cAMP (20 μM) was provided together with ascorbate (right panels). Cultures were stained with antibodies against O1, MPB, collagen type IV and laminin, as indicated. Low magnification composites of representative cultures stained with O1 (green staining) and collagen type IV (red staining) are shown to reveal changes over a large surface area. The region that contains the neuronal bodies is indicated by the white circles in each panel. Higher magnification (20x) images are shown for all markers. Note the widespread action of cAMP to increase O1 expression throughout the culture system regardless of the presence of ascorbate. Likewise, note the widespread action of ascorbate to increase collagen type IV expression regardless of the presence of cAMP. In ascorbate-free medium, some SCs exhibit cytoplasmic granules of collagen type IV. In ascorbate-containing medium, on the contrary, the expression of collagen type IV and laminin were mostly extracellular. Similar to collagen type IV and laminin, MBP expression was only detected in the presence of ascorbate. Contrary to collagen type IV and laminin, MBP expression was greatly enhanced by the addition of cAMP. Despite the widespread deposition of extracellular collagen type IV fibers by most SCs, only a proportion of these cells exhibited O1 and MPB expression.
Fig 6
Fig 6. Induction of O1 and MBP expression by combined administration of cAMP and ascorbate: spatial distribution of O1 and MPB positive cells and dependency on axonal contact.
Experimental conditions were identical to those of Fig. 5. In A, low magnification composites of representative cultures stained with O1 (green), neurofilament (red) and DAPI (blue) are shown to reveal the effect of the indicated treatments on O1 expression with respect to the location of the neuronal bodies (white ovals), the extension of the neurite substrate (neurofilament, NF) and the distribution of the SCs (DAPI). A quantitative analysis of O1 and MBP expression is provided in B (Methods). This analysis confirmed that cAMP enhanced the total number of O1 and MBP positive cells without concomitantly increasing the MBP/O1 ratio. Selected areas within the center (a, b) and periphery (c) of the axonal outgrowth are shown at higher magnification in C and D, respectively, to reveal details of the morphology of the cells, the relationship to axons and the co-localization of O1 (green) and MBP (red). Whereas O1 positive cells could be found throughout the culture system, MBP positive cells were found exclusively within the axonal network (C, D). Images taken at the frontier of the axonal outgrowth (D) revealed that MBP rather than O1 expression was restricted to those SCs that established a direct contact with the axons, as revealed by neurofilament staining (dotted lines). The boxed area in panel D was enlarged to better resolve the distribution of the MBP staining with respect to the position of the axons (NF, arrows), the plasma membrane (O1) and the nuclei of the cells (DAPI). In these and all subsequent graphs, bar heights are means of triplicate determinations; error bars represent S.D, and * represents statistical significance for p < 0.05.
Fig 7
Fig 7. Reduction of O1 and MBP expression by pharmacological inhibition of the tmAC.
SC-neuron cultures were induced to produce myelin by treatment with ascorbate in the absence (Control) or presence of SQ22536 (SQ), which was provided at 0.8 μM unless otherwise indicated. Treatment was carried out for 12 days (A-B) and 5 days (D), respectively. Cultures were analyzed for their expression of O1 and MBP (A-B) or O1 and P-PKA-specific substrates (D) by immunofluorescence microscopy. A quantification of O1 and MBP expression is provided in B, which also includes a condition where mtAC activity was inhibited by dideoxy-adenosine (ddA). As shown in A, some SCs displayed high levels of cell surface O1 even in the presence of SQ22536. However, these cells did not convert into myelinating cells, as denoted by their multiple processes (indicative of failure to establish a one-to-one association with axons) and lack of MBP expression. The dose dependency of P-PKA substrate expression by increasing concentrations of SQ22536 was confirmed by western blot analysis in SC-only cultures (C). The arrowheads in B indicate a source of P-PKA substrate immunoreactivity exclusively present in differentiating O1 positive cells (boxes) that was insensitive to inhibition by SQ22536.
Fig 8
Fig 8. Expression of markers of differentiation and basal lamina in SC-neuron cultures treated with forskolin and ascorbate provided alone and in combination.
The overall experimental design and analysis by immunofluorescence microscopy matched the one of Fig. 5 with the exception that forskolin (0.5 μM) was provided to the culture medium instead of CPT-cAMP. Cultures were stained with antibodies against O1, Krox-20, MPB, collagen type IV, laminin and P-PKA substrates, as indicated. High magnification images are shown for all markers. The areas demarked by the white boxes (upper panels) were enlarged in the panels below for better visualization of Krox-20 expression. Similar to CPT-cAMP, forskolin effectively enhanced the expression of Krox-20 and O1 but not that of MBP, collagen IV or laminin despite effectively increasing the phosphorylation of PKA substrates in all cells. In the presence of ascorbate, forskolin consistently enhanced MBP expression without further increasing the expression of basal lamina constituents.
Fig 9
Fig 9. Induction of O1 and MBP expression by combined administration of forskolin and ascorbate: spatial distribution and quantitative analysis of O1 and MPB positive cells.
Forskolin was provided to SC-neuron cultures together with ascorbate essentially as described in Fig. 8. Low magnification composites of representative cultures (A) are shown along with selected high magnification areas (B) to reveal the effect of the indicated treatments on O1 and MBP expression. The quantitative analysis provided in panel C confirmed that similar to CPT-cAMP, forskolin effectively enhanced O1 and MBP expression without concurrently increasing the MBP/O1 ratio. The DAPI channel in A (bottom panel) is shown to serve as an indication of unchanged cell density in forskolin-treated cultures. The arrowheads and arrows (B, left panels) point out to representative O1 positive cells exhibiting thin and thick myelin, respectively, as denoted by the intensity of MBP positive myelin segments. This heterogeneity of MBP staining in individual cells was not evident in forskokin-treated cultures (B, right panels), possibly due to increased synchronization in the myelination process.
Fig 10
Fig 10. Induction of Krox-20, O1 and MBP expression by combined administration of forskolin and ascorbate: dependency on axonal contact.
Experiments in SC-neuron cultures were identical to those described in Fig. 8, with the exception of experiments shown in panel A, where the responses of isolated (SC-only) and axon-related SCs (SC-neuron) were compared at 3 days post-stimulation. Representative areas located within (a), outside (b) and at the frontier (c) of the axonal outgrowth are shown at high magnification to reveal details of the morphology of the cells, their relationship to axons (neurofilament staining, NF) and their expression of Krox-20, O1 and collagen type IV, as indicated. In panel B, a low magnification image of a representative SC-neuron culture treated with ascorbate and forskolin is shown to provide a reference to the relative location of the areas displayed in C. Note the selective distribution of O1 positive cells (green) with respect to the total number of cells (DAPI) and the extension of the neurite outgrowth (dotted lines). A quantification of the percentage of Krox-20, O1 and MBP positive cells in selected areas within (+ axons) and outside (- axons) the axonal outgrowth is provided in panel D. Whereas Krox-20 expression was enhanced throughout the culture system, the expression of O1 and MBP was confined to those SCs that physically interacted with axons (C). Note that even those SCs that do not contact axons exhibit a profile of extracellular collagen IV expression (C, lower panels).
Fig 11
Fig 11. Expression and activity of sAC in cultured SCs: changes with differentiation, responsiveness to bicarbonate stimulation and pharmacological inhibition with KH7.
In panel A, sAC expression was detected in non-differentiated (control) and differentiated SCs (i.e. cells treated with CPT-cAMP, 250 μM, for 3 days) and SC-neuron cultures non-treated (control) and treated with ascorbate for 12 days. Western blot analysis of control and cAMP-treated SCs with two different anti-sAC antibodies (a sAC monoclonal, sAC-m, and a sAC polycolnal, sAC-p) revealed the expression of two distinct sAC immunoreactive bands that migrated at ~180 kDa (full length sAC) and ~50 kDa (truncated sAC isoform), respectively. The ~50 kDa protein was increased upon treatment with cAMP (B). In panel C, the specificity of sAC detection was confirmed in samples of purified SCs, sciatic nerve extracts, brain extract (positive control) and HEK293T cells (negative control). In D (left panel), SCs growing in bicarbonate-containing DMEM medium (alone or together with CPT-cAMP, 250 μM) or bicarbonate-free DMEM medium for 3 days were collected for western blot analysis using antibodies against P-PKA substrates, total PKA and sAC. In D (right panels), SCs were incubated in bicarbonate-free DMEM for 24 hours and then, stimulated with the indicated concentrations of sodium bicarbonate (NaHCO3) alone or together with CPT-cAMP for an additional 24 hour period. In panels E-F, SC-only cultures were starved of mitogens and serum for 3 days and left untreated (control) or treated with KH7, which was provided at 20 μM unless otherwise indicated. Cells were treated for 30 min (E) and 24 hours (F) prior to analysis by immunofluorescence microscopy and western blot, respectively. In E, cultures were analyzed for their immunoreactivity with antibodies against cAMP (upper panels), P-PKA substrates (middle panels) and sAC (lower panel). The high levels of cAMP and P-PKA substrate expression in non-stimulated SCs, along with their sensitivity to bicarbonate stimulation and KH7 inhibition, are indicative of constitutive sAC activity.
Fig 12
Fig 12. Inhibition of O1 expression and morphological differentiation by pharmacological sAC antagonists.
The experimental design and analysis of results carried out using SC-only (A-C) and SC-neuron cultures (D-F) were identical to those of previous figures. In panels A-C, isolated SCs were left untreated (control) or treated with cAMP (CPT-cAMP, 250 μM) in the absence or presence of increasing doses of KH7, as indicated. In panels D-F, SC-neuron cultures were stimulated with ascorbate-containing medium in the absence (control) or presence of KH7, which was used at 20 μM unless otherwise stated in the figure. Cultures were double-immunostained with antibodies against O1 and MBP (D) or O1 and P-PKA substrates (E). Data presentation and quantitative analysis of Krox-20, O1 and MBP expression was done as previously described. In panel F, a condition that used 2-hydroxy-estradiol (HE) was included in the quantitative analysis of O1 expression for confirmation of results. KH7 abrogated the morphological transformation associated with the differentiation of isolated (A, S100 expression) and axon-related SCs (D-E, O1 expression). KH7 diminished the total levels of expression of O1 (A-B and D-F), P0 (C) and MBP (D-F) without reducing the expression of Krox-20 (A-C) or increasing that of c-Jun (C).
Fig 13
Fig 13. Requirement of cAMP signaling restricts the onset of myelination.
Our cell culture studies revealed a crucial role for GPCR-sensitive and GPCR-insensitive sources of cAMP (namely tmAC and sAC) in driving SC differentiation into an O1 phenotype, a stage that precedes MBP expression and the formation of myelin sheaths. For practical purposes, we selected the markers Krox-20, O1 and MBP as phenotypic indicators of the early, mid-term and later stages of differentiation, respectively. We propose a mechanistic model that predicts an orderly requirement of signals from activated Gαs-coupled GPCRs (e.g. Gpr126), sAC (e.g. electrical activity, bicarbonate, and axonal signals), axon contact (e.g. neuregulin type III) and/or basal lamina components (e.g. laminin) prior to the initiation of myelin membrane wrapping. Data also suggests that sAC activation in SCs may depend on yet-to-be-identified axonal/neuronal factors.

Similar articles

Cited by

References

    1. Bunge MB, Clark MB, Dean AC, Eldridge CF, Bunge RP (1990) Schwann cell function depends upon axonal signals and basal lamina components. Ann N Y Acad Sci 580: 281–287. - PubMed
    1. Birchmeier C, Nave KA (2008) Neuregulin-1, a key axonal signal that drives Schwann cell growth and differentiation. Glia 56: 1491–1497. 10.1002/glia.20753 - DOI - PubMed
    1. Court FA, Wrabetz L, Feltri ML (2006) Basal lamina: Schwann cells wrap to the rhythm of space-time. Curr Opin Neurobiol 16: 501–507. - PubMed
    1. Jessen KR, Mirsky R (2008) Negative regulation of myelination: relevance for development, injury, and demyelinating disease. Glia 56: 1552–1565. 10.1002/glia.20761 - DOI - PubMed
    1. Topilko P, Schneider-Maunoury S, Levi G, Baron-Van Evercooren A, Chennoufi AB, et al. (1994) Krox-20 controls myelination in the peripheral nervous system. Nature 371: 796–799. - PubMed

Publication types

MeSH terms

LinkOut - more resources