Review
. 2015 Apr;22(3):204-218.
doi: 10.1111/micc.12195.

Robust and fragile aspects of cortical blood flow in relation to the underlying angioarchitecture

Affiliations
Review

Robust and fragile aspects of cortical blood flow in relation to the underlying angioarchitecture

Andy Y Shih et al. Microcirculation. 2015 Apr.

Abstract

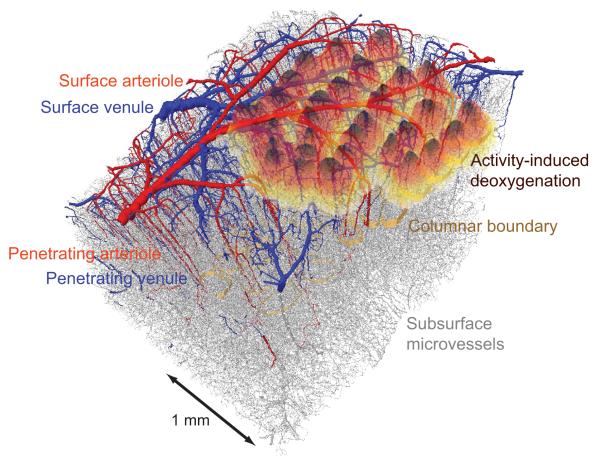
We review the organizational principles of the cortical vasculature and the underlying patterns of blood flow under normal conditions and in response to occlusion of single vessels. The cortex is sourced by a two-dimensional network of pial arterioles that feeds a three-dimensional network of subsurface microvessels in close proximity to neurons and glia. Blood flow within the surface and subsurface networks is largely insensitive to occlusion of a single vessel within either network. However, the penetrating arterioles that connect the pial network to the subsurface network are bottlenecks to flow; occlusion of even a single penetrating arteriole results in the death of a 500 μm diameter cylinder of cortical tissue despite the potential for collateral flow through microvessels. This pattern of flow is consistent with that calculated from a full reconstruction of the angioarchitecture. Conceptually, collateral flow is insufficient to compensate for the occlusion of a penetrating arteriole because penetrating venules act as shunts of blood that flows through collaterals. Future directions that stem from the analysis of the angioarchitecture concern cellular-level issues, in particular the regulation of blood flow within the subsurface microvascular network, and system-level issues, in particular the role of penetrating arteriole occlusions in human cognitive impairment.

Keywords: imaging; microvessels; penetrating vessels; pial vessels; rodent.


Figures

Figure 1
Figure 1. A vectorized data set of all vasculature in a block of parietal cortex that encompasses the primary vibrissa representation
The block is 2 mm by 3 mm by 1.2 mm thick. Surface and penetrating arterioles are colored red, venules blue, and the borders of cortical columns denoted by a golden band. A map of brain activity is superimposed. It was obtained from the contralateral hemisphere using intrinsic optical signal through a thinned-skull window. The animals were anesthetized with isoflurane so that only a net deoxyhemoglobin signal is observed by reflectance of 625 - nm light when individual vibrissae were deflected at 10 Hz for 4 s. The responses from all columns were normalized in amplitude and thresholded to avoid spatial overlap, and are superimposed on the vectorized data set. This new data was obtained using the methodology in Blinder et al. [17].
Figure 2
Figure 2. The pial surface forms a two dimensional network
(a) Representative example of a complete tracing of the vasculature fed by the middle cerebral artery. Parts that form loops are highlighted with black edges and red vertices, while non-backbone offshoots are shown in green. Adapted from Blinder et al. [21]. (b). Stimulation of the footpad in the urethane anesthetized rat leads to local dilation but surrounding constriction of surface arterioles. Data in the left panel shows the evoked neuronal response, using ball electrode measurements of surface potentials, from nine different locations are shown. The strongest amplitude and fastest rise time was marked as the center of the receptive field. The middle panel shows a vascular map with the center of the receptive filed marked by a blue circle and arteriolar diameter change as a function of time and distance from the center. All data is shown as a fractional change relative to the baseline, i.e., Δd/d, and dilation and constriction are plotted upward and downward respectively. The right panel is an average of arteriolar diameter changes within 0.5 mm from the center of neuronal response (blue), in a 0.5 - 1.5 mm annulus around the center (green) and 1.5 - 2.5 mm ring around the center (red) for all data from this animal. Adapted from Devor et al. [28]. (c). Occlusion to a single surface arteriole leads to reversal of flow in the immediate downstream vessel and mild adjustment of flow in all branches. Data from rat anesthetized with urethane. On the left and right are in vivo two-photon images taken before and after photo-thrombotic clotting of an individual vessel, respectively. Left-center and right-center are diagrams of the surface vasculature with RBC speeds and directions indicated. The yellow “X” indicates the location of the clot, and vessels whose flow direction has reversed are indicated with red arrows. Adapter from Schaffer et al. [33].
Figure 3
Figure 3. Stimulus driven and spontaneous vascular dynamics in the cortex of awake mice have similar amplitudes
(a) Schematic of the experimental setup. The awake mouse is head-fixed by means of a bolt and sits passively in an acrylic cylinder beneath the two-photon microscope. Air puffers for sensory stimulation are aimed at the vibrissa and, as a control, at the tail. (b) Example of evoked and spontaneous diameter change for a 30 s stimulus. (c, d) Relationship between peak value of the dilation and vessel diameter. Data for arteries is in red and for veins is in blue. Grey area shows the 0.2-μm resolution limit of detectable changes. Panel c shows the peak averaged dilation responses in the first 1 to 10 s of a 30 s vibrissae stimulation; the regression line has a statistically significant slope of −0.007/μm. Panel d shows the peak of spontaneous dilation; the regression line has a statistically significant slope of −0.004/μm. The regression for veins (not shown) is not significantly different from zero in either case. Adapted from Drew et al. [39].
Figure 4
Figure 4. The subsurface microvasculature forms a three dimensional network that is largely insensitive to occlusion in one microvessel
(a) Numerical section of a vectorized network from a complete reconstruction (Figure 1). (b) Close up of the section in panel a showing only the microvasculature. The colored edges highlight a loop that consists of eight branches, each with a distinct color. Panels a and b adapted from Blinder et al. [17]. (c) Schematic of the microvasculature labeled with the order of downstream vessels, i.e., D1 through D4 in this picture, from a point of occlusion. (d) The fraction of speed in downstream microvessels after an occlusion, yellow “X” in panel c, relative to that before the occlusion. The data is averaged over twenty networks in terms of downstream branch number. Panels c and d adapted from Nishimura et al. [46].
Figure 5
Figure 5. The penetrating arterioles are a fragile link in the delivery of blood from the surface arterioles to the subsurface microvascular network
(a) Numerical section of a vectorized network from a complete reconstruction (Figure. 1) that highlights the penetrating arterioles (red) and venules (blue) and the continuous microvascular network (gray). Adapted from Blinder et al. [17]. (b) The fraction of speed in neighboring microvessels that lie in cortical layers 2/3 after an occlusion to a single microvessel, relative to that before the occlusion. Only some of the data points could be specified in terms of downstream branch number, as shown. The thick red line through the data is the smoothed response averaged over a window that included 50 points, with ± 1 SEM limits indicated by the thin red lines. The data is averaged over 16 networks. Adapted from Nishimura et al. [23].
Figure 6
Figure 6. Occlusion to one penetrating arteriole results in neuronal death and formation of a cyst
(a) In vivo two-photon imaging of neuronal activity in the forelimb region of somatosensory cortex of an α-chloralose anesthetized rat that was loaded with the [Ca2+] indicator OGB1-AM and the astrocyte-specific dye SR101. The single penetrating arteriole marked by a yellow “X” was occluded. (b) Wave of cortical spreading depression, propagating at 46 μm/s, observed by in vivo [Ca2+] imaging (yellow dashed line) about 30 minutes after occlusion of the penetrating arteriole (yellow arrow, left). Panels a and b adapted from Shih et al. [47]. (c) Maximal projection through a 200-μm depth of a Cx3cr1eGFP/+ mouse cortex before (left) and 100 minutes after (right) occlusion of a single penetrating arteriole using targeted optical activation of the photothrombotic agent Rose Bengal (arrow) made 1 day after implantation of a transcranial window [52]. Dashed lines indicate the boundaries of the penetrating artery in which flow was blocked (yellow “X”). (d) Extent of the infarct, for the same mouse as in panel c, visualized 2 day after the optically generated stroke. The bright green fluorescence indicates the invasion of eGFP-labeled microglia into a cyst of necrotic tissue. Adapted from Drew et al. [52].
Figure 7
Figure 7. The calculated pattern of blood flow for a full reconstruction of the vasculature (Figure 1) accounts for the measured degradation in flow after blocking a single penetrating arteriole
(a) Reduction of the angioarchitecture to vertices (green dots) and branches (red). The resistance of each branch depends on the radius and length, L. (b) Plot of the flow resistance,ρ, per unit length as a function of vessel radius (solid curve); the total resistance is found by multiplying ρ by the length, in micrometers. Note the marked increase in resistance for radii below ~ 5 μm. The Hagen-Poiseuille law is given by the dashed curve. The concurrent histogram shows the distribution of vessel radii for all vessels. (c) Vectorized vasculature in which the blood flow through a single penetrating arteriole is numerically labeled to determine the spatial domain of vessels that receive at least half of their flow from the chosen penetrating arteriole. This exercise is repeated for all penetrating arterioles and each domain is additionally labeled by the flux through the penetrating vessel. (d) Plot of the computed vascular perfusion domains versus flux in the penetrating arteriole. The volume of the parenchymal domains (115 domains in 4 data sets; colored circles) are consistent with measured cyst volumes formed after a single artery occlusion (11 rats). (e) Schematic of the microvasculature labeled with the order of downstream vessels, i.e., D1 through D4 in this picture, from a point of occlusion of an individual penetrating arteriole. (f) The calculated redistribution of flow in microvessels, up to 15 edges downstream from the sites of simulated occlusion of selected, individual penetrating arterioles. The reduction in vascular flux is plotted as a function of the order of the downstream vessel (red circles are the results of 100 simulations per order of the downstream edge and red diamonds are the median reduction in flux). These numerical results are compared with the published in vivo data of downstream flux measurement before and after penetrating arteriole occlusion in rat neocortex (green points are data from 175 vessels with median values shown as yellow and green diamonds). All panels adapted from [17].
Figure 8
Figure 8. A two-dimensional lattice model of the vasculature that approximates the measured degradation in flow after blocking a single penetrating arteriole
(a) Planar circuit with a rhombic lattice and two penetrating venules for each penetrating arteriole, consistent with measurements of actual penetrating arteriole vs. ascending venule densities.. Blockage of a penetrating arteriole leads to a region of no flow with an effective radius of 0.9-times the median spacing between penetrating venules, whereas blockage of a penetrating venule leads to a region of no flow with an effective radius of 0.5-times the median spacing between penetrating venules. Adapted from Blinder et al. [17]. (b) Comparison of the prediction from the lattice model and data for flow in downstream microvessels after blockage to a penetrating arteriole. Adapted from Nishimura et al. [48] and Blinder et al. [17]. (c) Comparison of the prediction from the lattice model and data for flow in upstream microvessels after blockage to a penetrating venule. Adapted from Nguyen et al. [25] and Blinder et al. [17].
Figure 9
Figure 9. Pericytes are a potential means for the brain to control its own blood supply
The data are maximum projections though stacks of confocal images from a transgenic mouse brain that expressed NG2::dsRed (red), i.e., the fluorescent protein dsRed is linked to expression of NG2 [72]. The animal was perfused with a fluorescein-labeled albumin gelatin [1] (green) and sections were labeled with α-desmin antibody (white) and stained for DAPI (blue) to identify cell nuclei. (a) Overview with areas noted for detailed analysis. Projection across 37 sections in 1.05 μm steps. The fluorescein channel is saturated and desmin channel is excluded. (b) Illustration of a penetration arteriole, with staining for both NG2 and desmin (arrows point to expression at cuts through lumen) other channels are excluded. Projection across 43 sections in 1.0 μm steps. (c, d) High magnification view of microvessels and, presumably, pericytes with lack of labeling for desmin. Projection is across 32 sections in 1.0 μm steps. (e) Proposed dual-recombinase strategy to form a transgenic animal that labels pericytes but not smooth muscle. We cross the Ai3 reporter mouse [76] (Jax: 007903) with the tamoxifen-indicable NG2::CreERTM driver mouse [73] (Jax: 008538), and then a hypothetical desmin::Flp driver mouse. The expressing cells should be pericyte, as indicated, as well as oligodendrocyte precursors and sparse labeled neurons. “BAP” stands for the broadly active promoter plus a set of cis-regulatory sequences and “eYFP” for enhanced yellow fluorescent protein.
Figure 10
Figure 10. Neuropathological evidence of “invisible” lesions in the aging human brain
(a) Example of gray matter microinfarcts in a light-level microscopy neuropathological study by Sofroniew and Vinters [96]. (b) Detection of cerebral microinfarcts with fluid attenuation inversion recovery (FLAIR) magnetic resonance imaging (MRI) at 7 Tesla. Adapted from Brundel et al. [97]. (c) Detection of cerebral microbleeds with T2* gradient echo MRI at 3T. Adapted from De Reuck et al. [98].

Similar articles

Cited by

References

    1. Tsai PS, Kaufhold J, Blinder P, Friedman B, Drew P, Karten HJ, Lyden PD, Kleinfeld D. Correlations of neuronal and microvascular densities in murine cortex revealed by direct counting and colocalization of cell nuclei and microvessels. Journal of Neuroscience. 2009;18:14553–14570. - PMC - PubMed
    1. Kleinfeld D, Denk W. Two-photon imaging of neocortical microcirculation. In: Yuste R, Lanni F, Konnerth A, editors. Imaging Neurons: A Laboratory Manual. Cold Spring Harbor Laboratory Press; Cold Spring Harbor: 1999. pp. 23.1–23.15.
    1. Tsai PS, Kleinfeld D. In vivo two-photon laser scanning microscopy with concurrent plasma-mediated ablation: Principles and hardware realization. In: Frostig RD, editor. Methods for In Vivo Optical Imaging. 2nd edition CRC Press; Boca Raton: 2009. pp. 59–115. - PubMed
    1. Kleinfeld D, Mitra PP. Applications of spectral methods in functional brain imaging. In: Yuste R, editor. Imaging: A Laboratory Manual. Cold Spring Harbor Laboratory Press; New York: 2011. pp. 12.1–12.7.
    1. Shih AY, Mateo C, Drew PJ, Tsai PS, Kleinfeld D. A polished and reinforced thinned skull window for long-term imaging and optical manipulation of the mouse cortex. Journal of Visualized Experiments. 2012 http://www.jove.com/video/3742 - PMC - PubMed

Publication types

LinkOut - more resources