. 2015 Apr;18(4):553-561.
doi: 10.1038/nn.3957. Epub 2015 Feb 23.

Neuronal ensembles sufficient for recovery sleep and the sedative actions of α2 adrenergic agonists

Affiliations

Neuronal ensembles sufficient for recovery sleep and the sedative actions of α2 adrenergic agonists

Zhe Zhang et al. Nat Neurosci. 2015 Apr.

Abstract

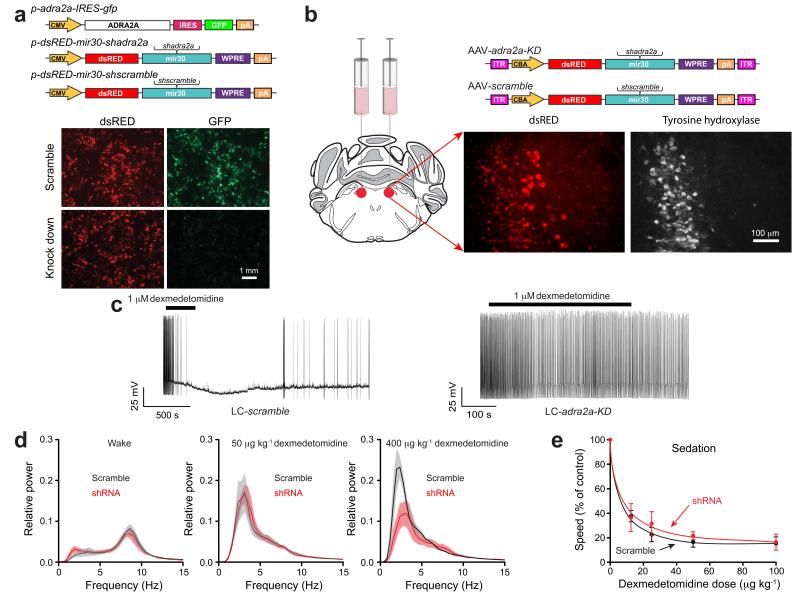
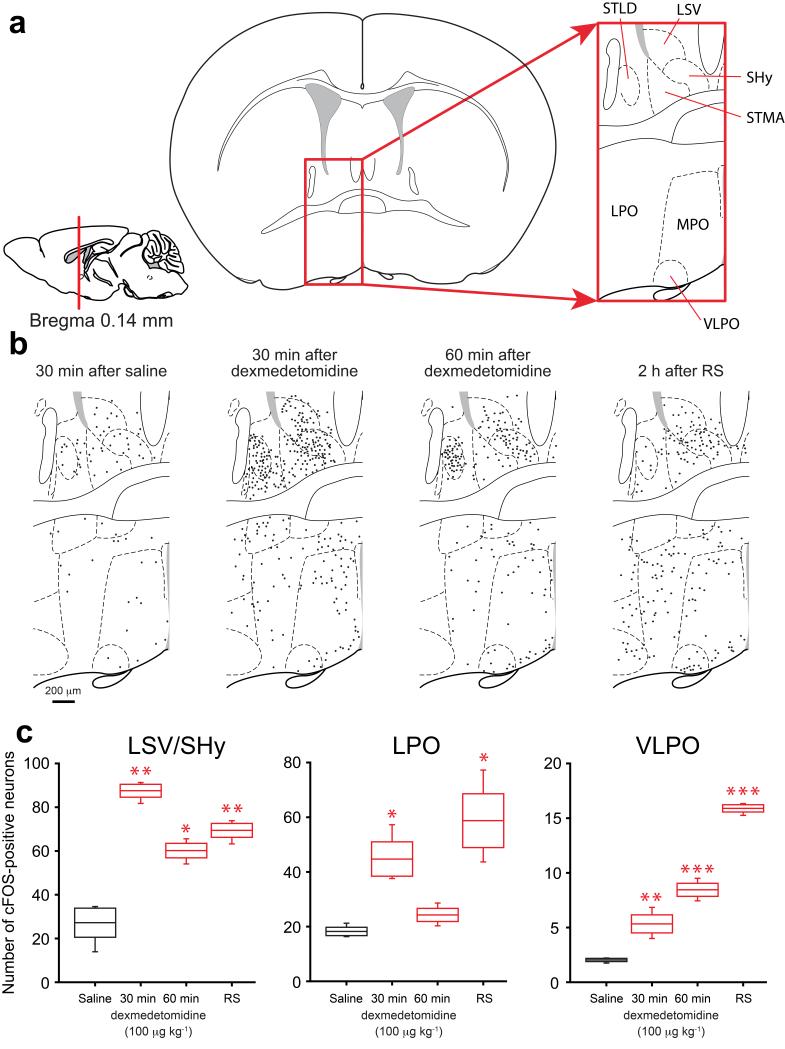
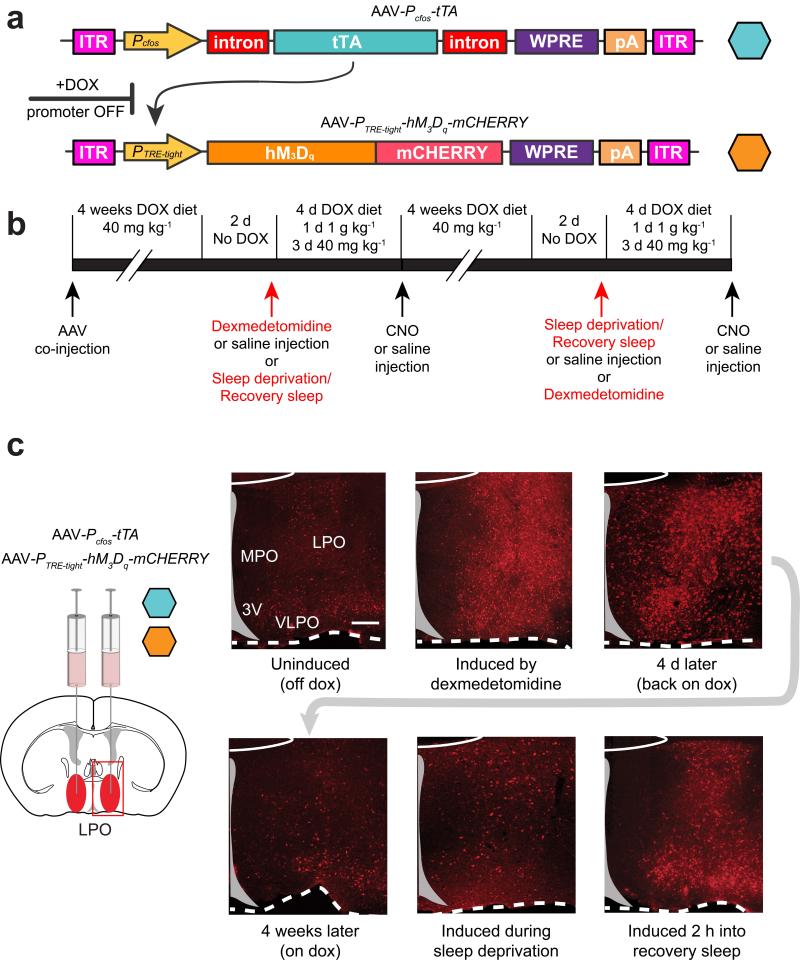
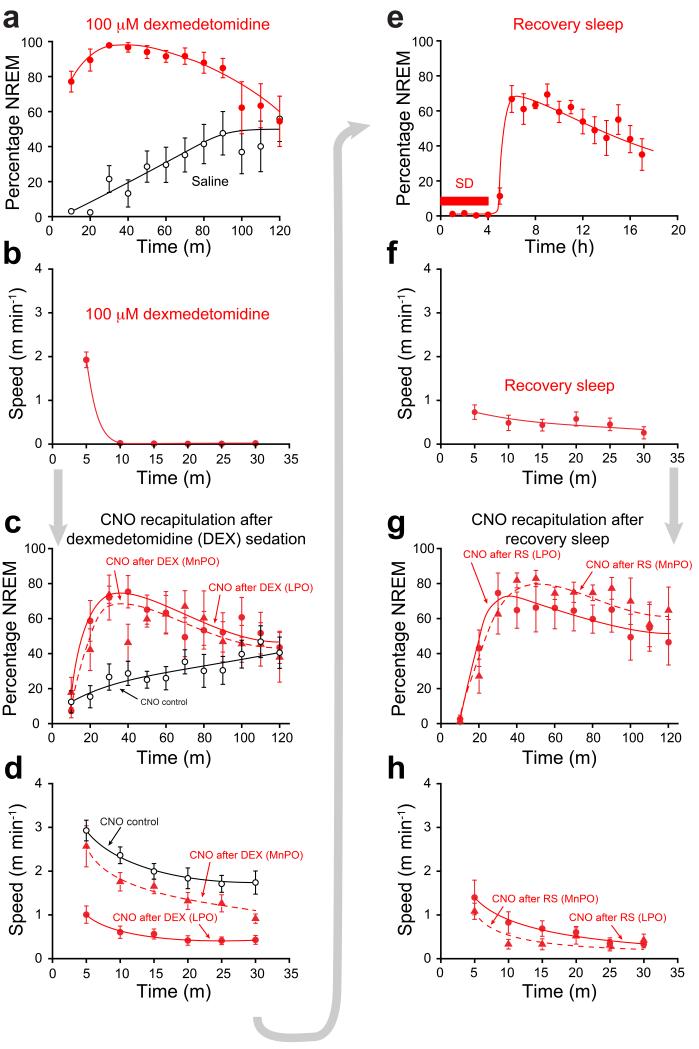
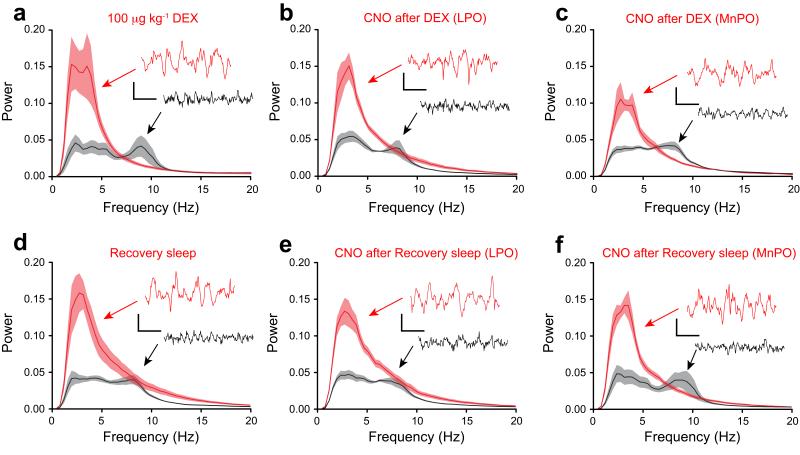
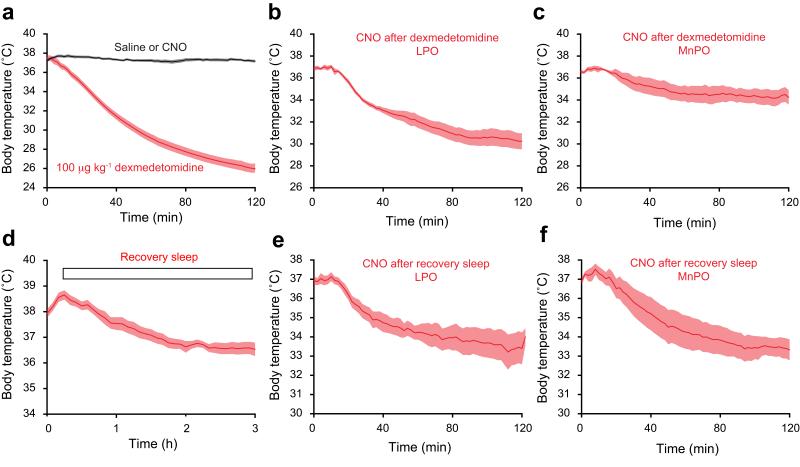
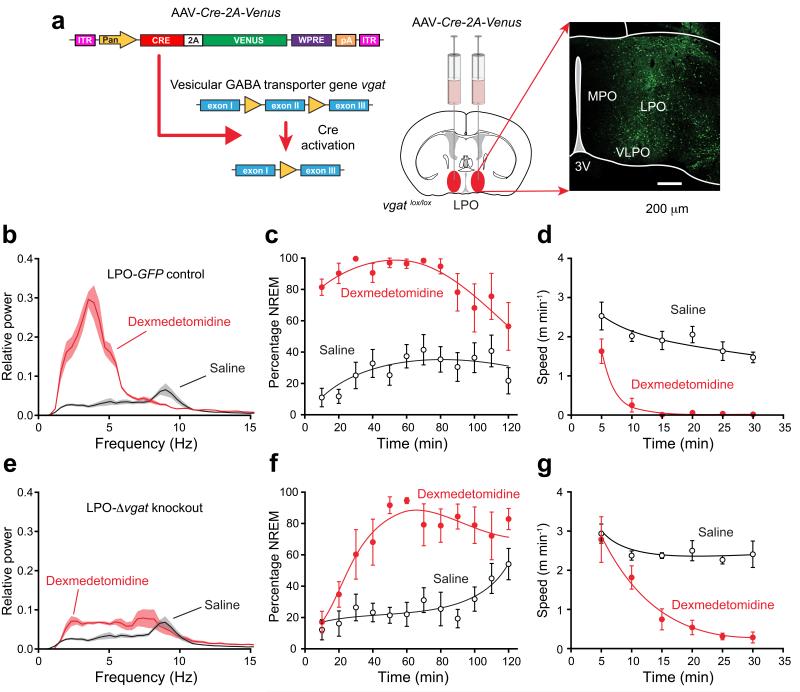
Do sedatives engage natural sleep pathways? It is usually assumed that anesthetic-induced sedation and loss of righting reflex (LORR) arise by influencing the same circuitry to lesser or greater extents. For the α2 adrenergic receptor agonist dexmedetomidine, we found that sedation and LORR were in fact distinct states, requiring different brain areas: the preoptic hypothalamic area and locus coeruleus (LC), respectively. Selective knockdown of α2A adrenergic receptors from the LC abolished dexmedetomidine-induced LORR, but not sedation. Instead, we found that dexmedetomidine-induced sedation resembled the deep recovery sleep that follows sleep deprivation. We used TetTag pharmacogenetics in mice to functionally mark neurons activated in the preoptic hypothalamus during dexmedetomidine-induced sedation or recovery sleep. The neuronal ensembles could then be selectively reactivated. In both cases, non-rapid eye movement sleep, with the accompanying drop in body temperature, was recapitulated. Thus, α2 adrenergic receptor-induced sedation and recovery sleep share hypothalamic circuitry sufficient for producing these behavioral states.


Figures

Figure 1
Figure 1
Knock down of adrenergic α2A receptors in the locus coeruleus blocks dexmedetomidine-induced LORR, but not sedation. (a) Testing shRNAs for knockdown efficacy of adra2a-IRES-gfp transgene expression in HEK-293 cells (n=8). The photographs show transfected HEK-293 cells; GFP fluorescence (green) was strongly reduced with the shadra2a1 construct but not with the scramble version. The dsRED expression reveals similar transfection efficiencies. CMV, cytomegalovirus promoter/enhancer region; IRES, internal ribosome entry site; pA, polyadenylation sequence; WPRE, woodchuck post-transcriptional regulatory element. (b) AAVs expressing either dsRED-mir30-shadra2a or dsRED-mir30-shscramble transgenes were bilaterally injected into the LC of adult mice. Photographs illustrate AAV transgene expression (dsRED) in the LC as confirmed by co-staining with tyrosine hydroxylase antisera (white). ITR, inverted terminal repeats; CBA, chicken-β-actin enhancer/promoter. (c) Whole-cell recordings of action potentials of LC neurons, in acute slices from LC-scramble, and LC-adra2a-KD mice. Applying dexmedetomidine to scramble-expressing neurons hyperpolarized the membrane potential and the neurons stopped firing; by contrast dexmedetomidine had no effect on the neurons from the LC-adra2a-KD mice (P=0.7; n=7 cells). (d) Fourier transform power spectra for LC-scramble (black), and LC-adra2a-KD (red) mice in the waking state (left; n=5) and in response to 50 μg kg−1 dexmedetomidine (middle; n=4) and 400 μg kg−1 dexmedetomidine (right; n=4). Lighter shaded envelopes indicate the s.e.m. (e) Movement of LC-scramble (black; n=4-6), and LC-adra2a-KD (red; n=4–7) mice in response to sedative doses of dexmedetomidine were not significantly different (two-way ANOVA, P=0.91).
Figure 2
Figure 2
Dexmedetomidine-induced sedation and recovery sleep induced cFOS expression in overlapping regions of the mouse hypothalamic preoptic area and septum. (a) Schematic of the relevant preoptic hypothalamic and septal areas: left-hand drawing, midline-sagittal section, red line marks position of the section; middle drawing, coronal section, boxed area, magnified on the right, shows the relevant anatomical sites. (b) Line drawings of cFOS protein expression in the boxed area at 30 minutes after saline injection and 30 or 60 minutes after dexmedetomidine (100 μg/kg) injections or 2 hours into recovery sleep after sleep deprivation; black dots represent cFOS-positive cells (see Supplementary Fig. 1 for representative photographs); relative to its expression after a saline injection, the endogenous cfos gene is induced widely in the area by sedative doses of dexmedetomidine or during recovery sleep. (c) Number of cFOS positive neurons in selected anatomical sites after saline (white) or dexmedetomidine (red) injections or recovery sleep (gray). The boxes represent the s.e.m, and the bars show the range of the data. Asterisks represent significance relative to saline *P<0.05, **P<0.01, ***P<0.001 (t-test). LPO, lateral preoptic area; LSV, lateral septum, ventral; MPO, medial preoptic area SHy, septo-hypothalamic nucleus; STLD, stria terminalis lateral dorsal; STMA, stria terminalis medial anterior; VLPO, ventral lateral preoptic area.
Figure 3
Figure 3
The TetTag-hM3Dq system to record and reactivate neuronal groups in the preoptic hypothalamus activated by a sedative dose of dexmedetomidine or during recovery sleep. (a) The AAV transgenes: the first contains the cfos promoter, which drives expression of tTA protein. In the presence of doxycycline (DOX), tTA cannot bind and activate its target promoter, PTRE-tight, located in the second AAV genome; when doxycycline is removed, tTA can activate hM3Dq-mCHERRY expression but only in neurons where tTA expression had been driven by the cfos promotor, reflecting neural activity. (b). The extended protocol and time-line for the experiments. (c) LPO-TetTag-hM3Dq mice. Time course of PTRE-tight-hM3Dq-mCHERRY transgene induction and decay. The photographs show coronal sections from one side of the brain stained for hM3Dq-mCHERRY expression (red), detected with mCHERRY antisera. The images were taken from animals killed at six time points: with doxycycline removed from the diet two days previously, just before dexmedetomidine-induced sedation; 2 hours after a sedative dose of dexmedetomidine; 4 days later on and back on doxycycline, 4 weeks after dexmedetomidine-induced sedation on a doxycycline diet; 4 hours after sleep deprivation; and 2 hours into recovery sleep following sleep deprivation. Induced hM3Dq-mCHERRY transgene expression was seen throughout the LPO area. Scale bar, 200 μm.
Figure 4
Figure 4
Serial re-activation of genetically tagged neuronal ensembles following dexmedetomidine-induced sedation and recovery sleep. (a) Percentage NREM sleep after dexmedetomidine. Both LPO-TetTag-hM3Dq (n=6) and MnPO-TetTag-hM3Dq (n=6) mice showed sustained NREM, significantly greater than control (P<0.0001). Data shown are for LPO-TetTag-hM3Dq mice. (b) Speed in an open field 30 min after dexmedetomidine. Data shown are for LPO-TetTag-hM3Dq mice (n=7). (c) NREM sleep after CNO injection, four days after dexmedetomidine sedation. Filled circles: LPO-TetTag-hM3Dq mice (n=7; P<0.0001, compared to control) after CNO injection. Filled triangles: MnPO-TetTag-hM3Dq (n=6; P<0.001, compared to control) mice after CNO injection. Open circles: LPO-TetTag-hM3Dq (n=9) mice after control CNO injection without prior sedation or recovery sleep. (d) Speed in an open field 30 min after CNO injection, four days after dexmedetomidine sedation. Filled circles: after CNO injection for LPO-TetTag-hM3Dq mice. Filled triangles: after CNO injection for MnPO-TetTag-hM3Dq mice. Open circles: after control CNO injection without prior sedation or recovery sleep. CNO recapitulated the effects of dexmedetomidine in LPO-TetTag-hM3Dq (n=8; P<0.0001) but not in MnPO-TetTag-hM3Dq mice (n=6; P=0.1) compared to control (n=7). (e) NREM after 4 hours sleep deprivation (SD) (n=6). (f) Speed in an open field 30 min during recovery sleep (n=8). (g) NREM sleep after CNO injection, four days after sleep deprivation/recovery sleep. Filled circles: LPO-TetTag-hM3Dq mice (n=8; P<0.0001, compared to baseline) after CNO injection. Filled triangles: MnPO-TetTag-hM3Dq (n=7; P<0.0001, two-way ANOVA compared to baseline) mice after CNO injection. (h) Speed in open field 30 min after CNO injection, four days after recovery sleep. CNO recapitulated the effects of recovery sleep in both LPO-TetTag-hM3Dq (n=8; P<0.0001) and in MnPO-TetTag-hM3Dq mice (n=7; P<0.0001, two-way ANOVA) compared to baseline (n=7). For all panels the error bars represent s.e.m and the statistical tests were two-way ANOVA.
Figure 5
Figure 5
EEG delta power is recapitulated by reactivation of genetically tagged neuronal ensembles in LPO-TetTag-hM3Dq and MnPO-TetTag-hM3Dq mice following dexmedetomidine-induced sedation or recovery sleep. Each panel shows Fourier Transform power spectra when the EEG and EMG signals were scored as either sleep (red) or wake (black). The envelopes represent the s.e.m. (a) Dexmedetomidine sedation (n=7). (b) CNO reactivation after dexmedetomidine sedation for LPO-TetTag-hM3Dq mice (n=8). (c) CNO reactivation after dexmedetomidine sedation for MnPO-TetTag-hM3Dq mice (n=6). (d) Recovery sleep (n=7). (e) CNO reactivation after recovery sleep for LPO-TetTag-hM3Dq mice (n=8). (f) CNO reactivation after recovery sleep for MnPO-TetTag-hM3Dq mice (n=7). Each spectrum is calculated by combining EEG segments totally 20 minutes. The inserts show representative EEG traces, and the accompanying calibration bars represent 100 μV and 500 msec.
Figure 6
Figure 6
Hypothermia is recapitulated by reactivation of genetically tagged neuronal ensembles in LPO-TetTag-hM3Dq and MnPO-TetTag-hM3Dq mice following recovery sleep, but only in LPO-TetTag-hM3Dq mice following dexmedetomidine-induced sedation. Each panel shows changes in body temperature following: (a) dexmedetomidine sedation (n=10) (red) or saline (n=20) or CNO (n=3) (black), (b) CNO reactivation after dexmedetomidine sedation for LPO-TetTag-hM3Dq mice (n=5), (c) CNO reactivation after dexmedetomidine sedation for MnPO-TetTag-hM3Dq mice (n=5), (d) recovery sleep (n=10), (e) CNO reactivation after recovery sleep for LPO-TetTag-hM3Dq mice (n=6), and (f) CNO reactivation after recovery sleep for MnPO-TetTag-hM3Dq mice (n=5). The data in panels a) and d) are for LPO-TetTag-hM3Dq and MnPO-TetTag-hM3Dq mice combined, because these were indistinguishable.
Figure 7
Figure 7
Selective knockout of the GABA vesicular transporter gene (vgat) in the PO hypothalamic area (LPO-Δvgat mice) slows the transition to dexmedetomidine-induced sleep. (a) Cre recombinase, produced from an AAV transgene, deletes exon 2 of the vgat gene following AAV-Cre-2A-Venus bilateral injection into the LPO area of vgatlox/lox mice. The image on the right shows the extent of AAV expression, as detected by staining with EGFP antisera. (b) EEG power spectra ten minutes after dexmedetomidine (100 μg kg−1 – red line) or saline (black) injection in control mice (n=8) expressing AAV-GFP in the LPO (LPO-GFP mice; n=6). Lighter shaded envelopes indicate the s.e.m. (c) Percentage of time scored as NREM sleep after dexmedetomidine (100 μg/kg; filled circles, n=6) was significantly greater (two-way ANOVA, P<0.0001) than in saline (open circles, n=8) in LPO-GFP control mice. (d) Speed in open field 30 min after dexmedetomidine (100 μg kg−1; filled circles, n=7) was significantly less (two-way ANOVA, P<0.0001) than in saline (open circles, n=6) in LPO-GFP control mice. (e) EEG power spectra ten minutes after dexmedetomidine (100 μg/kg – red line; n=6) or saline (black) injection in mice (n=8) expressing AAV-Cre-2A-Venus in the LPO (LPO-Δvgat mice). (f) Percentage of time scored as NREM sleep after dexmedetomidine (100 μg kg−1; filled circles, n=6) was significantly greater (two-way ANOVA, P<0.0001) than in saline (n=8) in AAV-Cre-2A-Venus mice. (g) Speed in open field 30 min after dexmedetomidine (100 μg kg−1; filled circles, n=6) was significantly less (two-way ANOVA, P<0.0001) than in saline (open circles, n=8) in LPO-Δvgat mice. For all panels the error bars represent s.e.m.

Similar articles

Cited by

References

    1. Franks NP. General anaesthesia: from molecular targets to neuronal pathways of sleep and arousal. Nature reviews. Neuroscience. 2008;9:370–386. - PubMed
    1. Rihel J, Schier AF. Sites of action of sleep and wake drugs: insights from model organisms. Current opinion in neurobiology. 2013;23:831–840. - PMC - PubMed
    1. Adams R, et al. Efficacy of dexmedetomidine compared with midazolam for sedation in adult intensive care patients: a systematic review. British journal of anaesthesia. 2013;111:703–710. - PubMed
    1. Bol C, Danhof M, Stanski DR, Mandema JW. Pharmacokinetic-pharmacodynamic characterization of the cardiovascular, hypnotic, EEG and ventilatory responses to dexmedetomidine in the rat. The Journal of pharmacology and experimental therapeutics. 1997;283:1051–1058. - PubMed
    1. Seidel WF, Maze M, Dement WC, Edgar DM. Alpha-2 adrenergic modulation of sleep: time-of-day-dependent pharmacodynamic profiles of dexmedetomidine and clonidine in the rat. The Journal of pharmacology and experimental therapeutics. 1995;275:263–273. - PubMed

Publication types

Substances