. 2015 May;275(2):490-500.
doi: 10.1148/radiol.15142849. Epub 2015 Feb 20.

(89)Zr-Oxine Complex PET Cell Imaging in Monitoring Cell-based Therapies

Affiliations

(89)Zr-Oxine Complex PET Cell Imaging in Monitoring Cell-based Therapies

Noriko Sato et al. Radiology. 2015 May.

Abstract

Purpose: To develop a clinically translatable method of cell labeling with zirconium 89 ((89)Zr) and oxine to track cells with positron emission tomography (PET) in mouse models of cell-based therapy.

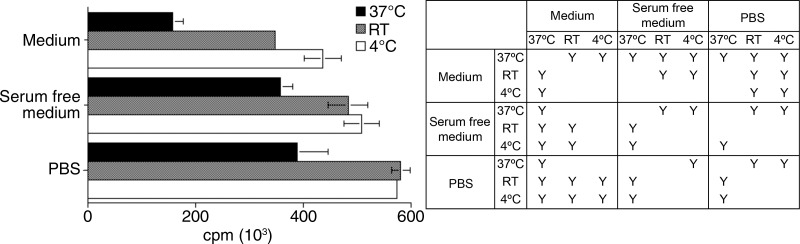
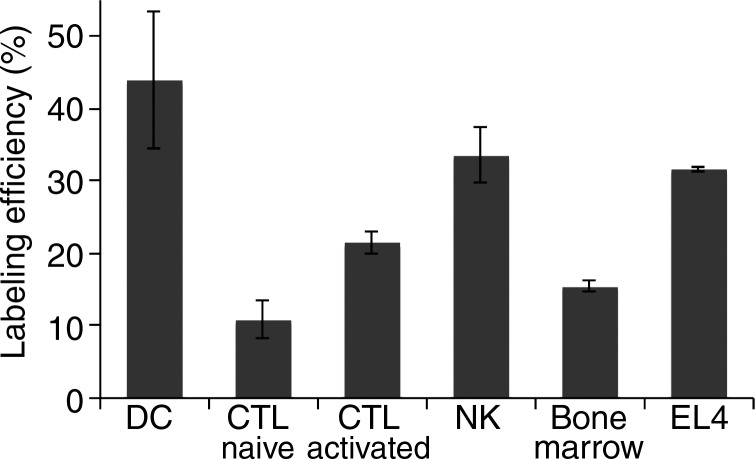
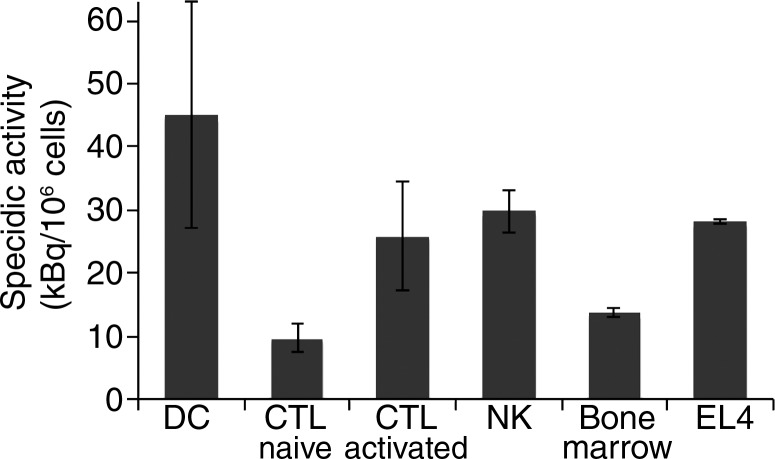
Materials and methods: This study was approved by the institutional animal care committee. (89)Zr-oxine complex was synthesized in an aqueous solution. Cell labeling conditions were optimized by using EL4 mouse lymphoma cells, and labeling efficiency was examined by using dendritic cells (DCs) (n = 4), naïve (n = 3) and activated (n = 3) cytotoxic T cells (CTLs), and natural killer (NK) (n = 4), bone marrow (n = 4), and EL4 (n = 4) cells. The effect of (89)Zr labeling on cell survival, proliferation, and function were evaluated by using DCs (n = 3) and CTLs (n = 3). Labeled DCs (444-555 kBq/[5 × 10(6)] cells, n = 5) and CTLs (185 kBq/[5 × 10(6)] cells, n = 3) transferred to mice were tracked with microPET/CT. In a melanoma immunotherapy model, tumor targeting and cytotoxic function of labeled CTLs were evaluated with imaging (248.5 kBq/[7.7 × 10(6)] cells, n = 4) and by measuring the tumor size (n = 6). Two-way analysis of variance was used to compare labeling conditions, the Wilcoxon test was used to assess cell survival and proliferation, and Holm-Sidak multiple tests were used to assess tumor growth and perform biodistribution analyses.

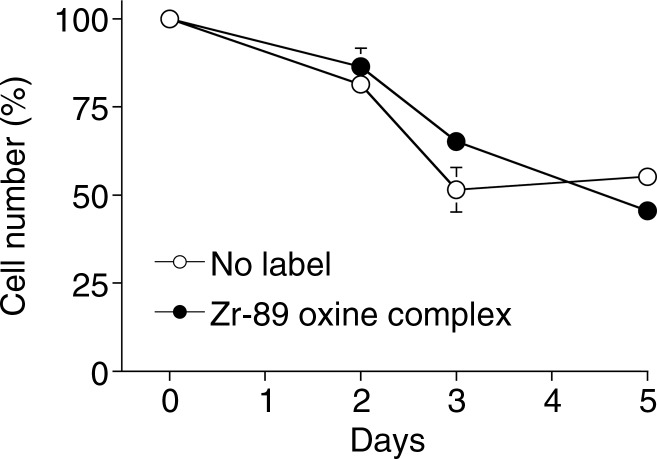
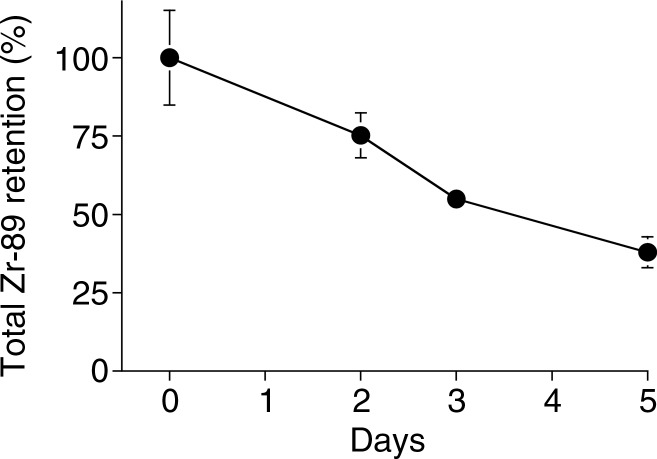
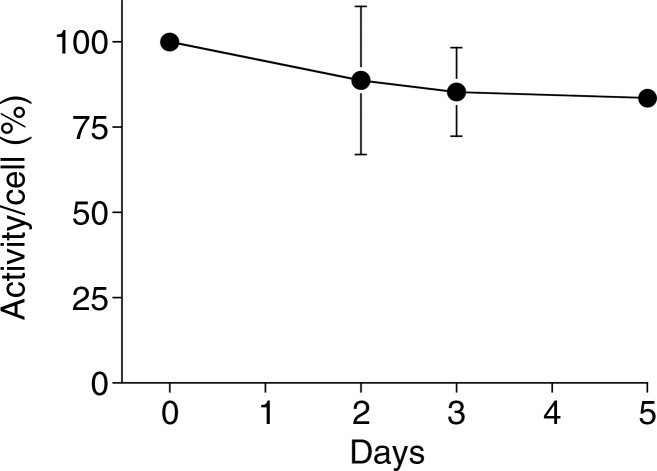
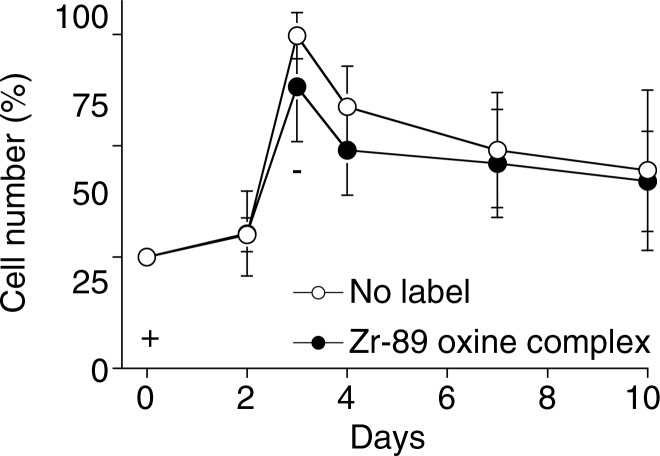
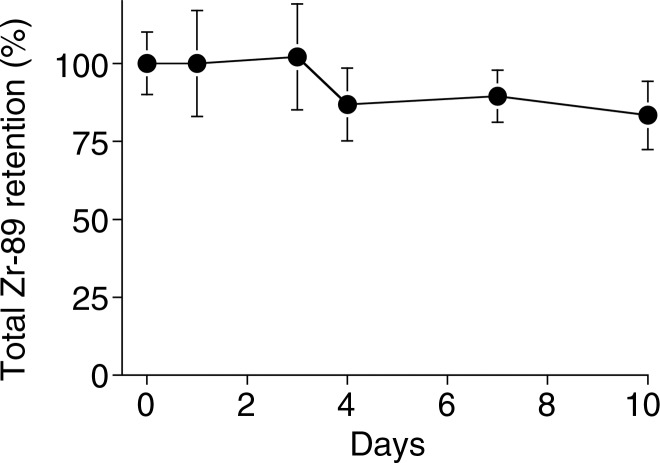
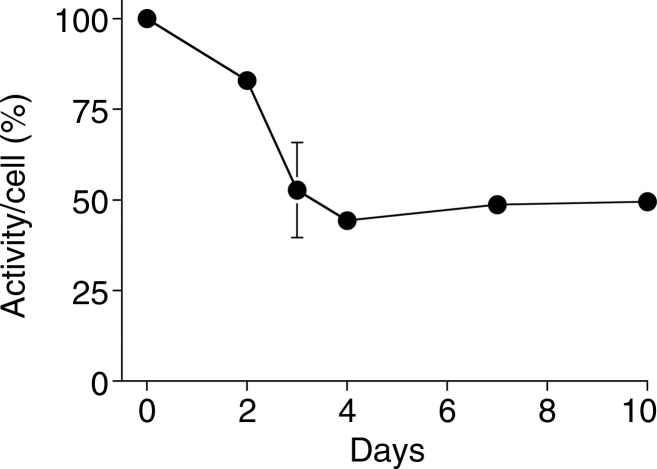
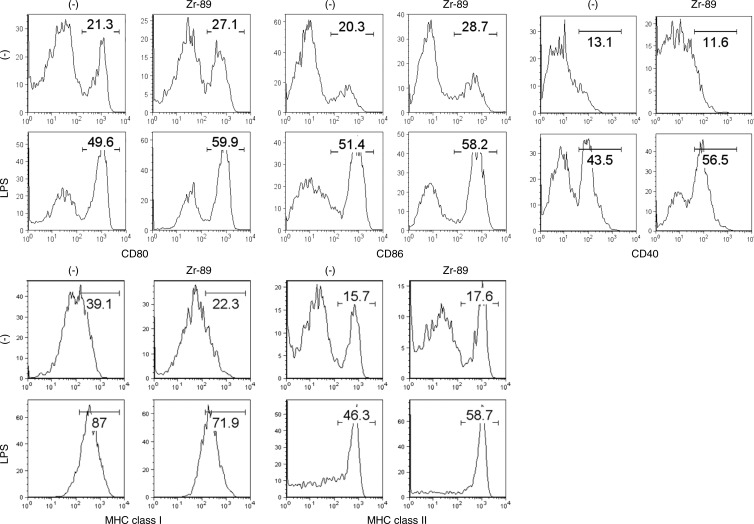
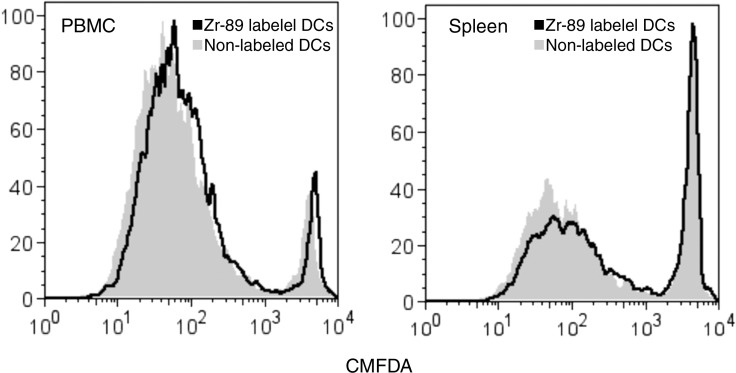
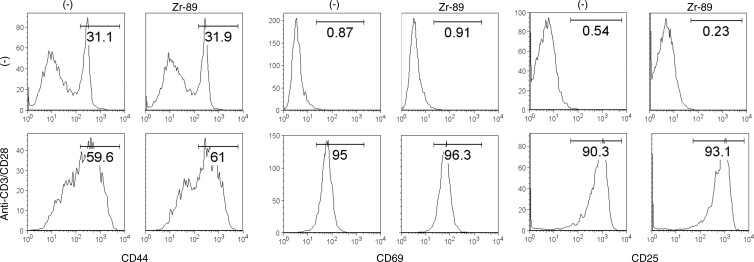
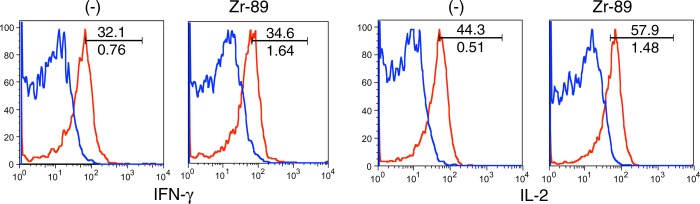
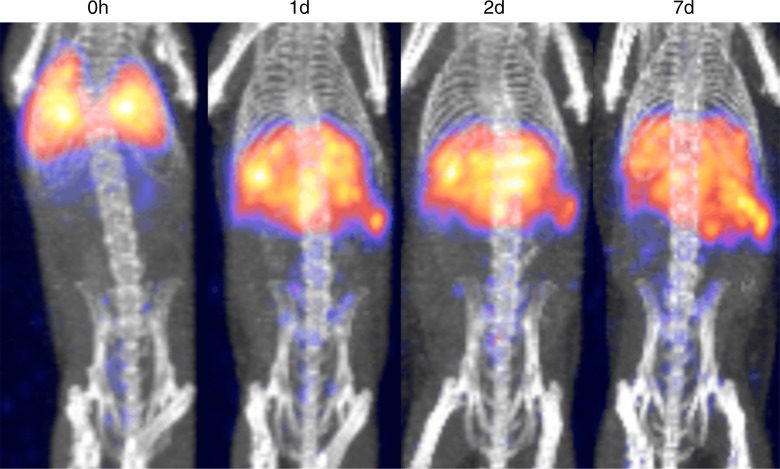
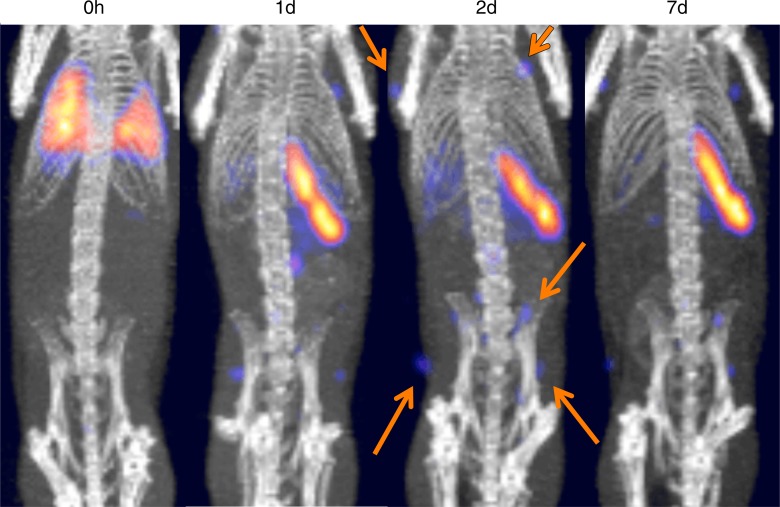
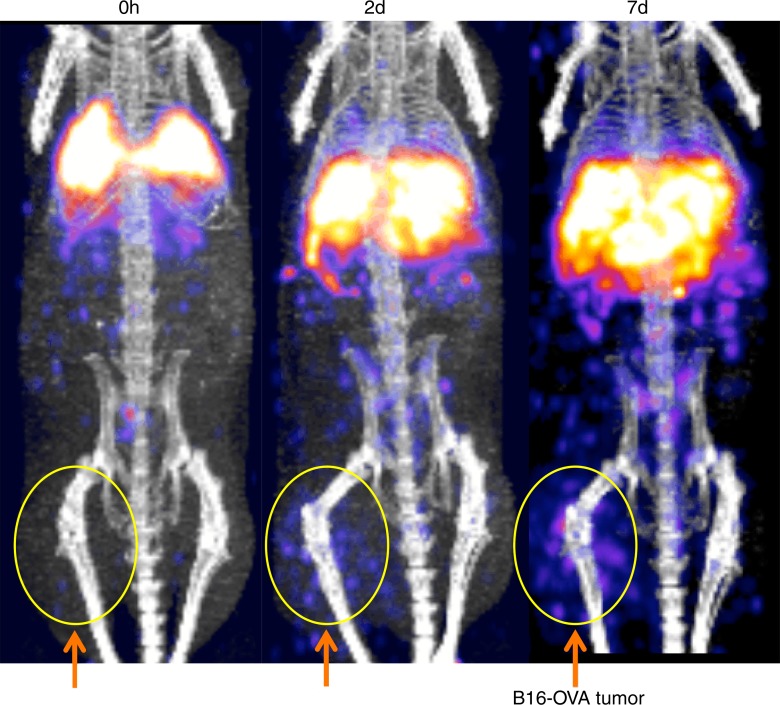
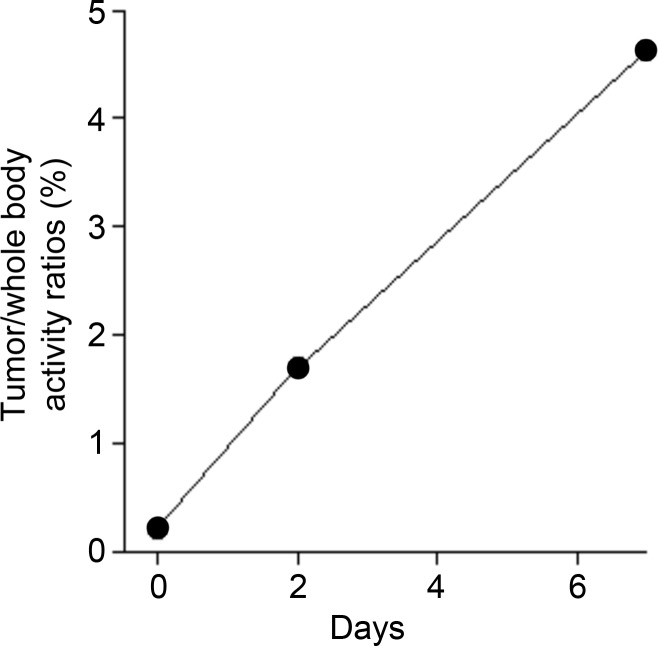
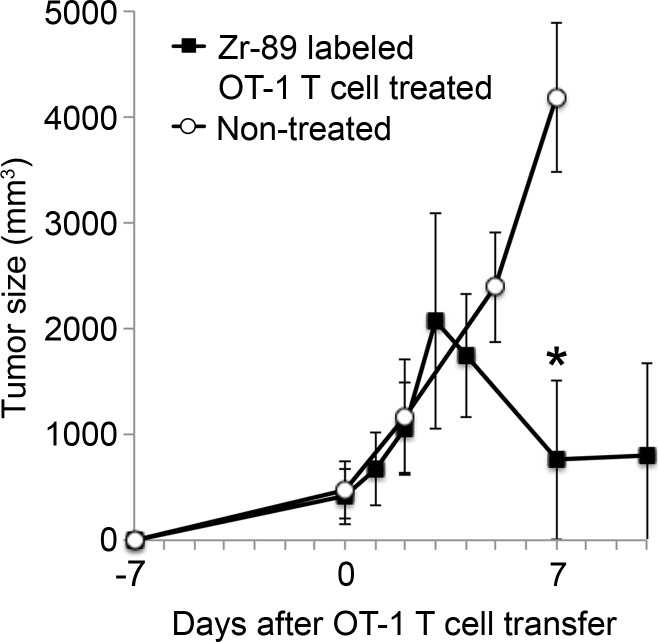
Results: (89)Zr-oxine complex was synthesized at a mean yield of 97.3% ± 2.8 (standard deviation). It readily labeled cells at room temperature or 4°C in phosphate-buffered saline (labeling efficiency range, 13.0%-43.9%) and was stably retained (83.5% ± 1.8 retention on day 5 in DCs). Labeling did not affect the viability of DCs and CTLs when compared with nonlabeled control mice (P > .05), nor did it affect functionality. (89)Zr-oxine complex enabled extended cell tracking for 7 days. Labeled tumor-specific CTLs accumulated in the tumor (4.6% on day 7) and induced tumor regression (P < .05 on day 7).

Conclusion: We have developed a (89)Zr-oxine complex cell tracking technique for use with PET that is applicable to a broad range of cell types and could be a valuable tool with which to evaluate various cell-based therapies.


Figures

Figure 1a:
Figure 1a:
Graphs show 89Zr-oxine labeling of various cell types did not require active cellular incorporation. (a) One million EL4 cells were incubated with the 89Zr-oxine complex at 1:50 volume ratios in phosphate-buffered saline (PBS), serum-free medium, or complete medium at 37°C, room temperature (RT ), or 4°C for 15 minutes. Radioactivity associated with the cells was determined (n = 3, representative of two independent experiments, Y indicates P < .05 at two-way analysis of variance). (b) Labeling efficiency and (c) specific activity of DCs, naïve and activated CTLs, and NK, bone marrow, and EL4 cells (DC and naïve and activated CTLs: n = 4; NK, bone marrow, and EL4 cells: n = 3). Error bars indicate standard deviation.
Figure 1b:
Figure 1b:
Graphs show 89Zr-oxine labeling of various cell types did not require active cellular incorporation. (a) One million EL4 cells were incubated with the 89Zr-oxine complex at 1:50 volume ratios in phosphate-buffered saline (PBS), serum-free medium, or complete medium at 37°C, room temperature (RT ), or 4°C for 15 minutes. Radioactivity associated with the cells was determined (n = 3, representative of two independent experiments, Y indicates P < .05 at two-way analysis of variance). (b) Labeling efficiency and (c) specific activity of DCs, naïve and activated CTLs, and NK, bone marrow, and EL4 cells (DC and naïve and activated CTLs: n = 4; NK, bone marrow, and EL4 cells: n = 3). Error bars indicate standard deviation.
Figure 1c:
Figure 1c:
Graphs show 89Zr-oxine labeling of various cell types did not require active cellular incorporation. (a) One million EL4 cells were incubated with the 89Zr-oxine complex at 1:50 volume ratios in phosphate-buffered saline (PBS), serum-free medium, or complete medium at 37°C, room temperature (RT ), or 4°C for 15 minutes. Radioactivity associated with the cells was determined (n = 3, representative of two independent experiments, Y indicates P < .05 at two-way analysis of variance). (b) Labeling efficiency and (c) specific activity of DCs, naïve and activated CTLs, and NK, bone marrow, and EL4 cells (DC and naïve and activated CTLs: n = 4; NK, bone marrow, and EL4 cells: n = 3). Error bars indicate standard deviation.
Figure 2a:
Figure 2a:
Graphs show 89Zr-oxine labeling did not interfere with survival of DCs. (a) DCs with and without 89Zr-oxine labeling showed similar viability (n = 3, representative of two independent experiments, two-sided global P = .75 at Wilcoxon test). (b) 89Zr-oxine complex associated with DCs was parallel to the number of surviving DCs. (c) The specific activity of DCs was maintained. Error bars indicate standard deviation.
Figure 2b:
Figure 2b:
Graphs show 89Zr-oxine labeling did not interfere with survival of DCs. (a) DCs with and without 89Zr-oxine labeling showed similar viability (n = 3, representative of two independent experiments, two-sided global P = .75 at Wilcoxon test). (b) 89Zr-oxine complex associated with DCs was parallel to the number of surviving DCs. (c) The specific activity of DCs was maintained. Error bars indicate standard deviation.
Figure 2c:
Figure 2c:
Graphs show 89Zr-oxine labeling did not interfere with survival of DCs. (a) DCs with and without 89Zr-oxine labeling showed similar viability (n = 3, representative of two independent experiments, two-sided global P = .75 at Wilcoxon test). (b) 89Zr-oxine complex associated with DCs was parallel to the number of surviving DCs. (c) The specific activity of DCs was maintained. Error bars indicate standard deviation.
Figure 3a:
Figure 3a:
Graphs show 89Zr-oxine labeling did not interfere with survival and proliferation of CTLs. (a) CTLs with and without 89Zr-oxine labeling underwent similar proliferation at TCR stimulation on day 0 (+) followed by a contraction phase after withdrawal of the stimulation on day 3 (-) (n = 3, representative of two independent experiments, two-sided global P = .125 at Wilcoxon test). (b) 89Zr-oxine complex was retained in CTLs during rapid proliferation. A decrease was observed when the cell number decreased in the contraction phase. (c) The specific activity of CTLs declined during the expansion phase but was maintained after the contraction phase. Error bars indicate standard deviations.
Figure 3b:
Figure 3b:
Graphs show 89Zr-oxine labeling did not interfere with survival and proliferation of CTLs. (a) CTLs with and without 89Zr-oxine labeling underwent similar proliferation at TCR stimulation on day 0 (+) followed by a contraction phase after withdrawal of the stimulation on day 3 (-) (n = 3, representative of two independent experiments, two-sided global P = .125 at Wilcoxon test). (b) 89Zr-oxine complex was retained in CTLs during rapid proliferation. A decrease was observed when the cell number decreased in the contraction phase. (c) The specific activity of CTLs declined during the expansion phase but was maintained after the contraction phase. Error bars indicate standard deviations.
Figure 3c:
Figure 3c:
Graphs show 89Zr-oxine labeling did not interfere with survival and proliferation of CTLs. (a) CTLs with and without 89Zr-oxine labeling underwent similar proliferation at TCR stimulation on day 0 (+) followed by a contraction phase after withdrawal of the stimulation on day 3 (-) (n = 3, representative of two independent experiments, two-sided global P = .125 at Wilcoxon test). (b) 89Zr-oxine complex was retained in CTLs during rapid proliferation. A decrease was observed when the cell number decreased in the contraction phase. (c) The specific activity of CTLs declined during the expansion phase but was maintained after the contraction phase. Error bars indicate standard deviations.
Figure 4a:
Figure 4a:
Flow cytometry data show 89Zr-oxine–labeled DCs maintained their functional activity. (a) 89Zr-oxine–labeled DCs showed upregulation of co-receptors and major histocompatibility complex (MHC) molecules comparable to nonlabeled cells (representative data of three experiments). (b) Graphs show in vivo transferred 89Zr-oxine–labeled OVA-loaded DCs were capable of inducing activation of pretransferred antigen-specific CMFDA-labeled OT-1 T cells (representative data of three experiments).
Figure 4b:
Figure 4b:
Flow cytometry data show 89Zr-oxine–labeled DCs maintained their functional activity. (a) 89Zr-oxine–labeled DCs showed upregulation of co-receptors and major histocompatibility complex (MHC) molecules comparable to nonlabeled cells (representative data of three experiments). (b) Graphs show in vivo transferred 89Zr-oxine–labeled OVA-loaded DCs were capable of inducing activation of pretransferred antigen-specific CMFDA-labeled OT-1 T cells (representative data of three experiments).
Figure 5a:
Figure 5a:
Flow cytometry data show 89Zr-oxine–labeled and nonlabeled CTLs were activated by TCR stimulation equally. (a) 89Zr-oxine–labeled and nonlabeled CTLs expressed CD44, CD69, and CD25 at similar levels at the resting state and upregulated these markers after TCR stimulation (representative data of three experiments). (b) 89Zr-oxine–labeled cells were capable of producing interferon-γ (FN-γ) and interleukin-2 (IL-2) at TCR activation (representative data of three experiments). Red line indicate TCR-stimulated cells. Blue line indicates unstimulated cells.
Figure 5b:
Figure 5b:
Flow cytometry data show 89Zr-oxine–labeled and nonlabeled CTLs were activated by TCR stimulation equally. (a) 89Zr-oxine–labeled and nonlabeled CTLs expressed CD44, CD69, and CD25 at similar levels at the resting state and upregulated these markers after TCR stimulation (representative data of three experiments). (b) 89Zr-oxine–labeled cells were capable of producing interferon-γ (FN-γ) and interleukin-2 (IL-2) at TCR activation (representative data of three experiments). Red line indicate TCR-stimulated cells. Blue line indicates unstimulated cells.
Figure 6a:
Figure 6a:
MicroPET/CT images show differential trafficking of DCs and naïve CTLs over 7 days in wild-type mice. (a) DCs migrated to the spleen and liver after transiting the lungs (representative images of five experiments). (b) Naïve CTLs mainly homed to the spleen and lymph nodes (representative images of three experiments). Arrows indicate examples of lymph node accumulation of CTLs.
Figure 6b:
Figure 6b:
MicroPET/CT images show differential trafficking of DCs and naïve CTLs over 7 days in wild-type mice. (a) DCs migrated to the spleen and liver after transiting the lungs (representative images of five experiments). (b) Naïve CTLs mainly homed to the spleen and lymph nodes (representative images of three experiments). Arrows indicate examples of lymph node accumulation of CTLs.
Figure 7a:
Figure 7a:
89Zr-oxine–labeled OT-1 CTLs migrated to B16-OVA tumor. (a) MicroPET/CT images of 89Zr-oxine–labeled OT-1 CTLs in RAG1 knockout mice bearing B16-OVA melanoma tumor revealed migration of a small fraction of CTLs to the tumor (arrows) (representative images of six experiments). (b) Graph shows activity accumulated in the tumor quantified in a increased over time. (c) B16-OVA tumors regressed after the transfer of 89Zr-oxine–labeled activated OT-1 CTLs, indicating that the labeled OT-1 CTLs maintained their cytotoxic function (n = 6). Untreated mice were sacrificed on day 7, as the tumor diameter reached 20 mm (n = 5). * P = 2.84 × 10⁻⁵ on day 7 according to Holm-Sidak multiple tests that included three tests corresponding to days 2, 5, and 7. Error bars indicate standard deviations.
Figure 7b:
Figure 7b:
89Zr-oxine–labeled OT-1 CTLs migrated to B16-OVA tumor. (a) MicroPET/CT images of 89Zr-oxine–labeled OT-1 CTLs in RAG1 knockout mice bearing B16-OVA melanoma tumor revealed migration of a small fraction of CTLs to the tumor (arrows) (representative images of six experiments). (b) Graph shows activity accumulated in the tumor quantified in a increased over time. (c) B16-OVA tumors regressed after the transfer of 89Zr-oxine–labeled activated OT-1 CTLs, indicating that the labeled OT-1 CTLs maintained their cytotoxic function (n = 6). Untreated mice were sacrificed on day 7, as the tumor diameter reached 20 mm (n = 5). * P = 2.84 × 10⁻⁵ on day 7 according to Holm-Sidak multiple tests that included three tests corresponding to days 2, 5, and 7. Error bars indicate standard deviations.
Figure 7c:
Figure 7c:
89Zr-oxine–labeled OT-1 CTLs migrated to B16-OVA tumor. (a) MicroPET/CT images of 89Zr-oxine–labeled OT-1 CTLs in RAG1 knockout mice bearing B16-OVA melanoma tumor revealed migration of a small fraction of CTLs to the tumor (arrows) (representative images of six experiments). (b) Graph shows activity accumulated in the tumor quantified in a increased over time. (c) B16-OVA tumors regressed after the transfer of 89Zr-oxine–labeled activated OT-1 CTLs, indicating that the labeled OT-1 CTLs maintained their cytotoxic function (n = 6). Untreated mice were sacrificed on day 7, as the tumor diameter reached 20 mm (n = 5). * P = 2.84 × 10⁻⁵ on day 7 according to Holm-Sidak multiple tests that included three tests corresponding to days 2, 5, and 7. Error bars indicate standard deviations.

Similar articles

Cited by

References

    1. Palucka K, Banchereau J. Cancer immunotherapy via dendritic cells. Nat Rev Cancer 2012;12(4):265–277. - PMC - PubMed
    1. O’Neill DW, Adams S, Bhardwaj N. Manipulating dendritic cell biology for the active immunotherapy of cancer. Blood 2004;104(8):2235–2246. - PubMed
    1. Kater AP, van Oers MH, Kipps TJ. Cellular immune therapy for chronic lymphocytic leukemia. Blood 2007;110(8):2811–2818. - PubMed
    1. Körbling M, Freireich EJ. Twenty-five years of peripheral blood stem cell transplantation. Blood 2011;117(24):6411–6416. - PubMed
    1. Grupp SA, Kalos M, Barrett D, et al. . Chimeric antigen receptor-modified T cells for acute lymphoid leukemia. N Engl J Med 2013;368(16):1509–1518. - PMC - PubMed

Publication types