. 2015 Feb 23;10(2):e0118188.
doi: 10.1371/journal.pone.0118188. eCollection 2015.

Kuwanon V inhibits proliferation, promotes cell survival and increases neurogenesis of neural stem cells

Affiliations

Kuwanon V inhibits proliferation, promotes cell survival and increases neurogenesis of neural stem cells

Sun-Young Kong et al. PLoS One. .

Abstract

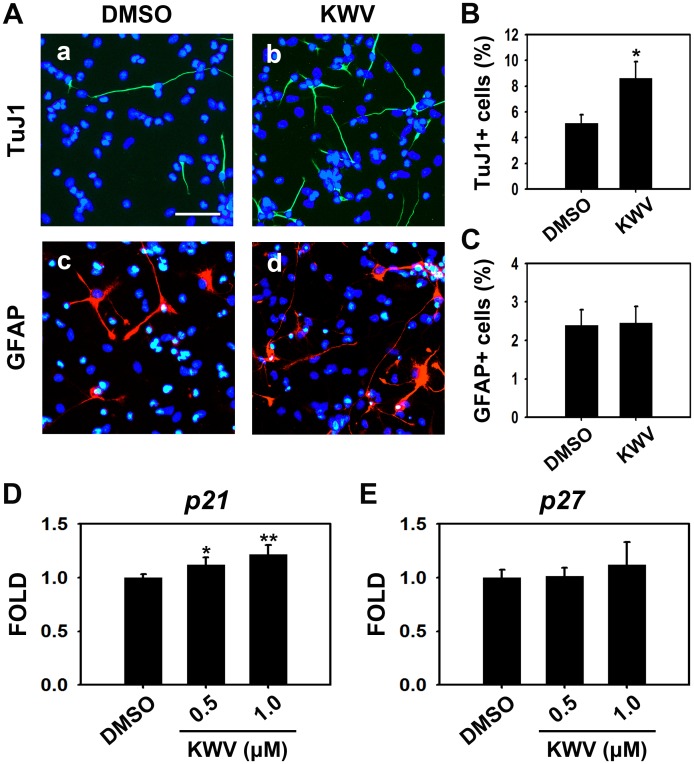
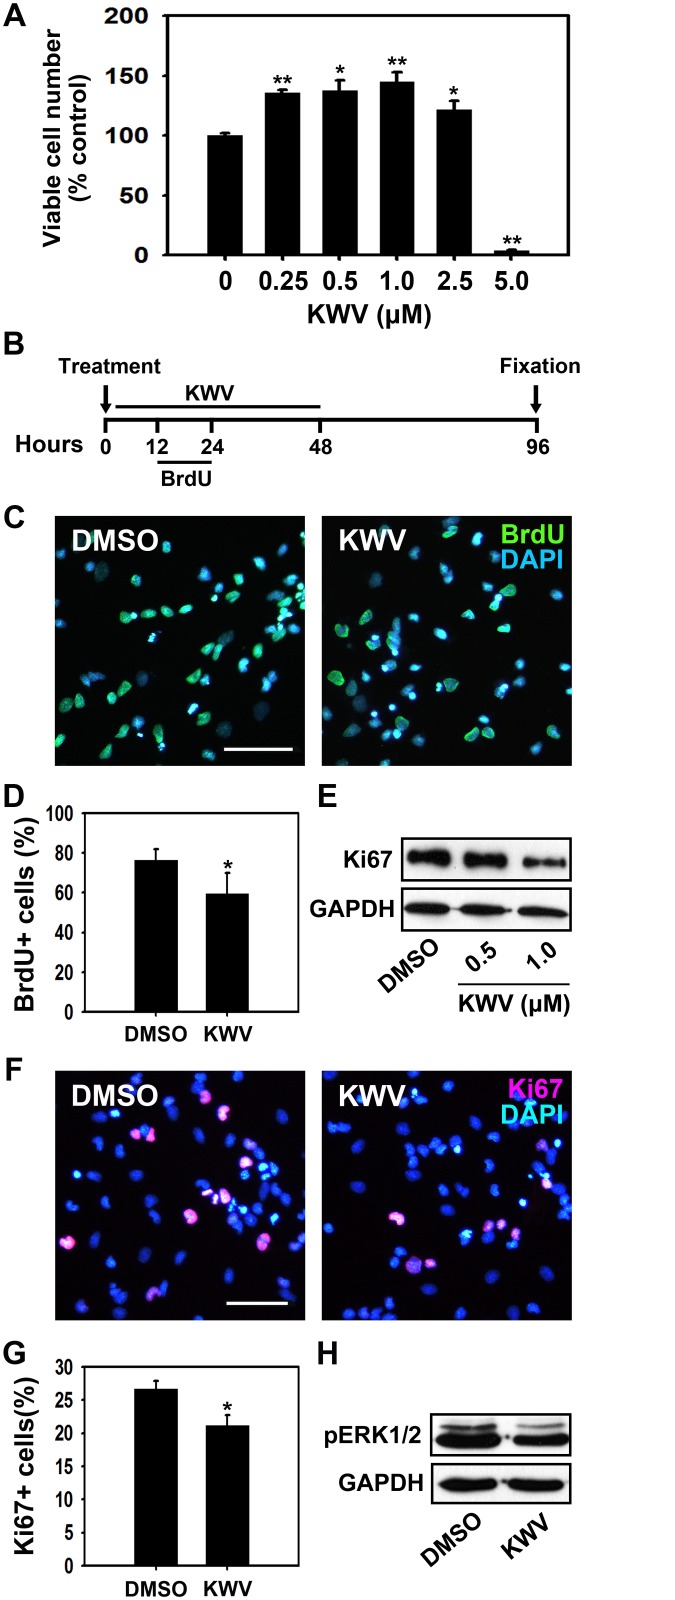
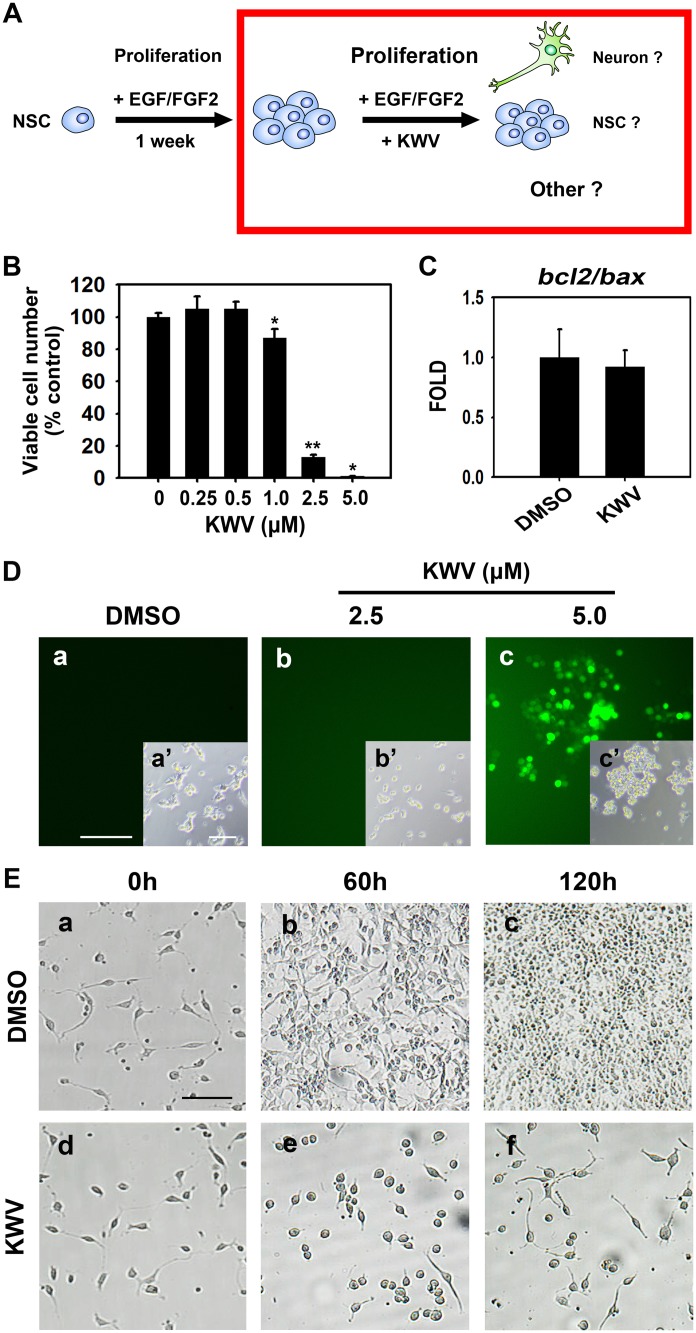
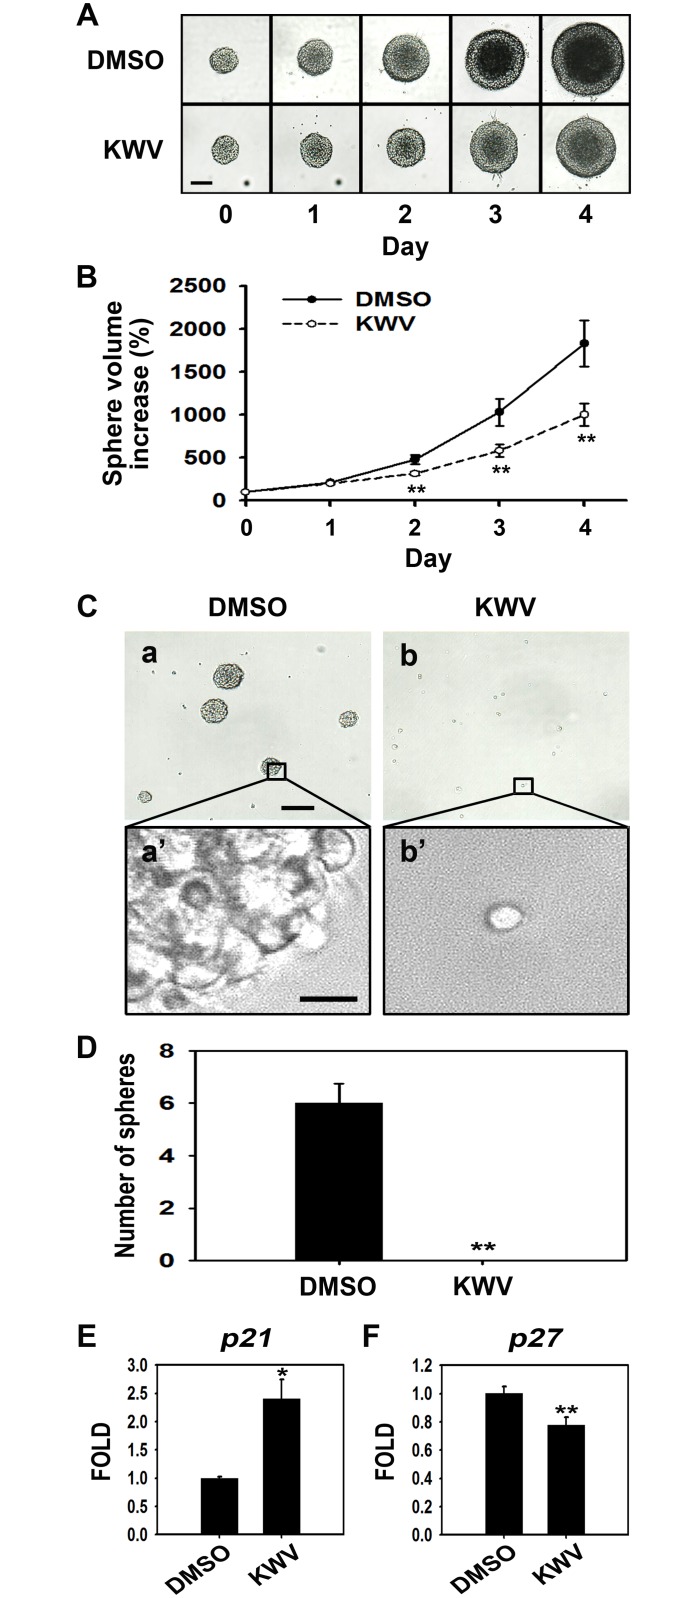
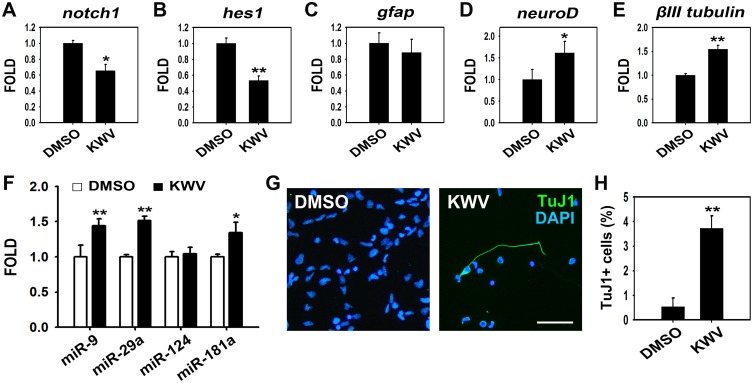
Neural stem cells (NSCs) have the ability to proliferate and differentiate into neurons and glia. Regulation of NSC fate by small molecules is important for the generation of a certain type of cell. The identification of small molecules that can induce new neurons from NSCs could facilitate regenerative medicine and drug development for neurodegenerative diseases. In this study, we screened natural compounds to identify molecules that are effective on NSC cell fate determination. We found that Kuwanon V (KWV), which was isolated from the mulberry tree (Morus bombycis) root, increased neurogenesis in rat NSCs. In addition, during NSC differentiation, KWV increased cell survival and inhibited cell proliferation as shown by 5-bromo-2-deoxyuridine pulse experiments, Ki67 immunostaining and neurosphere forming assays. Interestingly, KWV enhanced neuronal differentiation and decreased NSC proliferation even in the presence of mitogens such as epidermal growth factor and fibroblast growth factor 2. KWV treatment of NSCs reduced the phosphorylation of extracellular signal-regulated kinase 1/2, increased mRNA expression levels of the cyclin-dependent kinase inhibitor p21, down-regulated Notch/Hairy expression levels and up-regulated microRNA miR-9, miR-29a and miR-181a. Taken together, our data suggest that KWV modulates NSC fate to induce neurogenesis, and it may be considered as a new drug candidate that can regenerate or protect neurons in neurodegenerative diseases.


Conflict of interest statement

Competing Interests: The authors have declared that no competing interests exist.

Figures

Fig 1
Fig 1. KWV increases neurogenesis during NSC differentiation.
(A) Experimental scheme. NSCs were expanded as neurospheres in the presence of EGF and FGF2 for one week. To explore the roles of KWV during NSC differentiation, neurospheres were dissociated and plated as single cells and treated with vehicle (0.1% DMSO) or KWV and differentiated in the absence of growth factors. (B) The chemical structure of KWV. (C) A photo of air-dried stem barks of M. bombycis. (D) Bar graph shows the relative mRNA expression values of βIII tubulin. Total RNA was isolated from the cells treated with DMSO or KWV (0.5 or 1.0 μM) for 2 days of differentiation. cDNA was synthesized and subjected to real-time PCR using specific primers for βIII tubulin. Gapdh was used as an internal control. The data were expressed as mean ± SD (n = 3). (E) The representative band image for the protein levels of βIII Tubulin. Two days after treatment, total cell lysates from differentiated NSCs were subjected to western blot analysis with TuJ1 antibody. (F) Representative immunofluorescence images of NSCs differentiated for 4 days in the presence of DMSO or KWV (0.1–5.0 μM). Cells were immunostained with TuJ1 antibody and nuclei were identified by DAPI staining [TuJ1-positive neurons (green), nuclei (blue)]. Scale bar, 50 μm. (G) Quantification of neurons. TuJ1-positive cells were counted and normalized to total DAPI-positive cell numbers. KWV-treated NSC numbers were divided by DMSO-treated NSC numbers to yield fold changes. Values were presented as mean ± SEM (n = 3). Statistical analysis of all data was performed using the Student’s t-test (*P < 0.05 and **P < 0.01 vs. control).
Fig 2
Fig 2. KWV enhances neurogenesis but not astrocytogenesis during NSC differentiation.
(A) Representative immunofluorescence images of NSCs differentiated for 4 days in the presence of DMSO or 0.5 μM KWV [TuJ1-positive neurons (a and b, green), GFAP-positive astrocytes (c and d, red), nuclei (blue)]. Scale bar, 50 μm. (B, C) Quantification of neurons or astrocytes. TuJ1 positive or GFAP expressing cells were counted and normalized to total cell number. All cell count data were expressed as mean ± SD (n = 3). Bar graphs show the relative mRNA expression levels of p21 (D) and p27 (E). Gapdh was used as an internal control. Values were mean ± SD (n = 4). Statistical analysis of all data was performed using the Student’s t-test (*P < 0.05 and **P < 0.01 vs. control).
Fig 3
Fig 3. KWV promotes cell survival rather than proliferation during NSC differentiation.
(A) Cell viability was assessed using the MTT assay after 2 days of NSC differentiation in the presence of DMSO or various concentrations of KWV (0.25–5.0 μM). The values were presented as mean ± SD (n = 3). (B) NSCs were treated with DMSO or KWV (0.5 μM) for 2 days and BrdU (10.0 μM) was added to the media between 12–24 h during the differentiation. After an additional 2 days of differentiation, cells were fixed and immunostained with anti-BrdU antibody. (C) Representative immunofluorescence images of BrdU-positive cells (green) and nuclei (blue). Scale bar, 50 μm. (D) Quantification of BrdU-positive cells. BrdU-positive cells were counted and normalized to total cell number. Cell count data were expressed as mean ± SD (n = 3). (E) Western blot analysis of Ki67 in NSCs treated with DMSO or KWV (0.5 or 1.0 μM) for 8 h of differentiation. (F) Representative immunofluorescence images of Ki67-positive cells (red) and nuclei (blue). NSCs differentiated for 2 days in the presence of DMSO or 0.5 μM KWV were immunostained with anti-Ki67 antibody. Scale bar, 50 μm. (G) Quantification of Ki67-positive cells. Ki67-positive cells were counted and normalized to total cell number. Data were presented as mean ± SD (n = 3). (H) Western blot analysis of phosphorylated ERK1/2 in NSCs treated with DMSO or 0.5 μM KWV for 4 h of differentiation. Statistical analysis of all data was performed using the Student’s t-test (*P < 0.05 and **P < 0.01 vs. control).
Fig 4
Fig 4. KWV reduces cell number during NSC proliferation.
(A) After 1 week of expansion, NSCs were dissociated, plated and treated with DMSO or KWV in the presence of EGF and FGF2 to determine the effects of KWV during NSC proliferation. (B) Cell viability was assessed using the MTT assay after 2 days of DMSO or KWV (0.25–5.0 μM) treatment in the presence of growth factors. Values were mean ± SD (n = 3). (C) The mRNA ratio of bcl2 to bax in proliferating NSCs treated with DMSO or 2.5 μM KWV for 2 days. Gapdh was used as an internal control. The data were expressed as mean ± SD (n = 4). (D) Representative fluorescence images (a-c) of DCF-DA added proliferating NSCs in the presence of DMSO or KWV (2.5 or 5.0 μM). Insets are phase contrast images (a’-c’). (E) Representative digital images of NSCs treated with DMSO or 2.5 μM KWV in the presence of EGF and FGF2 at 0, 60, and 120 h. The scale bars represent 50 μm in (D) and (E). Statistical analysis of all data was performed using the Student’s t-test (*P < 0.05 and **P < 0.01 vs. control).
Fig 5
Fig 5. KWV inhibits NSC proliferation in the presence of EGF and FGF2.
(A) Digital images of neurospheres treated with either DMSO or 2.5 μM of KWV for 5 days in the presence of EGF and FGF2. Scale bar, 100 μm. (B) The volume of neurospheres was calculated by measuring the diameter of individual neurospheres treated with DMSO (black circle) or KWV (2.5 μM, white circle). Values were presented as mean ± SD (n = 4, for each treatment). (C) Neurosphere formation assay. Primary NSCs were dissociated and plated as single cells at clonal density (10 cells/μL). The NSCs were grown for 7 days in the presence of mitogens added with DMSO or 2.5 μM KWV. The boxed areas in (a) and (b) are magnified in (a’) and (b’), respectively. The scale bars represent 100 μm in (a) and (b) and 10 μm in (a’) and (b’). (D) Bar graph depicts the number of neurospheres counted from 6 independent randomly chosen fields. Cell count data were expressed as mean ± SD (n = 6, for each treatment). Bar graphs show the relative mRNA expression levels of p21 (E) and p27 (F) in NSCs treated with DMSO or 2.5 μM KWV for 2 days in the presence of growth factors. Gapdh was used as an internal control. The values were mean ± SEM (n = 3). Statistical analysis of all data was performed using the Student’s t-test (*P < 0.05 and **P < 0.01 vs. control).
Fig 6
Fig 6. KWV induces neuronal differentiation in the presence of EGF and FGF2.
After expansion for 1 week in the presence of EGF and FGF2, NSCs were dissociated and plated. Then cells were treated with either DMSO or KWV (2.5 μM) in the presence of growth factors for 2 days and the mRNA expression levels of notch1 (A) and hes1 (B) were shown by RT PCR followed by real-time PCR. Gapdh was used as an internal control. Data were presented as mean ± SEM (n = 3). The gfap (C), neuroD (D), and βIII tubulin (E) mRNA expression levels of NSCs treated with DMSO or 2.5 μM KWV for 24 h in the presence of mitogens. Values were expressed as mean ± SD (C and D; n = 4) or mean ± SEM (E; n = 3). (F) The expression of miR-9, miR-29a, miR-124, and miR-181a in cells treated with DMSO (white bar) or 2.5 μM KWV (black bar) for 24 h in the presence of growth factors. RNU6 was used as a loading control. The values were mean ± SD (n = 4). (G) Representative immunofluorescence images of cells treated with DMSO or 2.5 μM KWV for 43 h in the presence of EGF and FGF2. Cells were immunostained with TuJ1 antibody and nuclei were identified by DAPI staining [TuJ1-positive neurons (green), nuclei (blue)]. Scale bar, 50 μm. (H) Quantification of neurons. TuJ1-positive cells were counted and normalized to total cell number. Cell count data were presented as mean ± SD (n = 3). Statistical analysis of all data was performed using the Student’s t-test (*P < 0.05 and **P < 0.01 vs. control).

Similar articles

Cited by

References

    1. Gage FH (2000) Mammalian neural stem cells. Science 287: 1433–1438. - PubMed
    1. McKay R (1997) Stem cells in the central nervous system. Science 276: 66–71. - PubMed
    1. Wright LS, Prowse KR, Wallace K, Linskens MH, Svendsen CN (2006) Human progenitor cells isolated from the developing cortex undergo decreased neurogenesis and eventual senescence following expansion in vitro. Exp Cell Res 312: 2107–2120. - PubMed
    1. Rosser AE, Tyers P, ter Borg M, Dunnett SB, Svendsen CN (1997) Co-expression of MAP-2 and GFAP in cells developing from rat EGF responsive precursor cells. Brain Res Dev Brain Res 98: 291–295. - PubMed
    1. Longo FM, Yang T, Xie Y, Massa SM (2006) Small molecule approaches for promoting neurogenesis. Curr Alzheimer Res 3: 5–10. - PubMed

Publication types

MeSH terms

LinkOut - more resources