. 2015 Apr;16(4):406-14.
doi: 10.1038/ni.3108. Epub 2015 Feb 23.

Proinflammatory microenvironments within the intestine regulate the differentiation of tissue-resident CD8⁺ T cells responding to infection

Affiliations

Proinflammatory microenvironments within the intestine regulate the differentiation of tissue-resident CD8⁺ T cells responding to infection

Tessa Bergsbaken et al. Nat Immunol. 2015 Apr.

Abstract

We report that oral infection with Yersinia pseudotuberculosis results in the development of two distinct populations of pathogen-specific CD8(+) tissue-resident memory T cells (TRM cells) in the lamina propria. CD103(-) T cells did not require transforming growth factor-β (TGF-β) signaling but were true resident memory cells. Unlike CD103(+)CD8(+) T cells, which were TGF-β dependent and were scattered in the tissue, CD103(-)CD8(+) T cells clustered with CD4(+) T cells and CX3CR1(+) macrophages and/or dendritic cells around areas of bacterial infection. CXCR3-dependent recruitment of cells to inflamed areas was critical for development of the CD103(-) population and pathogen clearance. Our studies have identified the 'preferential' development of CD103(-) TRM cells in inflammatory microenvironments within the lamina propria and suggest that this subset has a critical role in controlling infection.


Figures

Figure 1
Figure 1
Oral Yptb-OVA infection generates a robust intestinal CD8 T cell response. C57BL/6 mice received 1×10⁴ GFP OT-I T cells and one day later were infected with 2×10⁸ Yptb-OVA. (a) Frequency of OT-I cells and YopE69-77-tetramer+ CD8 T cells in the intestinal epithelium (IEL), lamina propria (LP), mesenteric lymph node (MLN) and spleen (SP) at 9 and 45 days after infection. Representative of 3 independent experiments. (b) Quantification of the total number of cells in the same tissues as in (a) at various timepoints post-infection. Data are means and SDs pooled from 2 experiments, with at least 3 mice/timepoint.
Figure 2
Figure 2
CD103 CD8 populations develop in the LP and have features of resident memory cells. 1×10⁴ congenically marked OT-I cells were transferred into C57BL/6 mice and one day later mice were infected with Yptb-OVA. (a) CD103 expression on OT-I T cells in the IEL and LP compartments at the indicated timepoints post infection. Data are means and SDs pooled from 3 or more mice from at least 2 independent experiments. Expression of CD103 and CD69 (b) or Bcl-2 (c) by OT-I T cells. Representative plots from 14 days (b) and 28 days (c) post infection. Representative of at least 2 experiments with 3 or more mice per group (a-c). (d) The indicated CD8 populations were sorted from Yptb-OVA infected mice at greater than 28 days post infection. RNA was isolated and Klf2 expression was determined using qRT-PCR and levels were normalized to Actb expression. Data are pooled from 2 independent biological replicates. *p<0.01, **p<0.001 when compared to splenic CD8 cells (paired t-test). (e) At 28 days post infection, mice were treated intraperitoneally with 150 μg of anti-CD8α depleting antibody. Seven days after treatment, CD103 expression was determined for LP OT-I T cells. Data are means and SDs pooled from 3 or more mice from at least 2 independent experiments.
Figure 3
Figure 3
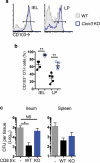
TGF-β signaling is not required for development of the CD103 CD8 LP TRM cell population. 5×10³ each CD45.1 WT (Tgfbr2fl/fl) and CD45.1/2 Tgfbr2 KO (Tgfbr2fl/fl x dLck-Cre) OT-I cells were transferred into C57BL/6 mice and one day later mice were infected with Yptb-OVA. OT-I cells were analyzed on the indicated days post infection. (a) Ratio of WT to Tgfbr2 KO OT-I cells in various tissues at the indicated days post infection. Data points represent individual mice. (b-c) CD103 and CD69 expression on OT-I cells from the LP. Ratio of WT/KO OT-I cells in the CD103+CD69+ and CD103 CD69+ LP populations. Data points in (c) represent individual mice. (d) The indicated OT-I populations were sorted from the LP at greater than 21 days post infection. RNA was isolated and Klf2 expression was determined using qRT-PCR and levels were normalized to Actb expression. The Klf2 mRNA levels for WT OT-I splenocytes were set to 1. (a-d) Data pooled from two independent experiments with 3-4 mice/group. *p<0.001 (unpaired (a,c) or paired t-test (d)).
Figure 4
Figure 4
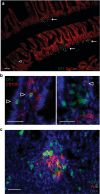
Yptb-OVA infection stimulates formation of CD103 CD8 T cell clusters in the LP. C57BL/6 mice received 104 GFP OT-I T cells and were orally infected with Yptb-OVA the following day. The terminal ileum was isolated at 9 days post infection and tissue sections were analyzed by immunohistochemistry. (a) Distribution of OT-I T cells (green) in the ileum. Arrows indicate LP clusters near the crypts and open arrowheads indicate those in the upper part of the villi. Epithelial cells are stained with anti-EpCam antibody (red). Scale bar equals 100 μm. Representative image from 5 mice. (b) Tissue sections were stained with anti-CD103 antibody (red) to determine expression on OT-I T cells (green). Nuclei are stained with DAPI (blue). Open arrowheads indicate CD103+ OT-I T cells. Images of villous (left) and clustered (right) OT-I T cells. (c) OT-I clusters form around areas of Yptb-OVA infection (anti-Yptb-red, OT-I-green, nuclei-blue). (b-c) Representative images from 3 mice. Scale bars equal 25 μm.
Figure 5
Figure 5
Yptb-OVA induced clusters contain T cells and CX3CR1+ macrophages and/or DCs but not B cells. OT-I cells were transferred into C57BL/6 (a,b) or Cx3cr1gfp/+ (CX3CR1-GFP) (e) mice and one day later mice were orally infected with Yptb-OVA. On day 9 post infection, the distribution of OT-I cells and other immune cells in the ileum was analyzed by immunohistochemistry. OT-I (green) localization near (a) B220+ cells (purple) and (b) CD4 and CD8 T cells (red and blue, respectively). Scale bars equal 25 μm. Representative data from 3-5 mice (a,b). (c,d) CX3CR1-GFP mice were infected with Yptb-OVA and on day 7 post infection LP cells were isolated and compared to naive controls. (c) Flow cytometry analysis of populations by expression of MHC class II, CD11c, CD11b, CD103, and CX3CR1-GFP. (d) Cell populations are graphed as a percent of total MHC class II+ LP cells; data are means and SDs pooled from 2 experiments with 4-7 mice/group. *p<0.05 (unpaired t-test). (e) CD90.1 OT-I (red) localization near CD11c (blue) and CX3CR1-GFP expressing cells. Scale bars equal 25 μm. Representative data from 3 mice.
Figure 6
Figure 6
CX3CR1-expressing macrophage and/or DC populations present Yptb-OVA antigens, but antigenic stimulation does not downregulate CD103 expression on intestinal TRM cells. (a,b) LP macrophage and/or DC populations were sorted from naive and day 6 Yptb-OVA infected Cx3cr1gfp/+ (CX3CR1-GFP) mice as in Fig. 5d. Sorted populations were mixed with CFSE-labeled memory CD8 T cells from Yptb-OVA immune mice and incubated for 3 days. A representative plot indicating the percentage CD8 T cells that underwent division in response to CX3CR1int antigen-presenting cells (a) and means and SDs from 3 biological replicates (b). *p<0.001 (unpaired t-test). (c,d) On day 6 after Yptb-OVA infection, CD8 T cells from the MLN and spleen were transferred into mice infected 6 days earlier with Yptb-NEG. Nine days after transfer, IEL or LP cells were isolated and CD103 expression on Yptb antigen-specific (Yptb-sp.) and antigen non-specific (OT-I) CD8 cells was determined (c) and LP data was quantified in (d) and represents the percent CD103+ and CD103 cells within the CD69+ population. Data are means and SDs pooled 2 independent experiments with 4 mice total; analyzed using paired Student's t-test.
Figure 7
Figure 7
Cxcr3 KO T cells enter the intestine, but fail to localize to areas of inflammation. (a) Intestinal macrophage and/or DC populations were sorted as in Fig. 5d, RNA was isolated and expression of Cxcl9 and Cxcl10 was determined by qRTPCR. Chemokine expression normalized to expression of Actb. Data are means and SDs from 2 biological replicates. * p<0.01,**p<0.001 compared to the same population from naive mice (unpaired t-test). (b-e) 5x10³ each GFP wild-type and CD90.1 Cxcr3 KO OT-I cells were transferred into C57BL/6 mice and one day later mice were infected with Yptb-OVA. OT-I cells were analyzed on day 9 post infection. (b) Wild-type and Cxcr3 KO OT-I cells in tissues expressed as a percent of total CD8β+ T cells. Data are means and SDs from an individual experiment with 4 mice; representative of 3 experiments. *p<0.01 (paired t-test). (c) Distribution of wild-type (green) and Cxcr3 KO (red) OT-I T cells in the ileum. Nuclei are stained with DAPI (blue). Boxes indicate an area of uniform OT-I distribution (i) and an OT-I cluster (ii), with expanded images of the highlighted areas. Scale bars equal 25μm. Images are representative of 5 mice. (d) The number of OT-I cells per villus in the ileum was determined as shown. (e) Quantification of the number of wild-type and Cxcr3 KO OT-I T cells per villus. Distribution of wild-type and Cxcr3 KO cells are significantly different, p<0.01 (Chi-squared test). Data are from a single experiment with 2 mice and representative of 3 experiments.
Figure 8
Figure 8
CXCR3-mediated localization affects expression of CD103 on intestinal TRM CD8 cells and protection. 5x10³ GFP wild-type and CD90.1 Cxcr3 KO OT-I cells were transferred into C57BL/6 mice and one day later mice were infected with Yptb-OVA. OT-I cells were analyzed on day 9 post infection. (a,b) CD103 expression on OT-I T cells in the IEL and LP compartments. Plots are of individual mice and representative of 3 independent experiments (a). (b) Data are means and SDs from a single experiment; data points represent individual mice. Representative of three independent experiments. *p<0.01, **p<0.001 (paired t-test). (c) Recipient mice were T cell depleted and infected with Yptb-OVA. Two days later mice received wild-type CD4 T cells and 7.5 ×10⁵ wild-type or Cxcr3 KO CD8 T cells from day 7 Yptb-OVA donor mice. Three days after T cell transfer, ileum and spleen were isolated, homogenized, and plated on CIN agar and bacterial CFU calculated. Data are means and SDs from a single experiment with 3 mice/group, representative of 2 experiments. *p<0.05 (unpaired t-test).

References

    1. Masopust D, Vezys V, Marzo AL, Lefrancois L. Preferential localization of effector memory cells in nonlymphoid tissue. Science. 2001;291:2413–2417. - PubMed
    1. Johansson-Lindbom B, et al. Selective generation of gut tropic T cells in gut-associated lymphoid tissue (GALT): requirement for GALT dendritic cells and adjuvant. J. Exp. Med. 2003;198:963–969. - PMC - PubMed
    1. Mora JR, et al. Selective imprinting of gut-homing T cells by Peyer's patch dendritic cells. Nature. 2003;424:88–93. - PubMed
    1. Masopust D, et al. Dynamic T cell migration program provides resident memory within intestinal epithelium. J. Exp. Med. 2010;207:553–564. - PMC - PubMed
    1. Masopust D, Vezys V, Wherry EJ, Barber DL, Ahmed R. Cutting edge: Gut microenvironment promotes differentiation of a unique memory CD8 T cell population. J. Immunol. 2006;176:2079–2083. - PubMed

Publication types

MeSH terms