Critical slowing down governs the transition to neuron spiking
- PMID: 25706912
- PMCID: PMC4338190
- DOI: 10.1371/journal.pcbi.1004097
Critical slowing down governs the transition to neuron spiking
Abstract
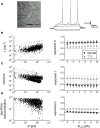
Many complex systems have been found to exhibit critical transitions, or so-called tipping points, which are sudden changes to a qualitatively different system state. These changes can profoundly impact the functioning of a system ranging from controlled state switching to a catastrophic break-down; signals that predict critical transitions are therefore highly desirable. To this end, research efforts have focused on utilizing qualitative changes in markers related to a system's tendency to recover more slowly from a perturbation the closer it gets to the transition--a phenomenon called critical slowing down. The recently studied scaling of critical slowing down offers a refined path to understand critical transitions: to identify the transition mechanism and improve transition prediction using scaling laws. Here, we outline and apply this strategy for the first time in a real-world system by studying the transition to spiking in neurons of the mammalian cortex. The dynamical system approach has identified two robust mechanisms for the transition from subthreshold activity to spiking, saddle-node and Hopf bifurcation. Although theory provides precise predictions on signatures of critical slowing down near the bifurcation to spiking, quantitative experimental evidence has been lacking. Using whole-cell patch-clamp recordings from pyramidal neurons and fast-spiking interneurons, we show that 1) the transition to spiking dynamically corresponds to a critical transition exhibiting slowing down, 2) the scaling laws suggest a saddle-node bifurcation governing slowing down, and 3) these precise scaling laws can be used to predict the bifurcation point from a limited window of observation. To our knowledge this is the first report of scaling laws of critical slowing down in an experiment. They present a missing link for a broad class of neuroscience modeling and suggest improved estimation of tipping points by incorporating scaling laws of critical slowing down as a strategy applicable to other complex systems.
Conflict of interest statement
The authors have declared that no competing interests exist.
Figures


Similar articles
-
White-noise susceptibility and critical slowing in neurons near spiking threshold.Phys Rev E Stat Nonlin Soft Matter Phys. 2006 Nov;74(5 Pt 1):051920. doi: 10.1103/PhysRevE.74.051920. Epub 2006 Nov 30. Phys Rev E Stat Nonlin Soft Matter Phys. 2006. PMID: 17279952
-
Critical phenomena and noise-induced phase transitions in neuronal networks.Phys Rev E Stat Nonlin Soft Matter Phys. 2014 Jan;89(1):012701. doi: 10.1103/PhysRevE.89.012701. Epub 2014 Jan 2. Phys Rev E Stat Nonlin Soft Matter Phys. 2014. PMID: 24580251
-
Deterministic and stochastic bifurcations in the Hindmarsh-Rose neuronal model.Chaos. 2013 Sep;23(3):033125. doi: 10.1063/1.4818545. Chaos. 2013. PMID: 24089961
-
Review of chaos in hair-cell dynamics.Front Neurol. 2024 Jul 10;15:1444617. doi: 10.3389/fneur.2024.1444617. eCollection 2024. Front Neurol. 2024. PMID: 39050124 Free PMC article. Review.
-
Indicators of transitions in biological systems.Ecol Lett. 2018 Jun;21(6):905-919. doi: 10.1111/ele.12948. Epub 2018 Mar 30. Ecol Lett. 2018. PMID: 29601665 Review.
Cited by
-
Experiments and modelling of rate-dependent transition delay in a stochastic subcritical bifurcation.R Soc Open Sci. 2018 Mar 21;5(3):172078. doi: 10.1098/rsos.172078. eCollection 2018 Mar. R Soc Open Sci. 2018. PMID: 29657803 Free PMC article.
-
Early warning signals for critical transitions in a thermoacoustic system.Sci Rep. 2016 Oct 21;6:35310. doi: 10.1038/srep35310. Sci Rep. 2016. PMID: 27767065 Free PMC article.
-
Network dynamics of positive and negative affect in bipolar disorder.J Affect Disord. 2019 Apr 15;249:270-277. doi: 10.1016/j.jad.2019.02.017. Epub 2019 Feb 7. J Affect Disord. 2019. PMID: 30784724 Free PMC article.
-
Early warning signals in motion inference.PLoS Comput Biol. 2020 May 29;16(5):e1007821. doi: 10.1371/journal.pcbi.1007821. eCollection 2020 May. PLoS Comput Biol. 2020. PMID: 32469884 Free PMC article.
-
Irregular spiking of pyramidal neurons organizes as scale-invariant neuronal avalanches in the awake state.Elife. 2015 Jul 7;4:e07224. doi: 10.7554/eLife.07224. Elife. 2015. PMID: 26151674 Free PMC article.
References
Publication types
MeSH terms
LinkOut - more resources
Full Text Sources
Other Literature Sources

