

Direct evidence of brown adipocytes in different fat depots in children
- PMID: 25706927
- PMCID: PMC4338084
- DOI: 10.1371/journal.pone.0117841
Direct evidence of brown adipocytes in different fat depots in children
Abstract
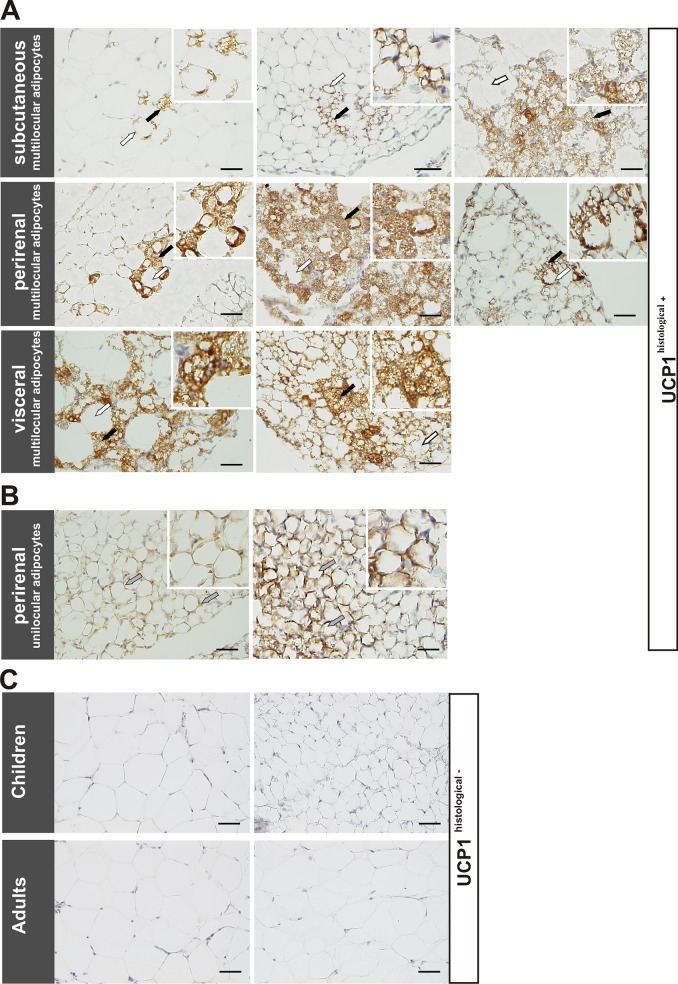
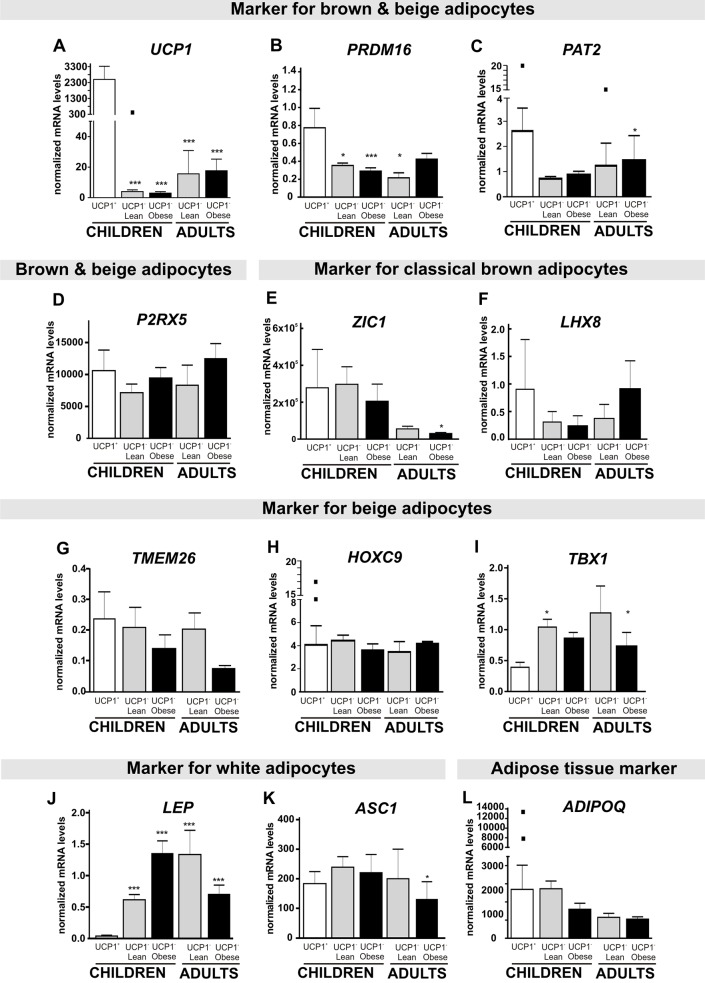
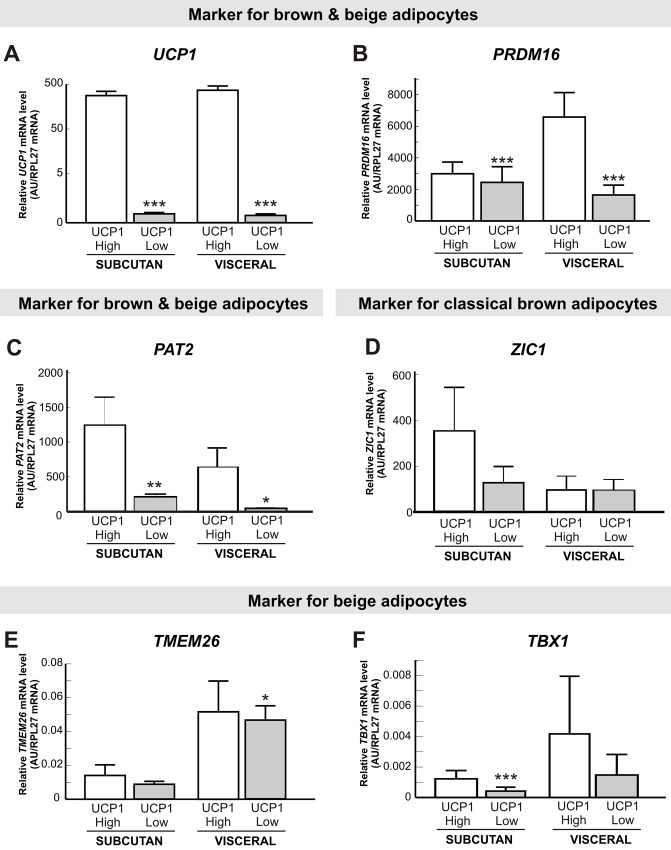
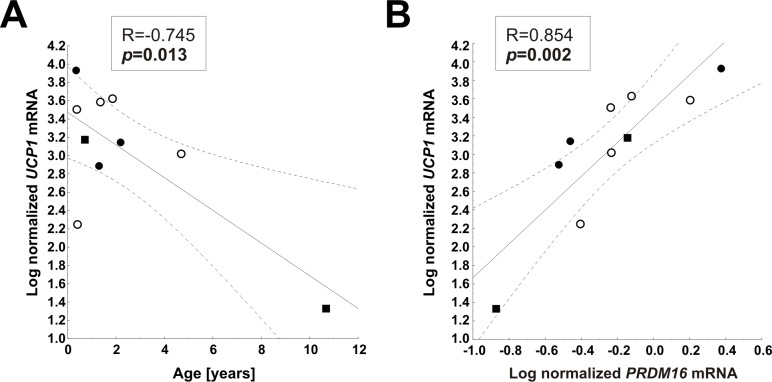
Recent studies suggested the persistence of brown adipocytes in adult humans, as opposed to being exclusively present in infancy. In this study, we investigated the presence of brown-like adipocytes in adipose tissue (AT) samples of children and adolescents aged 0 to 18 years and evaluated the association with age, location, and obesity. For this, we analysed AT samples from 131 children and 23 adults by histological, immunohistochemical and expression analyses. We detected brown-like and UCP1 positive adipocytes in 10.3% of 87 lean children (aged 0.3 to 10.7 years) and in one overweight infant, whereas we did not find brown adipocytes in obese children or adults. In our samples, the brown-like adipocytes were interspersed within white AT of perirenal, visceral and also subcutaneous depots. Samples with brown-like adipocytes showed an increased expression of UCP1 (>200fold), PRDM16 (2.8fold), PGC1α and CIDEA while other brown/beige selective markers, such as PAT2, P2RX5, ZIC1, LHX8, TMEM26, HOXC9 and TBX1 were not significantly different between UCP1 positive and negative samples. We identified a positive correlation between UCP1 and PRDM16 within UCP1 positive samples, but not with any other brown/beige marker. In addition, we observed significantly increased PRDM16 and PAT2 expression in subcutaneous and visceral AT samples with high UCP1 expression in adults. Our data indicate that brown-like adipocytes are present well beyond infancy in subcutaneous depots of non-obese children. The presence was not restricted to typical perirenal locations, but they were also interspersed within WAT of visceral and subcutaneous depots.
Conflict of interest statement
Figures
Similar articles
-
White-to-brown transdifferentiation of omental adipocytes in patients affected by pheochromocytoma.Biochim Biophys Acta. 2013 May;1831(5):950-9. doi: 10.1016/j.bbalip.2013.02.005. Epub 2013 Feb 20. Biochim Biophys Acta. 2013. PMID: 23454374
-
Diet-induced changes in Ucp1 expression in bovine adipose tissues.Gen Comp Endocrinol. 2013 Apr 1;184:87-92. doi: 10.1016/j.ygcen.2013.01.006. Epub 2013 Jan 29. Gen Comp Endocrinol. 2013. PMID: 23370305
-
Molecular and histological evidence of brown adipose tissue in adult cats.Vet J. 2013 Jan;195(1):66-72. doi: 10.1016/j.tvjl.2012.05.029. Epub 2012 Jul 25. Vet J. 2013. PMID: 22840208
-
Role of PRDM16 in the activation of brown fat programming. Relevance to the development of obesity.Histol Histopathol. 2013 Nov;28(11):1411-25. doi: 10.14670/HH-28.1411. Epub 2013 Jun 17. Histol Histopathol. 2013. PMID: 23771475 Review.
-
Molecular pathways regulating the formation of brown-like adipocytes in white adipose tissue.Diabetes Metab Res Rev. 2015 Jul;31(5):433-52. doi: 10.1002/dmrr.2600. Epub 2014 Oct 18. Diabetes Metab Res Rev. 2015. PMID: 25139773 Review.
Cited by
-
Transcriptional analysis of adipose tissue during development reveals depot-specific responsiveness to maternal dietary supplementation.Sci Rep. 2018 Jun 25;8(1):9628. doi: 10.1038/s41598-018-27376-3. Sci Rep. 2018. PMID: 29941966 Free PMC article.
-
Loss of Uncoupling Protein 1 Expression in the Subcutaneous Adipose Tissue Predicts Childhood Obesity.Int J Mol Sci. 2023 Nov 24;24(23):16706. doi: 10.3390/ijms242316706. Int J Mol Sci. 2023. PMID: 38069028 Free PMC article.
-
Resting Energy Expenditure, Insulin Resistance and UCP1 Expression in Human Subcutaneous and Visceral Adipose Tissue of Patients With Obesity.Front Endocrinol (Lausanne). 2019 Aug 7;10:548. doi: 10.3389/fendo.2019.00548. eCollection 2019. Front Endocrinol (Lausanne). 2019. PMID: 31440209 Free PMC article.
-
COBL, MKX and MYOC Are Potential Regulators of Brown Adipose Tissue Development Associated with Obesity-Related Metabolic Dysfunction in Children.Int J Mol Sci. 2023 Feb 4;24(4):3085. doi: 10.3390/ijms24043085. Int J Mol Sci. 2023. PMID: 36834493 Free PMC article.
-
The Sexual Dimorphism of Human Adipose Depots.Biomedicines. 2022 Oct 18;10(10):2615. doi: 10.3390/biomedicines10102615. Biomedicines. 2022. PMID: 36289874 Free PMC article. Review.
References
-
- Matthias A, Ohlson KB, Fredriksson JM, Jacobsson A, Nedergaard J, et al. (2000) Thermogenic responses in brown fat cells are fully UCP1-dependent. UCP2 or UCP3 do not substitute for UCP1 in adrenergically or fatty scid-induced thermogenesis. J Biol Chem 275: 25073–25081. - PubMed
Publication types
MeSH terms
Substances
LinkOut - more resources
Full Text Sources
Other Literature Sources
