

Assessment of left and right ventricular diastolic and systolic functions using two-dimensional speckle-tracking echocardiography in patients with coronary slow-flow phenomenon
- PMID: 25706989
- PMCID: PMC4338029
- DOI: 10.1371/journal.pone.0117979
Assessment of left and right ventricular diastolic and systolic functions using two-dimensional speckle-tracking echocardiography in patients with coronary slow-flow phenomenon
Abstract
Objective: Coronary slow-flow phenomenon (CSFP) is an angiographic diagnosis characterised by a low rate of flow of contrast agent in the normal or near-normal epicardial coronary arteries. Many of the patients with CSFP may experience recurrent acute coronary syndromes. However, current clinical practice tends to underestimate the impact of CSFP due to the yet unknown effect on the cardiac function. This study was performed to evaluate left ventricular (LV) and right ventricular (RV) diastolic and systolic functions, using two-dimensional (2D) longitudinal strain and strain rate, in patients with CSFP, and to determine the relationships between the thrombolysis in myocardial infarction (TIMI) frame count (TFC) and LV and RV diastolic and systolic functions.
Methods: Sixty-three patients with CSFP and 45 age- and sex-matched controls without CSFP were enrolled in the study. Diagnosis of CSFP was made by TFC. LV and RV diastolic and systolic functions were assessed by 2D speckle-tracking echocardiography.
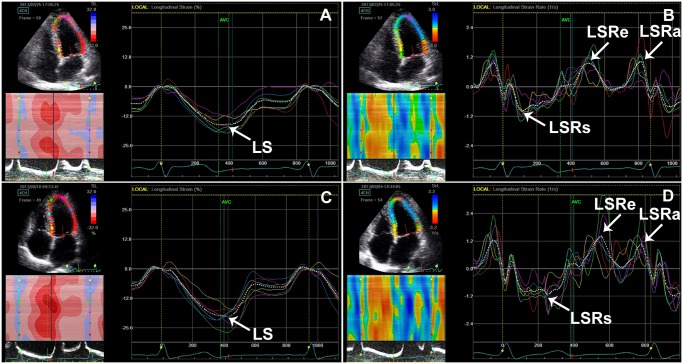
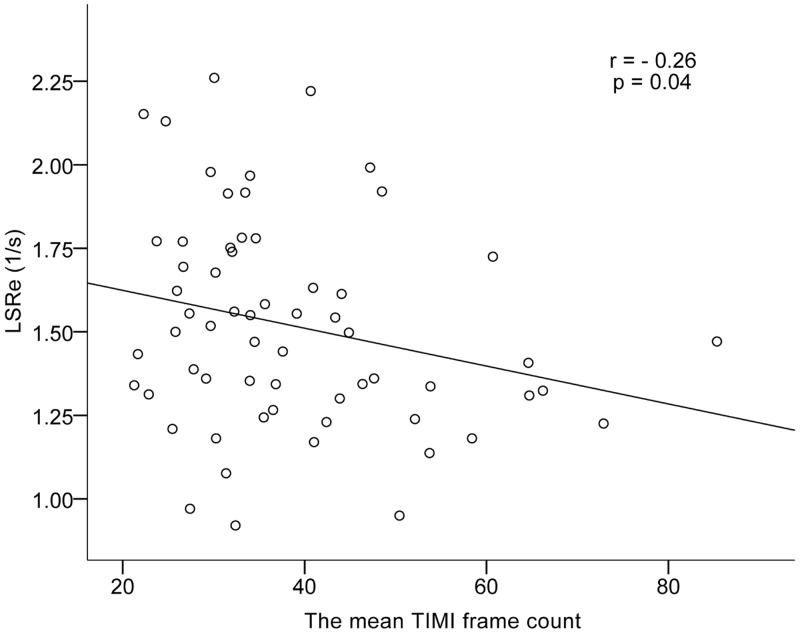
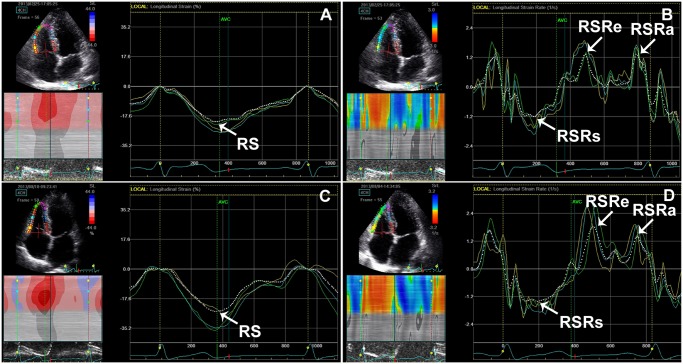
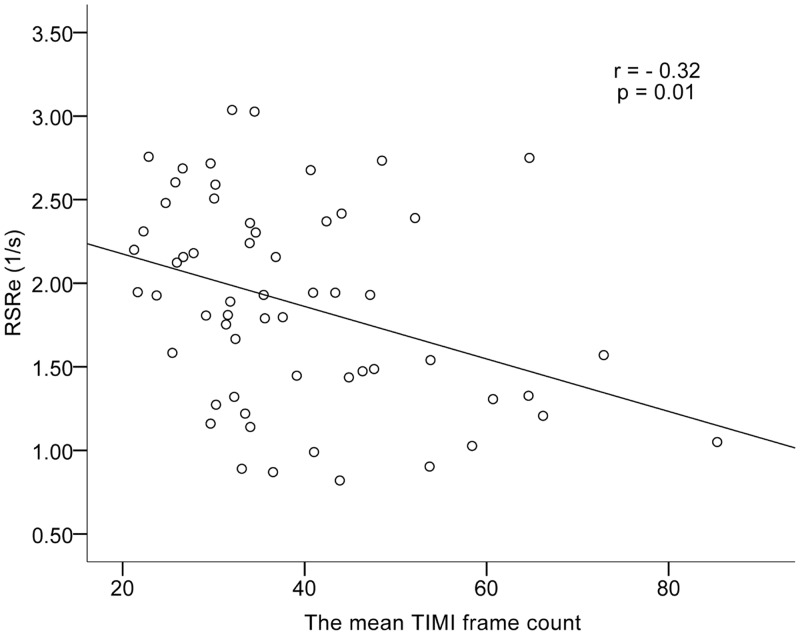
Results: LV peak early diastolic longitudinal strain rate (LSRe) was lower in patients with CSFP than in controls (P = 0.01). LV peak systolic longitudinal strain (LS) and LV peak systolic longitudinal strain rate (LSRs) were lower in patients with CSFP than in controls (P = 0.004 and P = 0.03, respectively). There was no difference in LV ejection fraction. RV peak early diastolic longitudinal strain rate (RSRe) was lower in patients with CSFP than in controls (P = 0.03). There were no differences in RV peak systolic longitudinal strain (RS), RV peak systolic longitudinal strain rate (RSRs), or RV fractional area change among the groups. The mean TFC correlated negatively with LSRe and RSRe in patients with CSFP (r = -0.26, P = 0.04 and r = -0.32, P = 0.01, respectively).
Conclusions: LV diastolic and systolic functions were impaired in patients with CSFP. CSFP also affected RV diastolic function, but not RV systolic function.
Conflict of interest statement
Figures
References
-
- Tambe AA, Demany MA, Zimmerman HA, Mascarenhas E (1972) Angina pectoris and slow flow velocity of dye in coronary arteries—a new angiographic finding. Am Heart J 84: 66–71. - PubMed
-
- Beltrame JF, Limaye SB, Horowitz JD (2002) The coronary slow flow phenomenon—a new coronary microvascular disorder. Cardiology 97: 197–202. - PubMed
-
- Hawkins BM, Stavrakis S, Rousan TA, Abu-Fadel M, Schechter E (2012) Coronary slow flow—prevalence and clinical correlations. Circ J 76: 936–942. - PubMed
-
- Beltrame JF, Limaye SB, Wuttke RD, Horowitz JD (2003) Coronary hemodynamic and metabolic studies of the coronary slow flow phenomenon. Am Heart J 146: 84–90. - PubMed
-
- Cin VG, Pekdemir H, Camsar A, Cicek D, Akkus MN, et al. (2003) Diffuse intimal thickening of coronary arteries in slow coronary flow. Jpn Heart J 44: 907–919. - PubMed
MeSH terms
LinkOut - more resources
Full Text Sources
Other Literature Sources
