Comparative Study
. 2015 Feb 23;10(2):e0116678.
doi: 10.1371/journal.pone.0116678. eCollection 2015.

Cross-sectional comparison of small animal [18F]-florbetaben amyloid-PET between transgenic AD mouse models

Affiliations
Comparative Study

Cross-sectional comparison of small animal [18F]-florbetaben amyloid-PET between transgenic AD mouse models

Matthias Brendel et al. PLoS One. .

Abstract

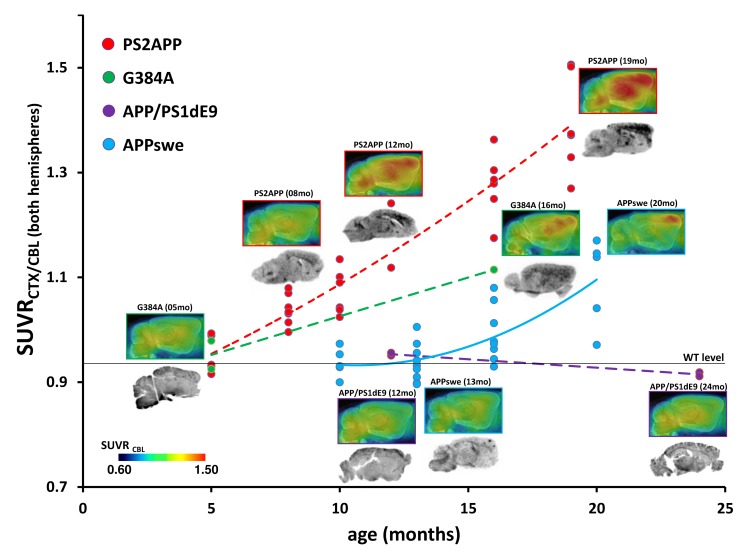
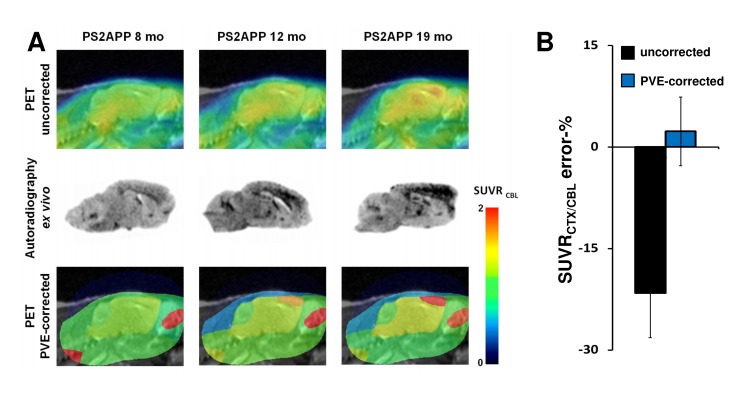
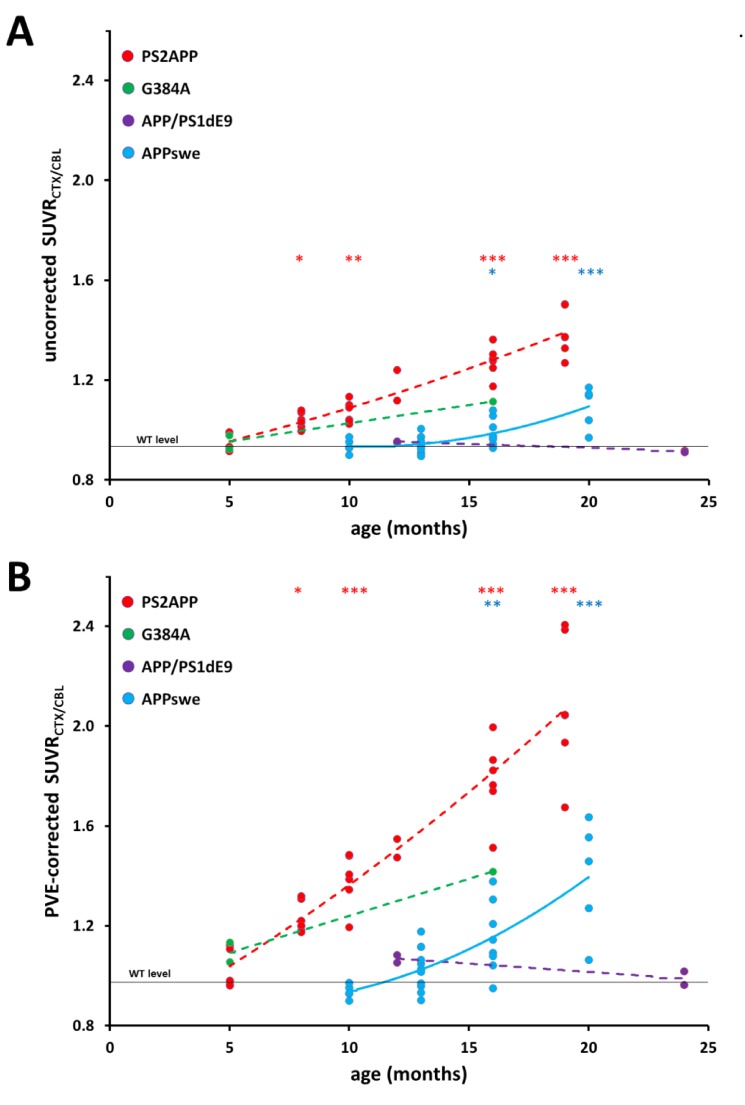
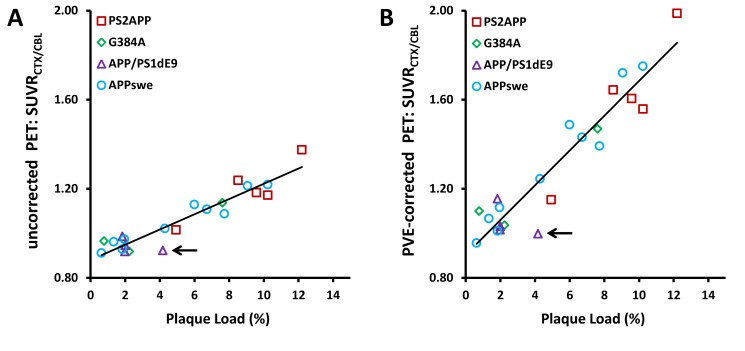
We aimed to compare [18F]-florbetaben PET imaging in four transgenic mouse strains modelling Alzheimer's disease (AD), with the main focus on APPswe/PS2 mice and C57Bl/6 mice serving as controls (WT). A consistent PET protocol (N = 82 PET scans) was used, with cortical standardized uptake value ratio (SUVR) relative to cerebellum as the endpoint. We correlated methoxy-X04 staining of β-amyloid with PET results, and undertook ex vivo autoradiography for further validation of a partial volume effect correction (PVEC) of PET data. The SUVR in APPswe/PS2 increased from 0.95±0.04 at five months (N = 5) and 1.04±0.03 (p<0.05) at eight months (N = 7) to 1.07±0.04 (p<0.005) at ten months (N = 6), 1.28±0.06 (p<0.001) at 16 months (N = 6) and 1.39±0.09 (p<0.001) at 19 months (N = 6). SUVR was 0.95±0.03 in WT mice of all ages (N = 22). In APPswe/PS1G384A mice, the SUVR was 0.93/0.98 at five months (N = 2) and 1.11 at 16 months (N = 1). In APPswe/PS1dE9 mice, the SUVR declined from 0.96/0.96 at 12 months (N = 2) to 0.91/0.92 at 24 months (N = 2), due to β-amyloid plaques in cerebellum. PVEC reduced the discrepancy between SUVR-PET and autoradiography from -22% to +2% and increased the differences between young and aged transgenic animals. SUVR and plaque load correlated highly between strains for uncorrected (R = 0.94, p<0.001) and PVE-corrected (R = 0.95, p<0.001) data. We find that APPswe/PS2 mice may be optimal for longitudinal amyloid-PET monitoring in planned interventions studies.


Conflict of interest statement

Competing Interests: M. B. reports no disclosures; A. J. reports no disclosures; E. G. reports no disclosures; C. R. reports no disclosures; S. B. reports no disclosures; F. G. reports no disclosures; J. C. reports no disclosures; P. C. reports no disclosures; K. B. is an employee of F. Hoffmann-La Roche; C. H. reports no disclosures; H. S. reports no disclosures; P. B. received consultant fees from GE and Piramal Imaging, and honoraria from Siemens; J. H. reports no disclosures; A. R. received consultant fees from Piramal Imaging and GE. This does not alter the authors’ adherence to PLOS ONE policies on sharing data and materials.

Figures

Figure 1
Figure 1. Multi-modal analysis of the four AD mouse strains studies in this cross-sectional [18F]-florbetaben PET study.
Upper images represent group averaged sagittal PET slices, normalised to the cerebellum and overlayed on an MRI mouse atlas [39]. Dots indicate corresponding assessments of SUVRCTX/CBL in individual mice. Dashed lines express the estimated time dependent progression in PS2APP (red; five months: N = 5; eight months: N = 7; 10 months: N = 6; 12 months: N = 2; 16 months: N = 6, 19 months: N = 6), G384A (green; five months: N = 2; 16 months: N = 1) and APP/PS1dE9 (purple; 12 months: N = 2; 24 months: N = 2) mice, fitted with a polynomial function (for the purposes of illustration). Longitudinal progression in APPswe mice is indicated by a continuous blue line. Lower images depict representative ex vivo autoradiography results; autoradiography of APP/PS1dE9 mice and young G384A mice was performed in vitro. WT level expresses the mean SUVRCTX/CBL of pooled WT mice (N = 22).
Figure 2
Figure 2. Amyloid-PET and ex vivo autoradiography in PS2APP mice before and after PVEC.
(A) Comparison of uncorrected [18F]-florbetaben PET images (upper row), corresponding ex vivo autoradiography (mid row) and PVE-corrected PET (lower row) of representative PS2APP mice at 8, 12 and 19 months of age. Sagittal PET images captured 1.6 mm left of the midline were scaled to cerebellum and overlain on a 3T MRI mouse template [13]. PVEC was performed with a 10 region mask (four cerebral and six extracerebral VOIs). (B) Error-(%) (±SD) of uncorrected (black bar) and PVE-corrected (blue bar) data versus ex vivo autoradiography are shown for the whole group of PS2APP mice.
Figure 3
Figure 3. Comparison of uncorrected (A) and PVE-corrected (B) SUVRCTX/CBL of the entire dataset.
Dots indicate corresponding assessments of SUVRCTX/CBL in individual mice. Dashed lines express the estimated time dependent progression in PS2APP (red; five months: N = 5; eight months: N = 7; 10 months: N = 6; 12 months: N = 2; 16 months: N = 6, 19 months: N = 6), G384A (green; five months: N = 2; 16 months: N = 1) and APP/PS1dE9 (purple; 12 months: N = 2; 24 months: N = 2) mice, fitted with a polynomial function (for the purposes of illustration). Longitudinal progression in APPswe mice is indicated by a continuous blue line. P-values for one-way ANOVA (incl. post hoc Tukey) testing of PS2APP and APPswe mice versus youngest littermates were as indicated: * p < 0.05; ** p < 0.005; *** p < 0.001.
Figure 4
Figure 4. Cross-sectional correlation of plaque load percentage (methoxy-X04 staining) with uncorrected (R = 0.94; p < 0.001) (A) and PVE-corrected (R = 0.95; p < 0.001) (B) [18F]-florbetaben PET results (SUVRCTX/CBL) for PS2APP (red squares; eight months: N = 1; 12 months: N = 2; 19 months: N = 2), G384A (green diamonds; five months: N = 2; 16 months: N = 1), APP/PS1dE9 (purple triangle; 12 months: N = 2; 24 months: N = 2) and APPswe (blue circles; 13 months: N = 2; 20 months: N = 8) mice.
A total of 22 hemispheres from 19 animals were examined by histology. Black arrow depicts an APP/PS1dE9 mouse with extensive cerebellar plaque load, which resulted in an anomalously low PET SUVRCTX/CBL.

References

    1. Schneider LS (2013) Alzheimer disease pharmacologic treatment and treatment research. Continuum (Minneap Minn) 19: 339–357. 10.1212/01.CON.0000429180.60095.d0 - DOI - PMC - PubMed
    1. Johnson KA, Minoshima S, Bohnen NI, Donohoe KJ, Foster NL, et al. (2013) Appropriate use criteria for amyloid PET: a report of the Amyloid Imaging Task Force, the Society of Nuclear Medicine and Molecular Imaging, and the Alzheimer’s Association. J Nucl Med 54: 476–490. 10.2967/jnumed.113.120618 - DOI - PubMed
    1. Rominger A, Brendel M, Burgold S, Keppler K, Baumann K, et al. (2013) Longitudinal assessment of cerebral beta-amyloid deposition in mice overexpressing Swedish mutant beta-amyloid precursor protein using 18F-florbetaben PET. J Nucl Med 54: 1127–1134. 10.2967/jnumed.112.114660 - DOI - PubMed
    1. Manook A, Yousefi BH, Willuweit A, Platzer S, Reder S, et al. (2012) Small-animal PET imaging of amyloid-beta plaques with [11C]PiB and its multi-modal validation in an APP/PS1 mouse model of Alzheimer’s disease. PLoS One 7: e31310 10.1371/journal.pone.0031310 - DOI - PMC - PubMed
    1. Kuntner C, Kesner AL, Bauer M, Kremslehner R, Wanek T, et al. (2009) Limitations of small animal PET imaging with [18F]FDDNP and FDG for quantitative studies in a transgenic mouse model of Alzheimer’s disease. Mol Imaging Biol 11: 236–240. 10.1007/s11307-009-0198-z - DOI - PubMed

Publication types

Substances