

Membrane interaction of antimicrobial peptides using E. coli lipid extract as model bacterial cell membranes and SFG spectroscopy
- PMID: 25707312
- PMCID: PMC4385500
- DOI: 10.1016/j.chemphyslip.2015.02.003
Membrane interaction of antimicrobial peptides using E. coli lipid extract as model bacterial cell membranes and SFG spectroscopy
Abstract
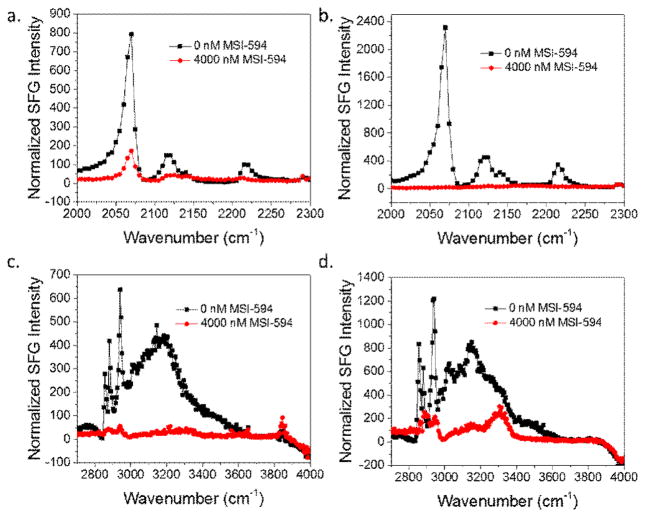
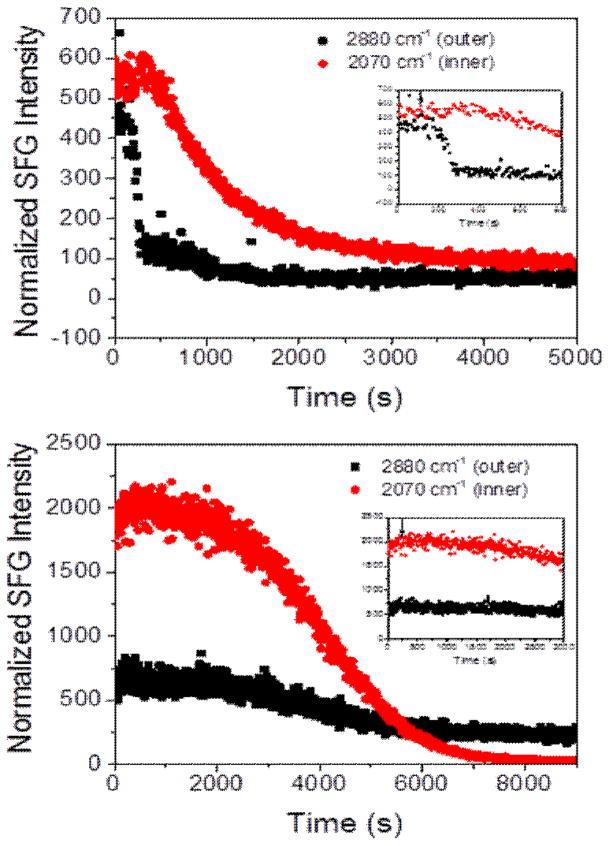
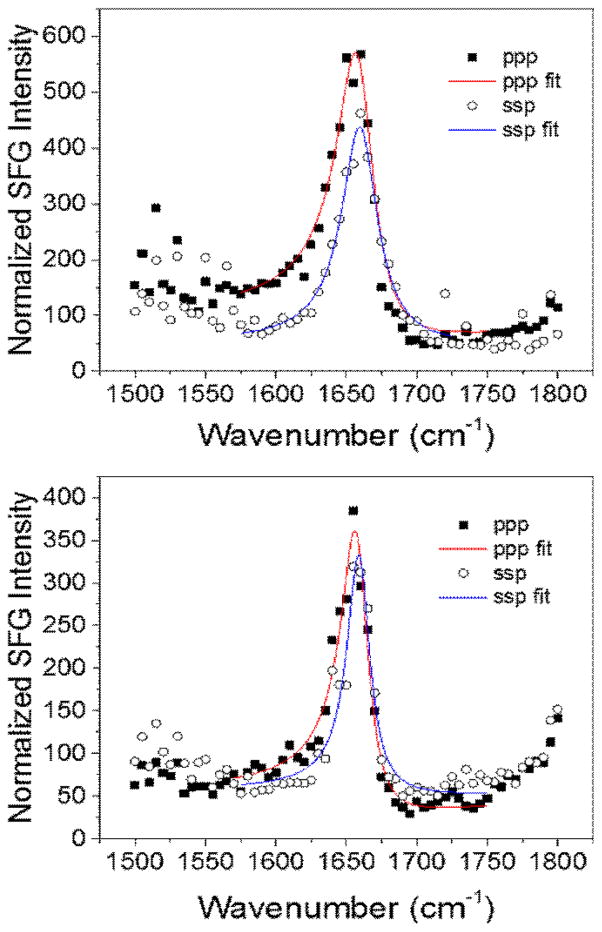
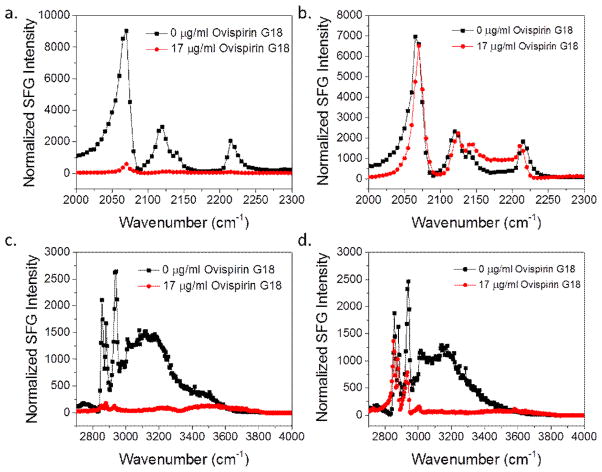
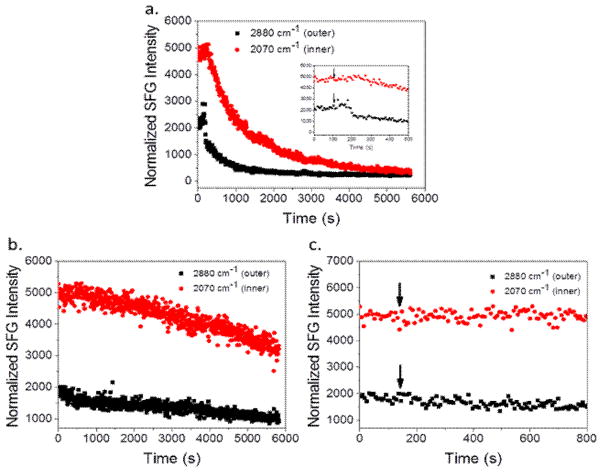
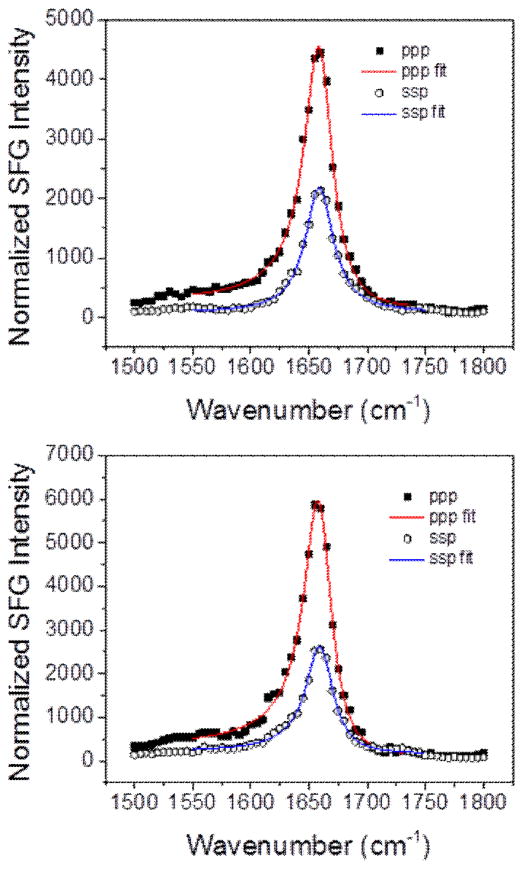
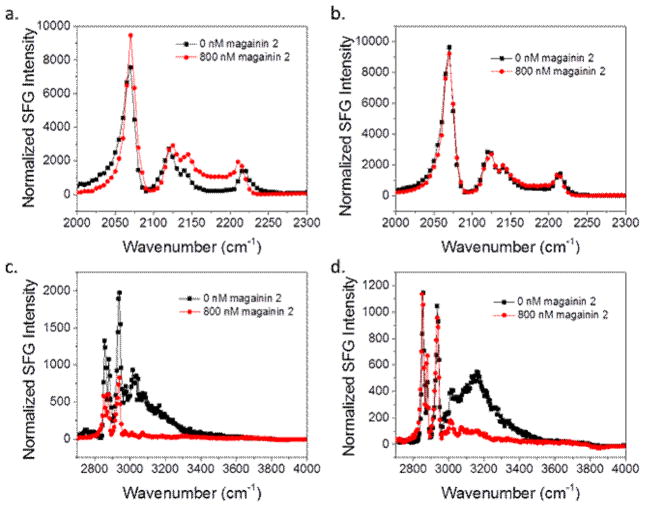
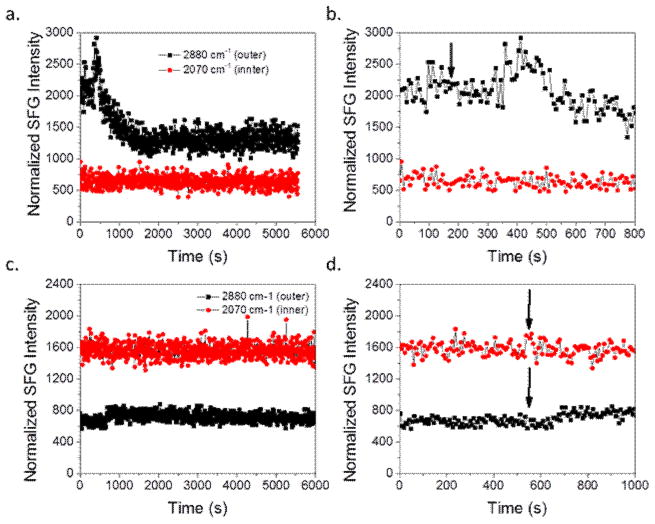
Supported lipid bilayers are used as a convenient model cell membrane system to study biologically important molecule-lipid interactions in situ. However, the lipid bilayer models are often simple and the acquired results with these models may not provide all pertinent information related to a real cell membrane. In this work, we use sum frequency generation (SFG) vibrational spectroscopy to study molecular-level interactions between the antimicrobial peptides (AMPs) MSI-594, ovispirin-1 G18, magainin 2 and a simple 1,2-dipalmitoyl-d62-sn-glycero-3-phosphoglycerol (dDPPG)/1-palmitoyl-2-oleoyl-sn-glycero-3-phosphoglycerol (POPG) bilayer. We compared such interactions to those between the AMPs and a more complex dDPPG/Escherichia coli (E. coli) polar lipid extract bilayer. We show that to fully understand more complex aspects of peptide-bilayer interaction, such as interaction kinetics, a heterogeneous lipid composition is required, such as the E. coli polar lipid extract. The discrepancy in peptide-bilayer interaction is likely due in part to the difference in bilayer charge between the two systems since highly negative charged lipids can promote more favorable electrostatic interactions between the peptide and lipid bilayer. Results presented in this paper indicate that more complex model bilayers are needed to accurately analyze peptide-cell membrane interactions and demonstrates the importance of using an appropriate lipid composition to study AMP interaction properties.
Keywords: Antimicrobial peptide; Bacterial cell; Membrane mimetics; Peptide–lipid interactions; Sum frequency generation; Vibrational spectroscopy.
Copyright © 2015 Elsevier Ireland Ltd. All rights reserved.
Figures
Similar articles
-
Membrane orientation of MSI-78 measured by sum frequency generation vibrational spectroscopy.Langmuir. 2011 Jun 21;27(12):7760-7. doi: 10.1021/la201048t. Epub 2011 May 19. Langmuir. 2011. PMID: 21595453 Free PMC article.
-
Antimicrobial peptide interactions with bacterial cell membranes.J Biomol Struct Dyn. 2025 Jun;43(9):4615-4628. doi: 10.1080/07391102.2024.2304683. Epub 2024 Jan 23. J Biomol Struct Dyn. 2025. PMID: 38263741
-
SFG studies on interactions between antimicrobial peptides and supported lipid bilayers.Biochim Biophys Acta. 2006 Sep;1758(9):1257-73. doi: 10.1016/j.bbamem.2006.01.017. Epub 2006 Feb 17. Biochim Biophys Acta. 2006. PMID: 16524559 Review.
-
Coupling molecular dynamics simulations with experiments for the rational design of indolicidin-analogous antimicrobial peptides.J Mol Biol. 2009 Sep 25;392(3):837-54. doi: 10.1016/j.jmb.2009.06.071. Epub 2009 Jul 2. J Mol Biol. 2009. PMID: 19576903
-
Biological activity and structural aspects of PGLa interaction with membrane mimetic systems.Biochim Biophys Acta. 2009 Aug;1788(8):1656-66. doi: 10.1016/j.bbamem.2009.05.012. Epub 2009 May 29. Biochim Biophys Acta. 2009. PMID: 19481533 Review.
Cited by
-
Characterizing the Structure and Interactions of Model Lipid Membranes Using Electrophysiology.Membranes (Basel). 2021 Apr 27;11(5):319. doi: 10.3390/membranes11050319. Membranes (Basel). 2021. PMID: 33925756 Free PMC article. Review.
-
Antimicrobial Peptides and Cationic Nanoparticles: A Broad-Spectrum Weapon to Fight Multi-Drug Resistance Not Only in Bacteria.Int J Mol Sci. 2022 May 29;23(11):6108. doi: 10.3390/ijms23116108. Int J Mol Sci. 2022. PMID: 35682787 Free PMC article. Review.
-
Accelerated molecular dynamics simulation analysis of MSI-594 in a lipid bilayer.Phys Chem Chem Phys. 2017 Jul 26;19(29):19289-19299. doi: 10.1039/c7cp01941f. Phys Chem Chem Phys. 2017. PMID: 28702543 Free PMC article.
-
Antimicrobial peptides with selective antitumor mechanisms: prospect for anticancer applications.Oncotarget. 2017 Jul 11;8(28):46635-46651. doi: 10.18632/oncotarget.16743. Oncotarget. 2017. PMID: 28422728 Free PMC article. Review.
-
Understanding the antimicrobial properties/activity of an 11-residue Lys homopeptide by alanine and proline scan.Amino Acids. 2018 May;50(5):557-568. doi: 10.1007/s00726-018-2542-6. Epub 2018 Feb 21. Amino Acids. 2018. PMID: 29468307
References
-
- Nikaido H. Prevention of drug access to bacterial targets: Permeability barriers and active efflux. Science. 1994;264:382–388. - PubMed
-
- Bussiere DE, Muchmore SW, Dealwis CG, Schluckebier G, Nienaber VL, Edalji RP, Walter KA, Ladror US, Holzman TF, Abad-Zapatero C. Crystal structure of ErmC ‘,an rRNA methyltransferase which mediates antibiotic resistance in bacteria. Biochemistry. 1998;37:7103–7112. - PubMed
-
- Bugg TDH, Wright GD, Dutkamalen S, Arthur M, Courvalin P, Walsh CT. Molecular basis for vancomycin resistance in Enterococcus faecium BM4147: Biosynthesis of a depsipeptide peptidoglycan precursor by vancomycin resistance proteins VanH and VanA. Biochemistry. 1991;30:10408–10415. - PubMed
-
- Lambert PA. Bacterial resistance to antibiotics: Modified target sites. Adv Drug Deliv Rev. 2005;57:1471–1485. - PubMed
Publication types
MeSH terms
Substances
Grants and funding
LinkOut - more resources
Full Text Sources
Other Literature Sources
