. 2015 May;67(5):1323-34.
doi: 10.1002/art.39061.

The Histone Deacetylase Sirtuin 1 Is Reduced in Systemic Sclerosis and Abrogates Fibrotic Responses by Targeting Transforming Growth Factor β Signaling

Affiliations

The Histone Deacetylase Sirtuin 1 Is Reduced in Systemic Sclerosis and Abrogates Fibrotic Responses by Targeting Transforming Growth Factor β Signaling

Jun Wei et al. Arthritis Rheumatol. 2015 May.

Abstract

Objective: Persistent fibroblast activation underlies skin fibrosis in systemic sclerosis (SSc), but the transcriptional and epigenetic mechanisms controlling this process are not well understood. In view of the potent influence of acetylation status governing tissue fibrosis, we undertook this study to investigate the expression of the antiaging deacetylase enzyme sirtuin 1 (SIRT1) in SSc and its effects on fibrotic responses in vitro and in vivo.

Methods: Tissue expression of SIRTs was interrogated from publicly available genome-wide expression data sets and by immunohistochemistry. The effects of SIRT1 on modulating fibrotic responses, as well as the underlying mechanisms, were examined in human and mouse fibroblasts in culture and in an experimental fibrosis model in the mouse.

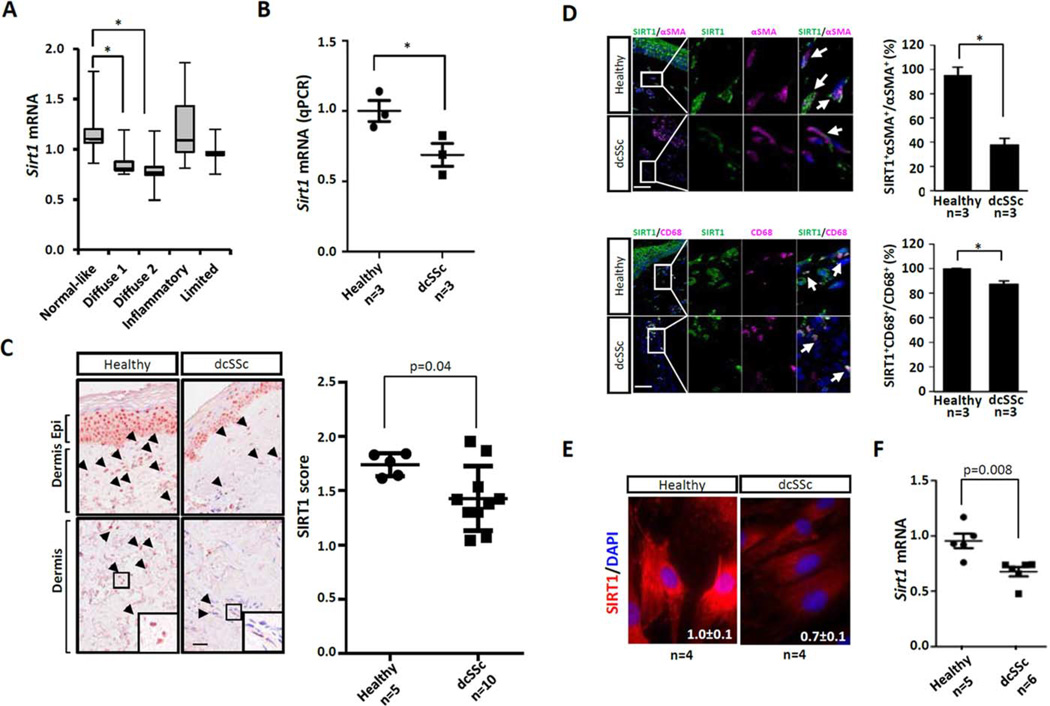
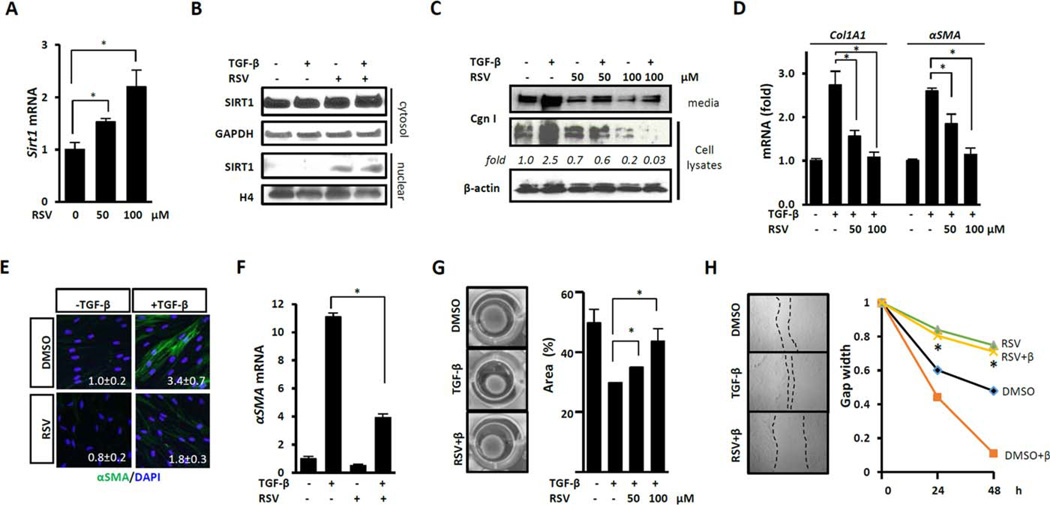
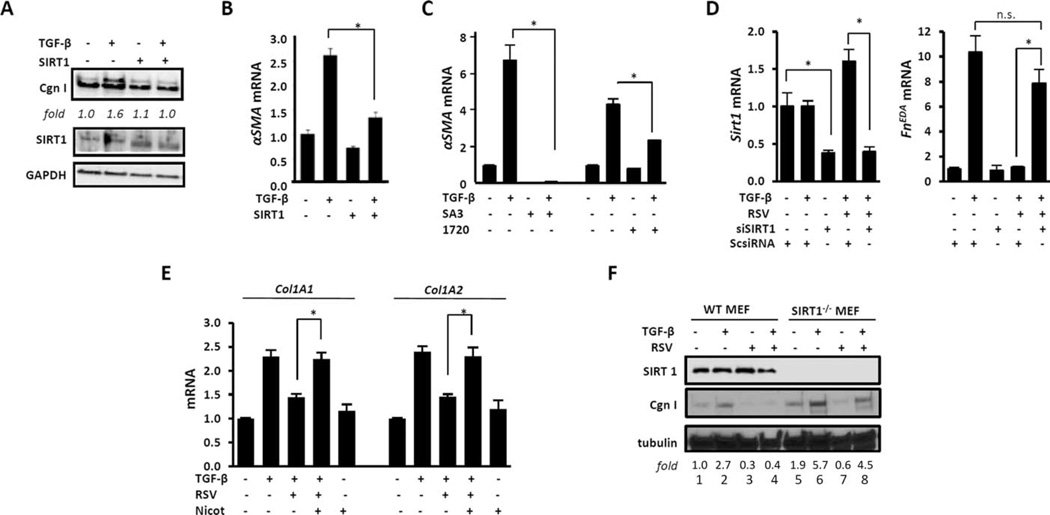
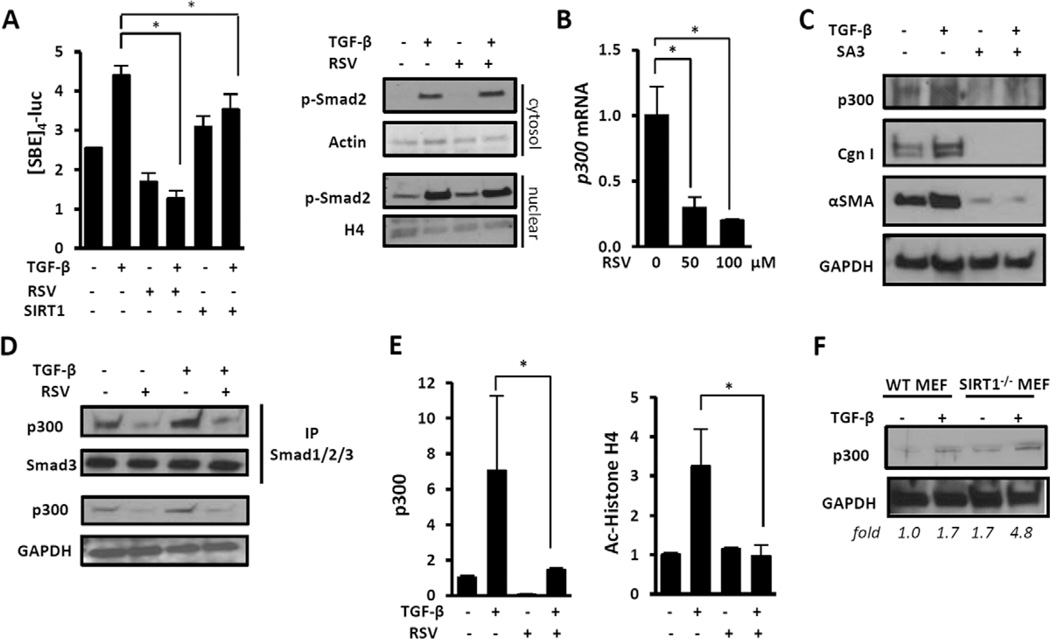
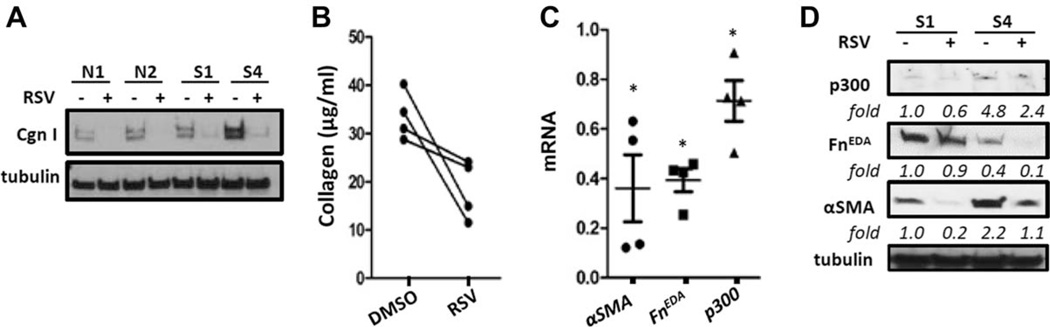
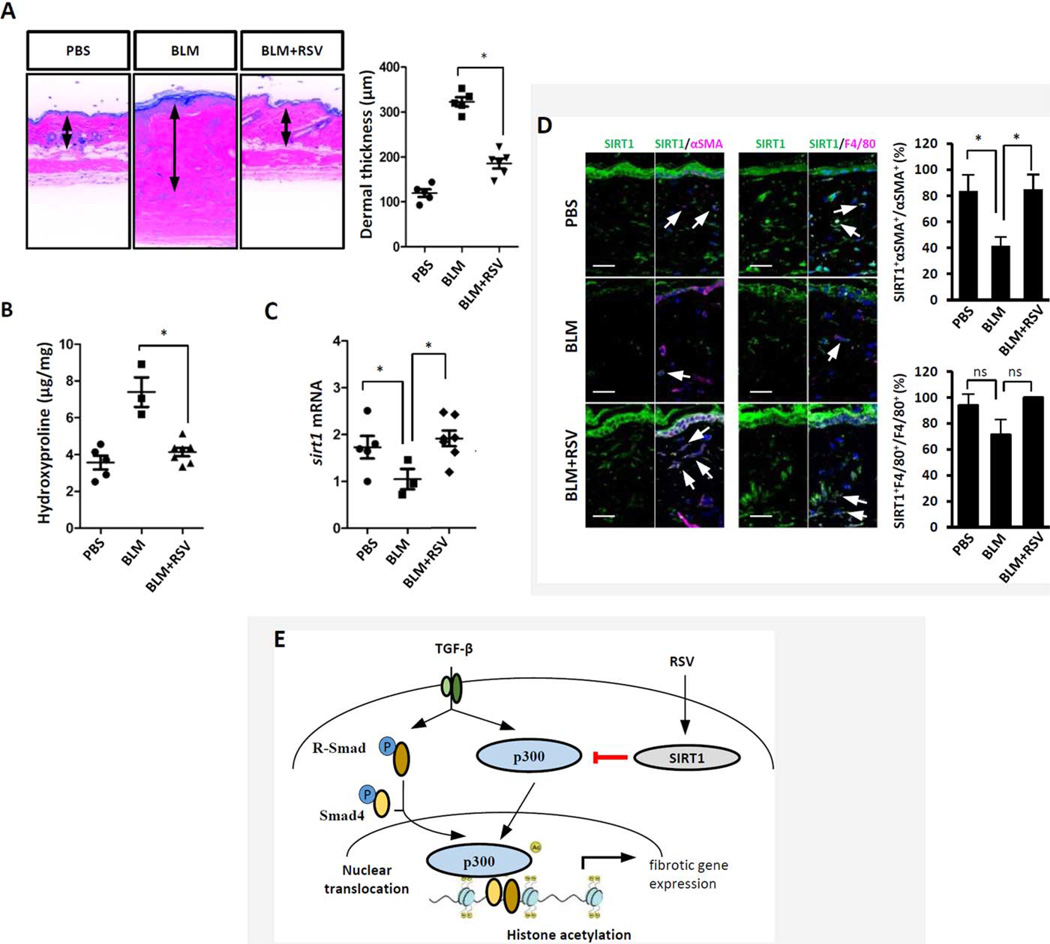
Results: Analysis of transcriptome data revealed a selective reduction of SIRT1 messenger RNA (mRNA) levels in SSc skin biopsy samples as well as a negative correlation of SIRT1 mRNA with the skin score. Cellular SIRT1 levels were suppressed in normal fibroblasts exposed to hypoxia or platelet-derived growth factor and were constitutively down-regulated in SSc fibroblasts. Activation of SIRT1 attenuated fibrotic responses in skin fibroblasts and skin organ cultures, while genetic or pharmacologic inhibition of SIRT1 had profibrotic effects. The antifibrotic effects of SIRT1 were due in part to decreased expression and function of the acetyltransferase p300. In mice, experimentally induced skin fibrosis was accompanied by reduced SIRT1 expression in lesional tissue fibroblasts, and both fibrosis and loss of SIRT1 in these mice were mitigated by treatment with a SIRT1 activator.

Conclusion: SIRT1 has antifibrotic effects, and its reduced tissue expression in patients with SSc might have a direct causal role in progression of fibrosis. Pharmacologic modulation of SIRT1 in these patients therefore might represent a potential treatment strategy.


Figures

Figure 1
Figure 1. Reduced sirtuin 1 (SIRT1) expression in systemic sclerosis (SSc)
A, Reduced SIRT1 mRNA in SSc skin biopsy–derived microarray data sets. Data are shown as box plots. Each box represents the 25th to 75th percentiles. Lines inside the boxes represent the median. Lines outside the boxes represent the minimum and maximum values. * = P<0.001. B, Determination of SIRT1 mRNA levels using real-time quantitative polymerase chain reaction (qPCR), following isolation of RNA from forearm lesional skin from patients with diffuse cutaneous SSc (dcSSc) and healthy controls. Levels of mRNA were normalized to GAPDH levels. * = P <0.05. C, Immunohistochemistry. Healthy control and dcSSc skin biopsy samples were examined using antibodies to SIRT1. Representative images are shown at the left. Arrowheads indicate immunopositive cells within the dermis. Boxed areas in bottom panels are shown at higher magnification in bottom right of panels. Epi = epidermis. Original magnification × 400. Bar = 50 µm. SIRT1 scores are shown at the right. Immunostaining was quantified as described in Subjects and Methods. D, SIRT1 immunofluorescence in skin biopsy samples. Healthy control and dcSSc skin biopsy samples were immunostained with antibodies to α-smooth muscle actin (α-SMA) or CD68 (both pink), SIRT1 (green), and DAPI (blue). Representative images are shown at the left. Arrows indicate double-immunopositive cells. Bars = 50 µm. The proportion of double-positive cells is shown at the right and was calculated as described in Subjects and Methods. Values are the mean±SEM. * = P <0.05. E, Representative images of SIRT1 immunofluorescence in healthy control and dcSSc fibroblasts in culture. Red indicates SIRT1; blue indicates DAPI. Original magnification × 400. F, Determination of SIRT1 mRNA levels using real-time qPCR, following isolation of RNA from healthy control (n = 5) or dcSSc (n = 6) skin fibroblasts. Levels of mRNA were normalized to GAPDH levels. In B, C, and F, symbols represent individual subjects; bars show the mean ± SEM.
Figure 2
Figure 2. Sirtuin 1 (SIRT1) activation abrogates fibrotic responses
Confluent foreskin (AE, G, and H) or adult human skin (F) fibroblasts were preincubated for 60 minutes with resveratrol (RSV; 100 µM unless indicated otherwise), followed by incubation with transforming growth factor β (TGFβ; 10 ng/ml) (BH). A, D, and F, Messenger RNA was analyzed by real-time quantitative polymerase chain reaction. Levels of mRNA were normalized to GAPDH levels. Values are the mean±SD of triplicate determinations from 1 representative experiment * = P <0.05. B and C, Nuclear and cytoplasmic (cytosol) protein fractions (B) or whole-cell lysates and supernatants (C) were examined by Western blot analysis. Band intensities normalized to GAPDH (fold) are shown. E, Shown are representative images of immunofluorescence. Green indicates α-smooth muscle actin (α-SMA); blue indicates DAPI. Original magnification × 400. Mean fluorescence intensity normalized to nuclear staining (mean ±SD of 5 independent areas per microscopic field) is shown in each panel. G, Shown are gel contraction assays. Representative images are shown at the left. Results shown at the right are expressed as the percent of gel area compared to time zero. Values are the mean ± SD of triplicate determinations from 1 experiment representative of 3. * = P <0.05. H, Shown are in vitro wound healing assays. Representative microscopic images are shown at the left. Fibroblast migration was monitored for 48 hours and results are shown at the right. Values are the mean±SD of triplicate determinations from 3 randomly chosen sites in each sample from 1 experiment representative of 3. P <0.05 versus fibroblasts treated with TGFβ alone. H4=histone H4; Cgn I=type I collagen; RSV+β=RSV+TGFβ; DMSO+β=DMSO+TGFβ.
Figure 3
Figure 3. Sirtuin 1 (SIRT1) mediates the antifibrotic effects of resveratrol (RSV)
Confluent human skin fibroblasts (AE) were transiently transfected with SIRT1 expression vectors (A and B), preincubated for 30 minutes with SIRT1 activator 3 (SA3) or SRT1720 (1720) (C) or with nicotinamide (Nicot; 10 mM) (E), or were transiently transfected with small interfering RNA (siRNA) coding for SIRT1 (siSIRT1) or scrambled control siRNA (ScsiRNA) for 48 hours (D). Transforming growth factor β (TGFβ; 10 ng/ml) was added for 24 hours. A, Whole-cell lysates were examined by Western blot analysis. Band intensities normalized to GAPDH (fold) are shown. BE, Messenger RNA was analyzed by real-time quantitative polymerase chain reaction. Levels of mRNA were normalized to GAPDH levels. Values are the mean±SD of triplicate determinations from 1 representative experiment. * = P <0.05. F, Confluent SIRT1−/− and wild-type (WT) mouse embryonic fibroblasts (MEFs) in parallel were incubated with resveratrol (50 µM) for 30 minutes, followed by incubation with TGFβ (10 ng/ml) for 24 hours. Whole-cell lysates were examined by Western blot analysis. Band intensities normalized to tubulin (fold) are shown. Cgn I = type I collagen; α-SMA = α-smooth muscle actin; FnEDA = fibronectin extra domain A; NS = not significant.
Figure 4
Figure 4. Resveratrol blocks canonical TGFβ signaling by disrupting p300 function
A, Shown is modulation of Smad signaling. Left, Fibroblasts transiently transfected with SBE4-Luc along with SIRT1 or empty vector were preincubated with resveratrol, followed by incubation with TGFβ (10 ng/ml) for 24 hours. Whole-cell lysates were assayed for their luciferase activities. Results were normalized to Renilla luciferase levels. Values are the mean ± SD of triplicate experiments. * = P <0.05. Right, Fibroblasts preincubated with resveratrol were incubated with TGFβ for 120 minutes. Cytosolic and nuclear fractions were examined by Western blot analysis. B and C, Fibroblasts were preincubated with SIRT1 activator 3 (20 µM) for 30 minutes, followed by incubation with TGFβ for 24 hours. B, Messenger RNA was analyzed by real-time quantitative polymerase chain reaction. Levels of mRNA were normalized to GAPDH levels. Values are the mean±SD of triplicate determinations from 1 representative experiment. * = P<0.05. C, Whole-cell lysates were examined by Western blot analysis. D and E, Fibroblasts were preincubated with resveratrol for 24 hours, followed by incubation with TGFβ (10 ng/ml) for 60 minutes. D, Whole-cell lysates were immunoprecipitated (IP) with antibodies to Smad1/2/3 and subjected to Western blot analysis. E, Shown are chromatin immunoprecipitation assays. DNA was immunoprecipitated using the indicated antibodies to p300 or acetylated histone H4 (Ac-histone H4) or IgG and then amplified using primers spanning the human COL1A2 promoter TGFβ response element. Results are expressed as the fold change in precipitated DNA. Values are the mean±SD of triplicate determinations. * = P <0.05. F, SIRT1−/− and WT MEFs in parallel were incubated with TGFβ (10 ng/ml) for 24 hours. Whole-cell lysates were examined by Western blot analysis. Band intensities normalized to GAPDH (fold) are shown. p-Smad2 = phosphorylated Smad2; H4 = histone H4 (see Figure 3 for other definitions).
Figure 5
Figure 5. Resveratrol attenuates collagen overproduction in systemic sclerosis (SSc) fibroblasts in culture
Confluent healthy control (n=4) or diffuse cutaneous SSc (dcSSc) (n = 4) skin fibroblasts were incubated in medium with or without resveratrol (100 µM) for 72 hours. A, Whole cell lysates were examined by Western blot analysis. Shown are representative blots of 2 healthy control (N1 and N2) and 2 dcSSc (S1 and S4) fibroblasts. B, Secreted collagen in medium was quantified by Sircol assays in dcSSc fibroblasts. Lines indicate results from the same fibroblast cell lines. C, Messenger RNA levels in dcSSc fibroblasts were analyzed by real-time quantitative polymerase chain reaction. Results are expressed relative to untreated cultures and are normalized to 18S ribosomal RNA levels. Values are the mean ± SD. * = P <0.05. D, Whole-cell lysates from 2 dcSSc fibroblasts (S1 and S4) were examined by Western blot analysis. See Figure 3 for other definitions.
Figure 6
Figure 6. Pharmacologic SIRT1 activation ameliorates skin fibrosis
Mice were given daily subcutaneous injections of bleomycin (BLM) alone for 14 days or daily intraperitoneal injections of bleomycin combined with resveratrol for 21 days. At the end of the experiments, lesional skin was harvested. A, Left, Hematoxylin and eosin staining. Original magnification × 200. Right, Quantification of dermal thickness (3–7 mice per group). * = P <0.001. B, Hydroxyproline assays (3–7 mice per group). C, Determination of SIRT1 mRNA levels by real-time quantitative polymerase chain reaction, following isolation of RNA from lesional skin. Results were normalized to 36b4 mRNA levels. In AC, symbols represent individual mice; bars show the mean ±SD of triplicate determinations (3–7 mice per group). D, Immunofluorescence with antibodies to SIRT1, α-SMA, or F4/80. Left, Representative images. Arrows indicate double-immunopositive dermal cells. Original magnification × 200. Bars = 50 µm. Right, Immunopositive cells were quantified. Values are the mean± SD of 5 determinations per high-power field (3 mice per group). In BD, * = P <0.05. E, Working model for the antifibrotic effects of SIRT1. TGFβ up-regulates p300 transcription and activity in fibroblasts, resulting in COL1A2 promoter histone acetylation and increased gene transcription. In systemic sclerosis fibroblasts, constitutive p300 up-regulation enhances Smad2/3-dependent transcription. By suppressing p300/Smad-dependent transcription, SIRT1 attenuates TGFβ-induced pro-fibrotic responses. PBS = phosphate buffered saline; R-Smad=receptor-activated Smad; p = phosphorylated (see Figure 3 for other definitions).

Similar articles

Cited by

References

    1. Bhattacharyya S, Wei J, Varga J. Understanding fibrosis in systemic sclerosis: shifting paradigms, emerging opportunities. Nat Rev Rheumatol. 2012;8:42–54. - PMC - PubMed
    1. Ghosh AK, Varga J. The transcriptional coactivator and acetyl-transferase p300 in fibroblast biology and fibrosis. J Cell Physiol. 2007;213:663–671. - PubMed
    1. Mann J, Mann DA. Epigenetic regulation of wound healing and fibrosis. Curr Opin Rheumatol. 2013;25:101–107. - PubMed
    1. Ghosh AK, Bhattacharyya S, Lafyatis R, Farina G, Yu J, Thimmapaya B, et al. p300 is elevated in systemic sclerosis and its expression is positively regulated by TGF-β epigenetic feedforward amplification of fibrosis. J Invest Dermatol. 2013;133:1302–1310. - PMC - PubMed
    1. Ghosh AK. FAT-free p300 is good for scar-free tissue repair. J Cell Biochem. 2014;115:1486–1489. - PubMed

Publication types

MeSH terms