. 2015 Apr 30;520(7549):679-82.
doi: 10.1038/nature14171. Epub 2015 Feb 23.

NIK1-mediated translation suppression functions as a plant antiviral immunity mechanism

Affiliations

NIK1-mediated translation suppression functions as a plant antiviral immunity mechanism

Cristiane Zorzatto et al. Nature. .

Abstract

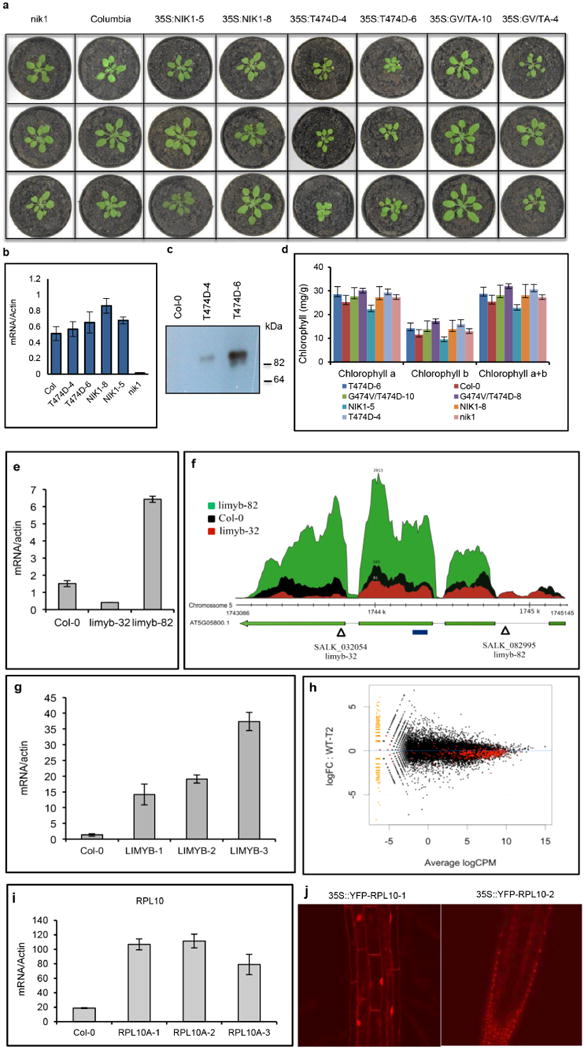
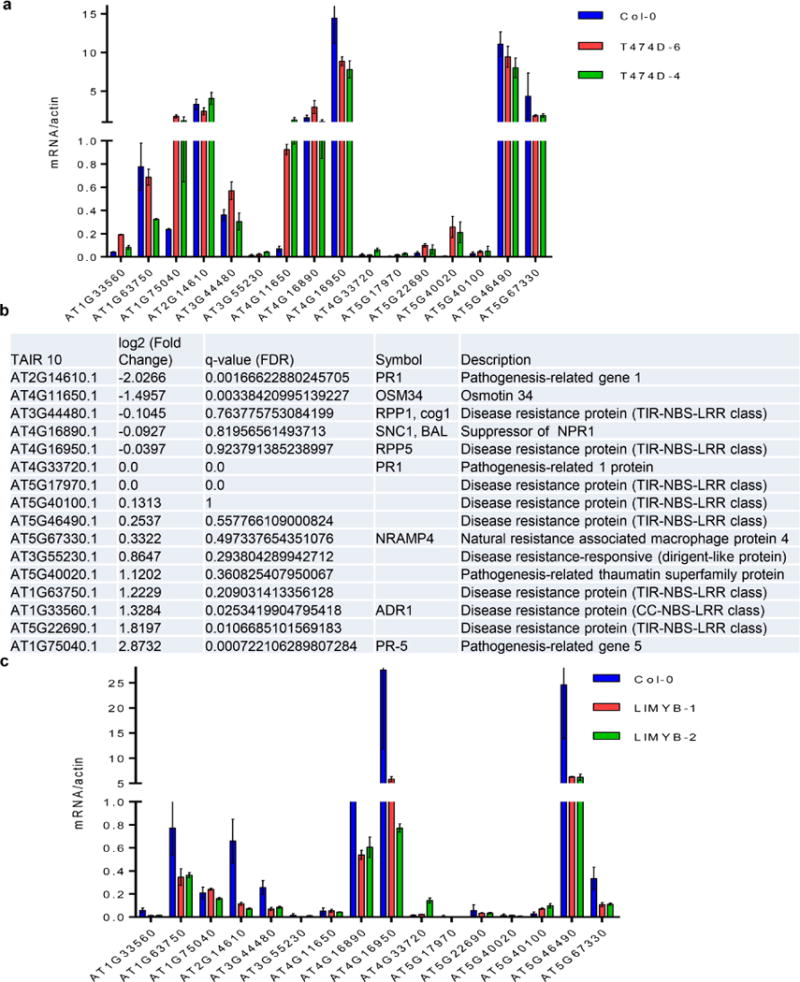
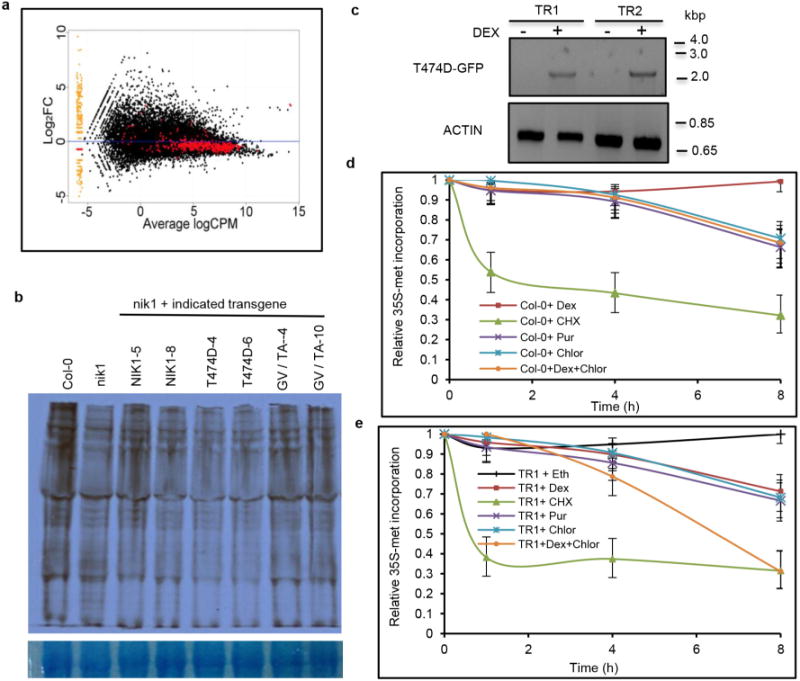
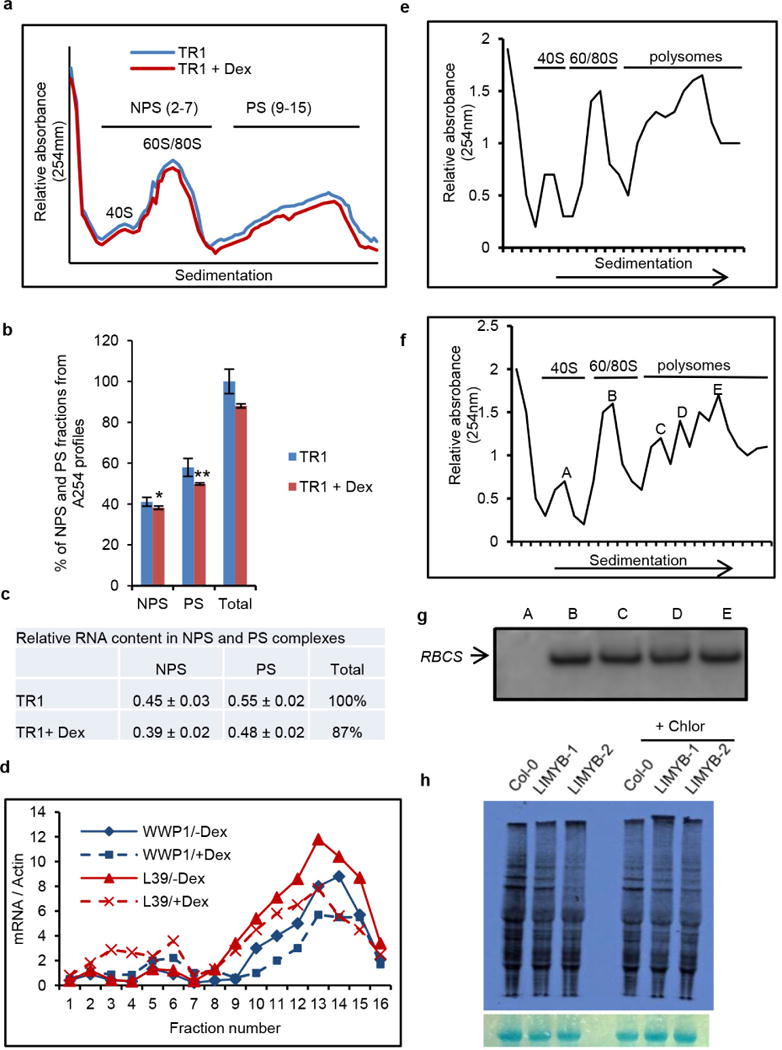
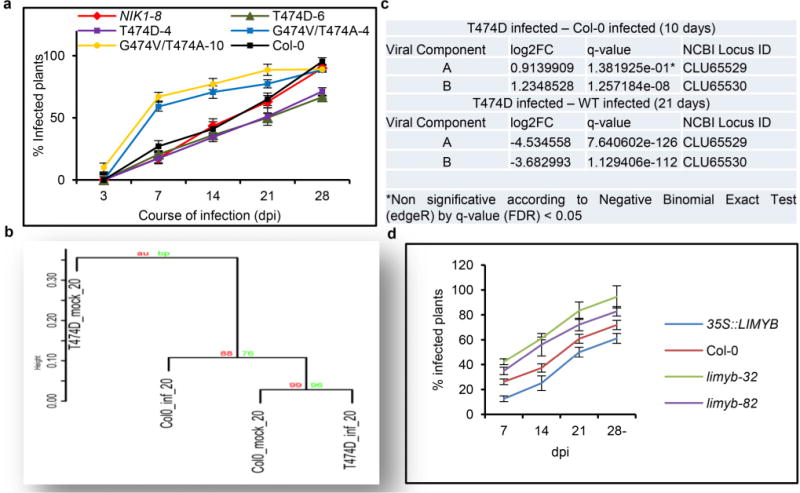
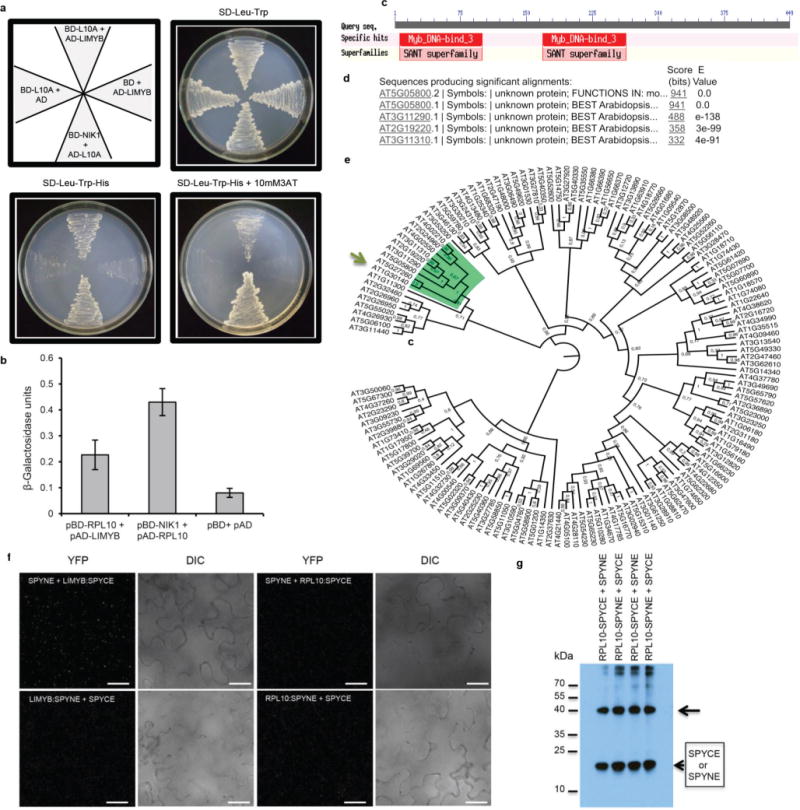
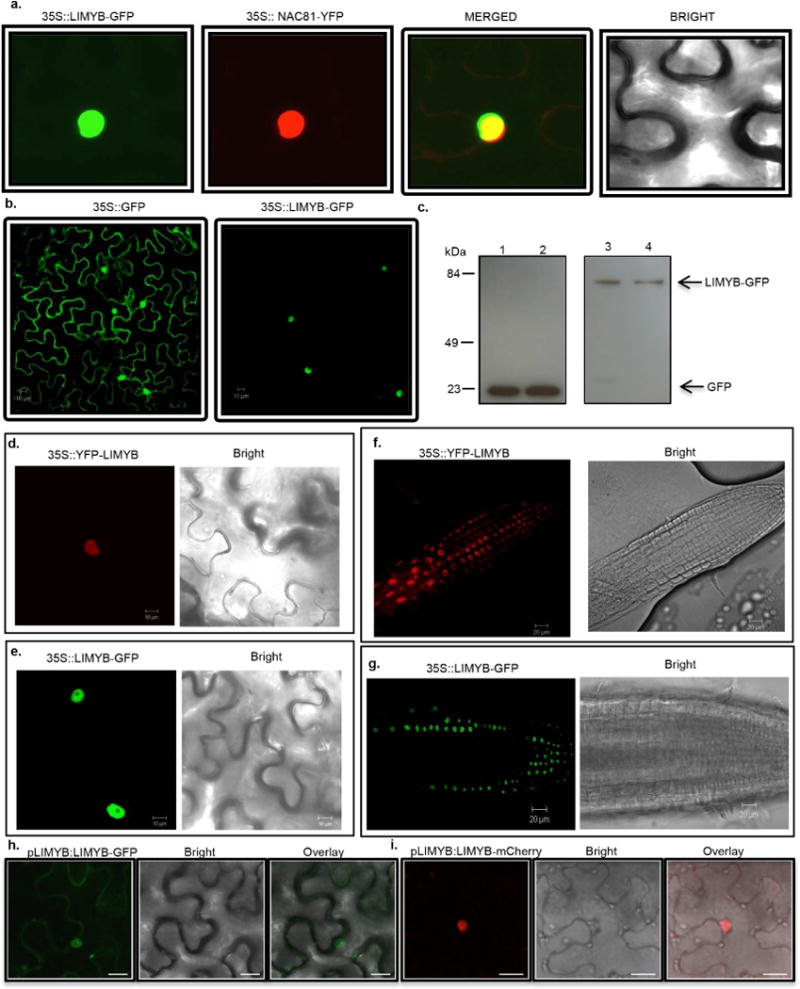
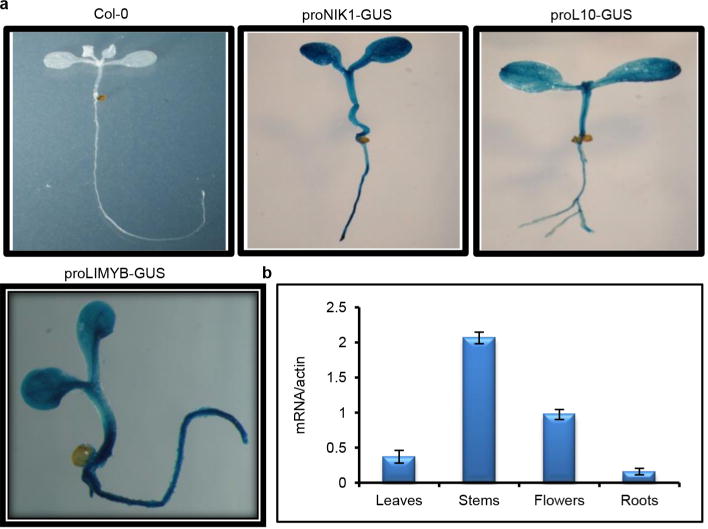
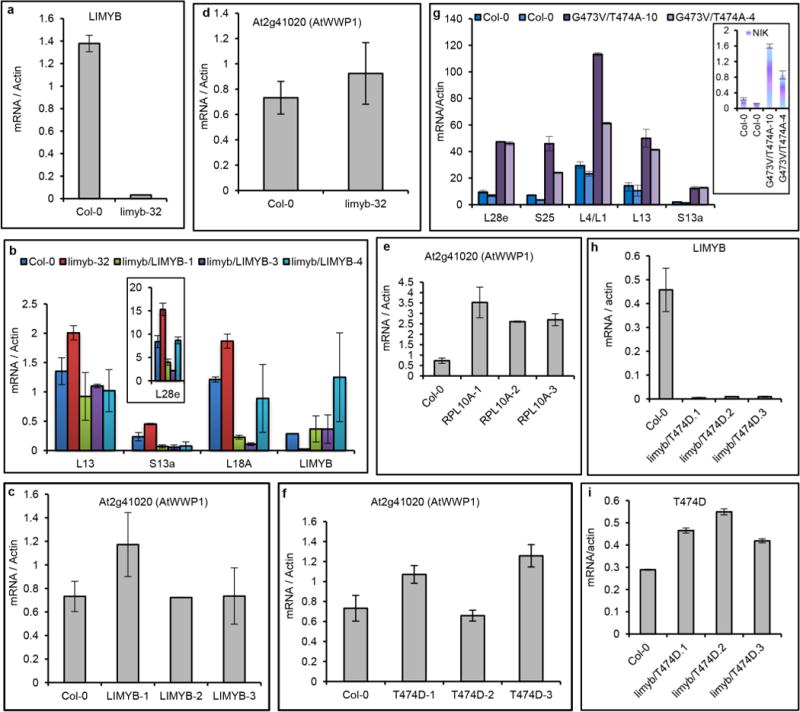
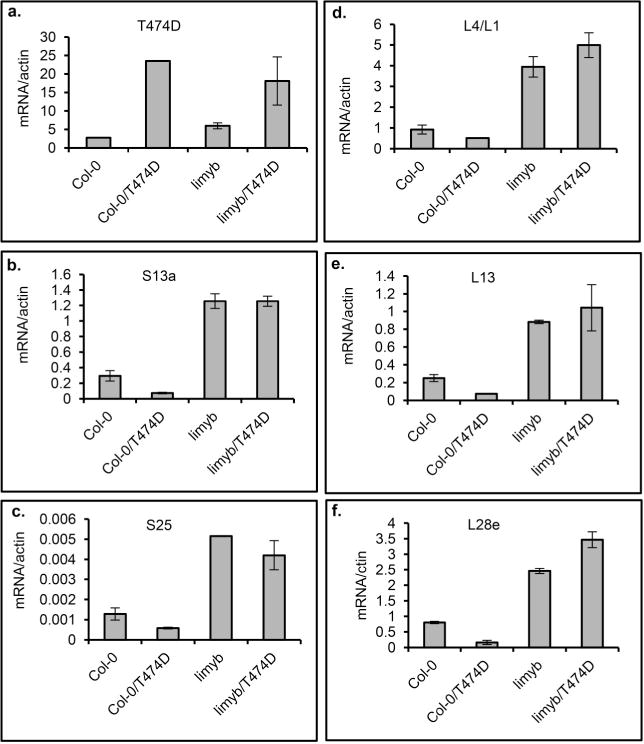
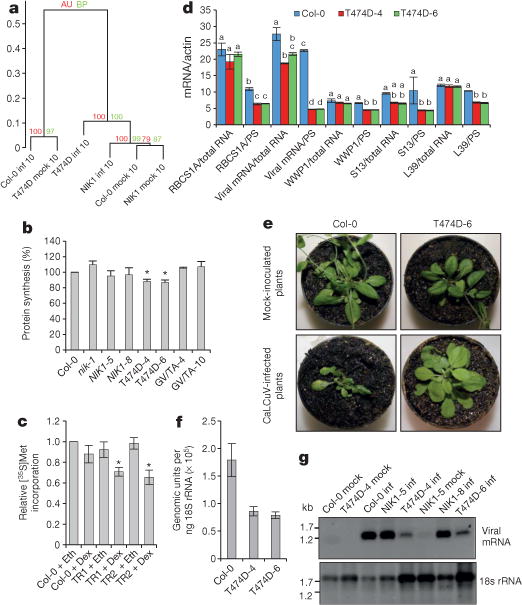
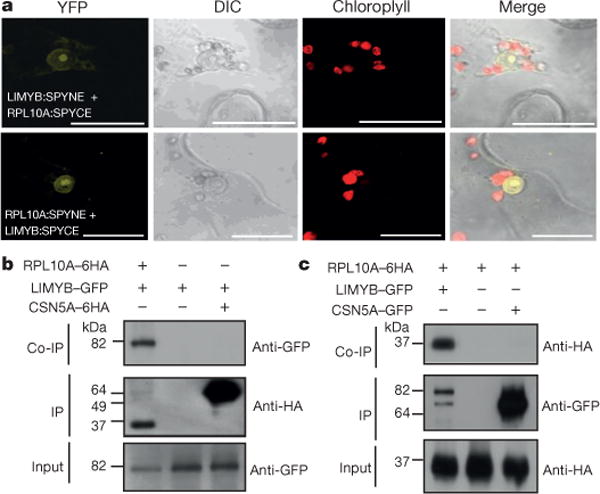
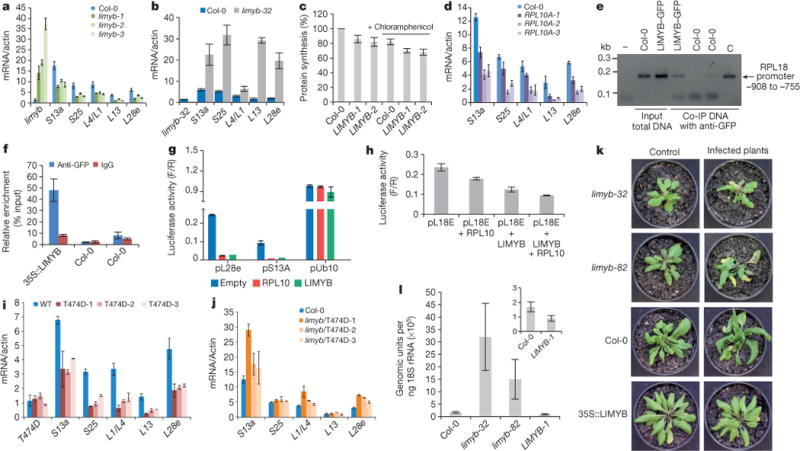
Plants and plant pathogens are subject to continuous co-evolutionary pressure for dominance, and the outcomes of these interactions can substantially impact agriculture and food security. In virus-plant interactions, one of the major mechanisms for plant antiviral immunity relies on RNA silencing, which is often suppressed by co-evolving virus suppressors, thus enhancing viral pathogenicity in susceptible hosts. In addition, plants use the nucleotide-binding and leucine-rich repeat (NB-LRR) domain-containing resistance proteins, which recognize viral effectors to activate effector-triggered immunity in a defence mechanism similar to that employed in non-viral infections. Unlike most eukaryotic organisms, plants are not known to activate mechanisms of host global translation suppression to fight viruses. Here we demonstrate in Arabidopsis that the constitutive activation of NIK1, a leucine-rich repeat receptor-like kinase (LRR-RLK) identified as a virulence target of the begomovirus nuclear shuttle protein (NSP), leads to global translation suppression and translocation of the downstream component RPL10 to the nucleus, where it interacts with a newly identified MYB-like protein, L10-INTERACTING MYB DOMAIN-CONTAINING PROTEIN (LIMYB), to downregulate translational machinery genes fully. LIMYB overexpression represses ribosomal protein genes at the transcriptional level, resulting in protein synthesis inhibition, decreased viral messenger RNA association with polysome fractions and enhanced tolerance to begomovirus. By contrast, the loss of LIMYB function releases the repression of translation-related genes and increases susceptibility to virus infection. Therefore, LIMYB links immune receptor LRR-RLK activation to global translation suppression as an antiviral immunity strategy in plants.


Conflict of interest statement

The authors declare no competing financial interests.

Figures

Extended Data Figure 1
Extended Data Figure 1. Characterization of the Arabidopsis transgenic lines
a, Phenotypes of wild-type (Col-0) and nik1 plants transformed with NIK1 (NIK1-5 and NIK1-8), T474D (T474D-4 and T474D-6) or the double-mutant G4743V/T474A (inactive kinase, GV/TA-10 and GV/TA-4). Transgenic plants (R2 generation, n = 15) were grown in soil at 22 °C under short day conditions and photographed 2 weeks after planting. b, T474D transcript accumulation in transgenic lines (R2 generation). The expression of T474D or NIK1 in the leaves of independent transgenic lines was monitored by quantitative RT–PCR. Mean ± 95% confidence intervals (n = 3) based on bootstrap resampling replicates of three independent experiments. c, Accumulation of T474D–GFP in transgenic lines. Total protein was extracted from the leaves of independent transgenic lines (as indicated), immunoprecipitated and immunoblotted with an anti-GFP antiserum. d, Chlorophyll content of transgenic lines. Total chlorophyll, chlorophyll a and chlorophyll b were determined in leaf sectors of the indicated transgenic lines. Error bars, 95% confidence intervals (n = 3) based on bootstrap resampling replicates of four independent experiments. e, Transcript accumulation of LIMYB in T-DNA insertion mutant lines. LIMYB expression was monitored by qRT–PCR of RNA prepared from Col-0, limyb-32 (SALk_032054) and limyb-82 (SALK_082995) plants. Gene expression was calculated using the 2−ΔCt method, and actin was used as an endogenous control. Error bars, 95% confidence intervals (n = 3) based on bootstrap resampling replicates of three independent experiments. f, Schematic representation of the At5g05800 (LIMYB) locus in the chromosome 5 and RNA sequencing data. The At5g05800 gene harbours three introns and four exons. Triangles show the positions of the T-DNA insertion in the limyb-32 and limyb-82 mutants, and the blue line indicates the position of the amplicon from e. The relative abundance of the mapped RNA hits in the At5g05800 locus is shown in red in limyb-32, black in Col-0 and green in limyb-82. The accumulation of LIMYB transcripts was much lower in limyb-32 and higher in limyb-82 than in Col-0. Sequencing of the limyb-32 and A-82 transcripts revealed unprocessed intron sequences and premature stop codons that would have prevented the translation of a functional protein in these mutant lines. Therefore, limyb-32 and limyb-82 were confirmed as loss-of-function limyb mutant lines. g, LIMYB transcript accumulation in LIMYB-overexpressing lines (R2 generation). LIMYB expression in the leaves of independent transgenic lines was monitored by quantitative RT–PCR. Error bars, 95% confidence intervals (n = 3) based on bootstrap resampling replicates of three independent experiments. h, General downregulation of translational machinery-related genes in LIMYB-1 seedlings. The ‘MA’ plots show the log of the ratio of the expression levels against log concentration, and each dot represents a gene. This plot visualizes the contrast of LIMYB-1 and Col-0 seedlings. The smear of points on the left side indicates those genes that were observed in only one group of replicated samples, and the red points denote ribosomal and protein synthesis-related genes. CPM, counts per million; FC, fold change; WT, wild type. i, RPL10 transcript accumulation in RPL10-overexpressing lines (R2 generation). The expression of an NLS-containing RPL10 transgene in the leaves of independent transgenic lines was monitored by quantitative RT–PCR. Error bars, 95% confidence intervals (n = 3) based on bootstrap resampling replicates of three independent experiments. j, Nuclear localization of the NLS-containing YFP–RPL10 fusion in transgenic lines. Root tips from transgenic seedlings expressing the NLS-containing YFP–RPL10 fusion were directly examined under a laser confocal microscope. The figure shows representative confocal images from five independent biological replicates.
Extended Data Figure 2
Extended Data Figure 2. Expression of immune-system-related genes in T474D-overexpressing lines and in LIMYB-overexpressing lines
a–c, On the basis of our global comparison of EST sequences (Fig. 1a) and the role of NIK as an antiviral receptor, we asked whether the constitutive activation of NIK would elicit a defence response similar to that induced by geminivirus infection via the salicylic acid pathway or typical defence responses to virus. No significant gene enrichment was detected in the virus-induced gene silencing (GO:0009616) and viral defence response (GO:0051607) categories using the gene set enrichment analysis (GSEA) method (Supplementary Table 2). For the immune system category, gene enrichment was found in both up- and downregulated changes using the GSEA method. However, the typical markers of salicylic acid signalling, such as PR1 and SNC1, were either non-differentially expressed or downregulated, and the expression of T474D did not enhance the salicylic acid level in the transgenic lines. Collectively, these results indicate that ectopic expression of T474D did not activate typical viral defences, such as salicylic acid signalling or gene silencing. a, b, Transcript accumulation of selected immune-system-related gene markers by RT–PCR (a) or RNA-sequencing in T474D-overexpressing lines (b). qRT–PCR of a representative sample confirmed an 80% match with the RNA-sequencing results. c, Transcript accumulation of the immune-system-related genes in LIMYB-overexpressing lines. The expression of the indicated genes in the leaves of independent transgenic lines was monitored by qRT–PCR. a, c, Mean ± 95% confidence intervals (n = 3) are shown, based on bootstrap resampling replicates of three independent experiments.
Extended Data Figure 3
Extended Data Figure 3. Ectopic expression of T474D-D downregulates translational-machinery-related genes and suppresses de novo protein synthesis
a, Representation of the translational-machinery-related genes differentially expressed in the T474D lines. The ‘MA’ plots show the log of the ratio of expression levels versus the log concentration, and each dot represents a gene. This plot represents the contrast between the T474D mock-inoculated lines and the Col-0 mock-inoculated lines. The red points denote ribosomal and protein synthesis-related genes (as shown in Supplementary Table 3). b, Downregulation of global translation by ectopic expression of T474D in Arabidopsis. The in vivo labelling of leaf proteins with [35S]Met was performed in 20-day-old Col-0 plants and T474D transgenic lines. The total protein extracts were fractionated by SDS–polyacrylamide gel electrophoresis (SDS– PAGE), and the radioactive bands were quantified by densitometric analysis of the images obtained by autoradiography. The labelling percentage was normalized to the leaf chlorophyll content, and the protein loading on the gel was adjusted to the Coomassie-stained band of the large subunit of rubisco. c, Induction of T474D expression by dexamethasone (DEX) in Arabidopsis transgenic seedlings. The constitutive expression of T474D was associated with stunted growth in the transgenic lines (Extended Data Fig. 1a) and repression of global protein synthesis (Fig. 1b). These phenotypes precluded the use of an appropriate normalization method for protein loading in comparative gels of contrasting genotypes to estimate precisely the T474D-mediated protein synthesis inhibition in our assay. To overcome this limitation, we used a dexamethasone-inducible promoter to control the T474D expression in the transgenic lines. Arabidopsis seedlings independently transformed with a T474D–GFP fusion under the control of a dexamethasone-inducible promoter (TR1 and TR2) were treated with 30 mM dexamethasone for 8 h, and the induction of T474D–GFP expression was monitored by semi-quantitative RT– PCR. The dexamethasone-induced expression of T474D for 8 h led to a higher inhibition of de novo protein synthesis in the transgenic lines, as measured by TCA-precipitable radioactivity, which could be normalized to total protein (TR1 and TR2; Fig. 1c). d, Inhibition of de novo protein synthesis by protein synthesis inhibitors in Col-0, untransformed lines. We also compared the T474D-mediated suppression of translation with known global translation inhibitors, such as the cytosolic protein synthesis inhibitors cycloheximide and puromycin and the chloroplast translation suppressor chloramphenicol. Arabidopsis seedlings (10 days old) were treated with 10 μM cycloheximide (Cyclo), 10 μM puromycin (Pur), 25 μM chloramphenicol (Chlor) or 30 μM dexamethasone (Dex) for the indicated periods of time, and then they were pulse labelled with L-[35S]Met for 60 min. Lysates of treated cells were measured by liquid scintillation counting and normalized to total protein. The relative [35S]Met incorporation was normalized to wild-type (WT = 1) control without treatment. Means ± 95% confidence intervals (n = 3) based on bootstrap resampling replicates of three independent experiments are shown. e, Inhibition of de novo protein synthesis by inducible expression of T474D. Seedlings (10 days old) from the TR1 transgenic line were treated with dexamethasone and the protein synthesis inhibitors for the times as indicated in the figure, and then they were pulse labelled with L-[35S]Met for 60 min. Lysates were processed as described in d. Means 6 95% confidence interval (n = 3) based on bootstrap resampling replicates of three independent experiments are shown. Cycloheximide was the most effective inhibitor of translation in both the wild-type and T474D-expressing lines. T474D expression inhibited global translation to the same extent as puromycin and caused a further inhibition in the level of chloramphenicol translational inhibition in a combined treatment. The increase in translational inhibition by combining T474D expression and chloramphenicol treatment may indicate that T474D inhibits cytosolic protein synthesis, which is consistent with the T474D-mediated downregulation of components of the cytosolic translational machinery (Supplementary Table 3).
Extended Data Figure 4
Extended Data Figure 4. Isolation of PS fractions from Arabidopsis seedlings and LIMYB-mediated inhibition of protein synthesis
a, Ultraviolet absorbance profiles of the sucrose gradient used for RNA fractionation of dexamethasone (Dex)-inducible T474D transgenic lines. Sixteen fractions of 310 ml were collected. NPS RNA includes complexes ≤ 80S that fractionated in the top half of the gradient (fractions 2–7) and PS (polysome) represents complexes fractionated in the bottom of the gradient (fractions 9–15). b, Distribution (%) of NPS and PS fractions on polysome density gradients. The percentage of NPS or PS was calculated by integrating the areas under the corresponding peaks in the A254nm profile delimited by a gradient baseline absorbance (buffer density). Values are the average ± standard deviation (s.d.) of three biological replicates. NPS and PS fractions from T474D + Dex samples were significantly different from the corresponding fractions of the T474D samples by the t-test (greater). NPS, *P value = 0.03725; PS, **P value = 0.009137 (t-test; greater). c, Relative RNA content in NPS and PS complexes. RNA was precipitated from NPS and PS density regions of sucrose gradients (as in a) and quantified. Relative NPS RNA and PS RNA contents from T474D and T474D + Dex samples were calculated in relation to the total NPS + PS content from T474D. Values for the relative NPS and PS RNA content are the average ± s.d. of three biological replicates and they were significantly different between the samples (P < 0.01, t-test). d, Distribution of specific mRNAs in the PS gradient fractions from extracts prepared from T474D seedlings treated (or not) with dexamethasone. The RNA on each fraction was reverse transcribed and aliquots amplified with specific primers for the indicated genes by qPCR. e, Ultraviolet absorbance profiles of the sucrose gradient used for the RNA fractionation of Col-0 seedlings. PSs from 15-day-old Col-0 seedlings were fractionated on a sucrose gradient, and the fractions were manually collected. f, Ultraviolet absorbance profiles of the sucrose gradient used for RNA fractionation from T474D seedlings. PSs from 15-day-old T474D-overexpressing seedlings were fractionated on a sucrose gradient, and the fractions were manually collected. g, Levels of the small subunit of rubisco (RBCS) mRNA per fraction. The levels of mRNA of RBCS were examined by northern blotting. This control was used to ensure the quality and distribution of a specific mRNA. h, Overexpression of LIMYB suppresses cytosolic translation. In vivo labelling of leaf proteins with [35S]Met was performed in Col-0 and LIMYB-1 transgenic seedlings in the presence and absence of chloramphenicol treatment. The total protein extracts were fractionated by SDS–PAGE, and the radioactive bands were quantified by densitometric analysis of the images obtained by autoradiography. The labelling percentage was normalized to the leaf chlorophyll content, and protein loading is shown by Coomassie staining of the radioactive gel.
Extended Data Figure 5
Extended Data Figure 5. Ectopic expression of T474D and LIMYB confers tolerance to begomovirus infection
a, Delayed onset of infection in the T474D-4- and T474D-6-overexpressing lines. Ecotype Col-0 plants, as well as the T474D-4- and T474D-6-overexpressing lines, and the NIK1-8 and G473V/T474A-overexpressing lines were infected with CaLCuV DNA by the biolistic method. The progression of the infection was monitored by PCR detection of viral DNA in the systemic leaves of the inoculated plants. The values represent the percentages of systemically infected plants at different dpi. Error bars, 95% confidence intervals (n = 3) based on bootstrap resampling replicates of four independent experiments. b, Upon symptom development, the T474D-induced transcriptome diverges from the infected Col-0 transcriptome. The mock-inoculated T474D-overexpressing lines exhibited a constitutively infected wild-type transcriptome at 10 dpi (Fig. 1a). Nevertheless, these T474D transgenic lines did not phenocopy the infected wild-type plants because they did not develop symptoms of viral infection. In fact, the wild-type plants displayed typical symptoms of CaLCuV infection at 21 dpi, such as leaf distortion, stunting with epinasty and chlorosis (Fig. 1e). The symptoms in the T474D-expressing lines at 21 dpi, however, were greatly attenuated, with no visible leaf distortion or chlorosis. To examine these phenotypes, we performed a Ward hierarchical clustering of the gene expression data (normalized by the trimmed mean of M-values (TMM) normalization method) from the Arabidopsis infection experiments at 21 dpi. The TMM normalization method assumes that the majority of genes are not differentially expressed, and it adjusts genes with larger read counts and lower variance on the logarithmic scale. The dendrogram provides two types of P values: AU (black) and BP (grey). The AU P value comes from multiscale bootstrap resampling, while the BP value represents normal bootstrap resampling. These P values were calculated by multiscale bootstrap resampling using the R-cran package pvclust with a cut-off of 0.05. These P values show the significance of the proximity of each gene expression experiment profile. The cluster analysis at 21 dpi indicated that when symptoms had developed in the infected Col-0 leaves, the T474D-induced transcriptome diverged from the infected Col-0 transcriptome. The mock T474D transcriptome formed a unique clade, while the infected T474D transcriptome was more closely related to the mock-inoculated Col-0 transcriptome. c, Reduced viral transcript accumulation in T474D-overexpressing lines at 21 dpi. RNA-sequencing data of viral gene transcripts in the systemic leaves of infected wild-type and T474D-overexpressing plants at 10 dpi and 21 dpi. d, The onset of infection is delayed in LIMYB-overexpressing lines. Ecotype Col-0 plants and LIMYB-overexpressing and limyb mutant lines were infected with CaLCuV DNA using the biolistic method. The progression of the infection was monitored by the PCR detection of viral DNA in the systemic leaves of the inoculated plants. The values represent the percentages of systemically infected plants at different dpi. Error bars, 95% confidence intervals (n = 3) based on bootstrap resampling replicates of four independent experiments.
Extended Data Figure 6
Extended Data Figure 6. LIMYB, which belongs to the MYB domain-containing superfamily, interacts with RPL10 in the yeast two-hybrid system
a, LIMYB and RPL10 interact in yeast. LIMYB was expressed in yeast as a GAL4 activation domain (AD) fusion (pAD–LIMYB), and RPL10 was expressed as a GAL4 binding domain (BD) fusion (pBD–RPL10). The interactions between the tested proteins were examined by monitoring His prototrophy. b, The interactions were further confirmed by measuring the expression activity of the β-galactosidase reporter enzyme for the second reporter gene, β-galactosidase. The interaction between pAD–RPL10 and pBD–NIK1 was monitored as a positive control. Means ± 95% confidence intervals (n = 3) based on bootstrap resampling replicates of three technical replicates are shown. c, LIMYB harbours two MYB domains. The position of these MYB domains is indicated in the schematic representation of the LIMYB primary structure. d, Sequence identity of the closest related LIMYB (At5g05800) homologues. e, Dendrogram of MYB domain-containing proteins from Arabidopsis. The MYB family sequences were retrieved from the Agris database (http://arabidopsis.med.ohio-state.edu). The alignment was performed by Maft aligner software using full-length sequences, and the tree was built by Fasttree software (the bootstrap values are indicated close to the branch divisions). The arrow indicates LIMYB (At5g05800). f, g, The negative controls used in the BiFC analysis. f, Confocal fluorescent image of SPYNE + LIMYB:SPYCE, LIMYB:SPYNE + SPYCE, SPYNE + RPL10:SPYCE and RPL10:SPYNE + SPYCE, as indicated in the figure. We used a BiFC assay to determine whether RPL10 and LIMYB interact in the nuclei of plant cells. The formation of a RPL10–LIMYB complex occurred in the nuclei of transfected cells independent of the orientation of the LIMYB or RPL10 fusions (amino terminus or carboxy terminus of YFP; Fig. 2a), and the reconstituted fluorescent signal was much higher than that of the background (control panels with combinations of the protein fusions with empty vectors). The figure displays representative samples from three independent biological repeats. Scale bars, 20 μm. g, The C-terminal (SPYCE) and N-terminal region (SPYNE) of YFP accumulates detectably in co-transfected leaves. Total protein extracts from leaves co-transfected with the indicated constructs were immunoblotted with anti-YFP serum. The arrow indicates the position of RPL10–SPYCE and RPL10–SPYNE fusions, and arrowheads indicate the positions of the C-terminal (SYYCE) and N-terminal (SPYNE) regions of YFP.
Extended Data Figure 7
Extended Data Figure 7. Nuclear localization of LIMYB
a, Colocalization of LIMYB with the nuclear marker gene Glycine max (Gm)NAC81. N. benthamiana leaves were co-infiltrated with A. tumefaciens carrying a 35S∷LIMYB–GFP construct and a 35S∷YFP–GmNAC81 construct. Forty-eight hours after infiltration, the subcellular localizations of the fluorescent fusion proteins were examined by confocal microscopy. The figure shows representative confocal images from two independent experiments. b, Confocal fluorescence image of transiently expressed GFP (left) or LIMYB–GFP (right) in epidermal cells of tobacco leaves. Scale bars, 10 μm. The figure shows representative confocal images from two independent experiments. c, Immunoblotting of transiently expressed LIMYB–GFP in epidermal cells of tobacco leaves. Total protein was extracted from agro-infiltrated N. benthamiana leaves containing the 35S∷GFP (left lanes) or 35S∷LIMYB–GFP (right lanes) constructs and immunoblotted with an anti-GFP monoclonal antibody to examine the stability of the fusion protein. The positions of molecular mass are shown in kDa. d, Confocal fluorescence image of transiently expressed GFP–LIMYB in epidermal cells of tobacco leaves. Scale bars, 10 μm. The figure shows representative confocal images from four independent experiments. e, Confocal fluorescence image of transiently expressed LIMYB– GFP in epidermal cells of tobacco leaves. Scale bars, 10 μm. The figure shows representative confocal images from four independent experiments. f, g, Confocal fluorescence image of root cells stably transformed with YFP– LIMYB or LIMYB–GFP. Root tips from transgenic seedlings expressing YFP–LIMYB (f) or LIMYB–GFP (g) were directly examined under a laser confocal microscope. Scale bars, 20 μm. The figures show representative confocal images from three biological replicas. Neither the fusion of YFP to the LIMYB N terminus nor GFP to its C terminus altered the nuclear localization of LIMYB in either agro-inoculated N. tabacum leaves or stably transformed Arabidopsis roots. h, i, Confocal fluorescent image of LIMYB fused to GFP or mCherry under the control of its own promoter. The figures show representative confocal images from two independent experiments. The fluorescence was also concentrated in the nucleus of transfected cells by expression of LIMYB–GFP or LIMYB–mCherry fusions under the control of the LIMYB endogenous promoter. Scale bars, 20 μm. Collectively, these results indicate that LIMYB was localized in the nucleus.
Extended Data Figure 8
Extended Data Figure 8. LIMYB, RPL10 and NIK1 display overlapping expression profiles
a, pLIMYB∷GUS, pRPL10∷GUS and pNIK1∷GUS are ubiquitously expressed in seedling tissues. GUS reporter gene expression was histochemically monitored in 2-week-old seedling leaves and roots from transgenic lines harbouring a β-glucuronidase (GUS) reporter gene expressed from the LIMYB, RPL10 and NIK1 promoters. The figure shows representative GUS staining images of three seedlings per genotype. All three genes were ubiquitously expressed in all seedling tissues. b, Expression analysis of LIMYB in various plant organs. LIMYB expression was monitored by qRT–PCR of RNA prepared from leaves, roots, stems or flowers of Col-0 plants. Gene expression was calculated using the 2−ΔCt method, and actin was used as an endogenous control. Error bars, 95% confidence intervals (n = 3) based on bootstrap resampling replicates of three independent experiments. LIMYB was also expressed in the leaves, roots, stems and flowers, indicating that LIMYB, RPL10 and NIK1 are co-expressed in several organs.
Extended Data Figure 9
Extended Data Figure 9. Controls for the regulation of RP gene expression experiments
a–i, Expression of the indicated genes in the leaves of independent transgenic lines was monitored by qRT–PCR. a, LIMYB expression in the limyb-32 mutant was examined. b, LIMYB expression in limyb-32 mutant restores wild-type expression of the RP genes. Expression of the S13a, L18A and L28e genes was monitored in three independently transformed limyb-32 knockout plants with the LIMYB gene. c–f, Expression of the unrelated gene AtWWP1 was monitored as a negative control in three independently transformed LIMYB-, RPL10- and T474D-overexpressing lines in addition to the limyb-32 mutant. g, The double-mutant inactive kinase, G4743V/T474A, does not downregulate the RP genes. The transcript accumulation of the indicated RP genes was quantified by qRT–PCR in two independently transformed nik1 knockout lines expressing the G4743V/T474A double mutant. h, i, Expression of LIMYB (h) and the transgene T474D (i) was monitored in the limyb-32 lines, which were transformed with T474D. a–i, Means ± 95% confidence intervals (n = 3) based on bootstrap resampling replicates of three independent experiments are shown.
Extended Data Figure 10
Extended Data Figure 10. T474D requires LIMYB function to mediate the downregulation of translational machinery-related genes
a–f, A 35S∷T474D–GFP construct was electroporated into protoplasts prepared from Col-0 and limyb-32 seedlings, and the expression of the indicated RP genes was monitored by qRT–PCR of RNA prepared from untransfected and transfected protoplasts. Gene expression was calculated using the 2−ΔCt method, and actin and ubiquitin were used as an endogenous control. Means ± 95% confidence intervals (n = 3) based on bootstrap resampling replicates of three independent experiments are shown.
Figure 1
Figure 1. Constitutive activation of the NIK1 receptor suppresses global host translation and confers tolerance to begomovirus
a, Ward hierarchical clustering of the gene expression data from the Arabidopsis infection experiments at 10 dpi. The dendrogram provides two types of P values: approximately unbiased (AU; red) and bootstrap probability (BP; green). inf, infected plants; mock, mock-inoculated plants. b, Global translation suppression by T474D expression. In vivo labelling of leaf proteins with [35S]Met was performed in Col-0 and transgenic seedlings. The labelling percentage was also normalized to the leaf chlorophyll content (Extended Data Fig. 1d). Estimated proportion (in %) with respective error bars showing standard error of the mean (s.e.m.) from three independent experiments (n = 3). Asterisks indicate that the proportion is significantly (P < 0.05) different from 100% using the one-sided (less) chi-squared test. GV/TA, G473V/T474A double-mutant lines. c, Inhibition of global translation upon induction of T474D expression. An oestrogen-receptor-based chemical-inducible system was used to induce T474D expression in Arabidopsis seedlings, which were treated with 10 μM dexamethasone (Dex) or ethanol (Eth) for 8 h, and then were pulse labelled with L-[35S]Met for 1 h. Tricarboxylic acid (TCA)-precipitable radioactivity in each sample was normalized to Col-0 + ethanol. Estimated proportion with respective error bars showing s.e.m. from three independent experiments (n = 3). Asterisks indicate that the proportion is significantly (*P < 0.05) different from 1 using the one-sided (less) chi-squared test. TR1 and TR2 are independently transformed lines harbouring T474D under the control of the dexamethasone-inducible promoter. d, Quantitation of total and PS-associated viral replication initiator protein (Rep) and host transcripts by qRT–PCR. The two-way analysis of variance (ANOVA) results were sliced by RNA fractions (total and PS). Different letters indicate significant differences among the RNA levels of the same gene by the TukeyHSD test (P < 0.01). mRNA/actin, mRNA of the gene normalized to actin mRNA. e, Symptoms associated with CaLCuV infection in wild-type and transgenic lines at 21 dpi. The figure shows representative samples from three independent experiments, each one with ten plants (biological replicates). f, Absolute quantitation of CaLCuV genomic units in infected lines at 14 dpi. An 18S ribosomal RNA (rRNA) target was run in parallel for normalizing the template load per reaction. Error bars, 95% confidence intervals based on bootstrap resampling replicates of four independent (n = 4) experiments. g, PS loading of viral mRNA in systemically infected leaves. PS-bound RNA was probed with viral Rep complementary DNA and 18S rDNA.
Figure 2
Figure 2. LIMYB interacts with RPL10 in the nucleus
a, In vivo interaction between LIMYB and RPL10 by bimolecular fluorescence complementation (BiFC) analysis. The fluorescence (yellow fluorescent protein (YFP)) images were acquired using Nicotiana tabacum leaves co-expressing the 35S∷RPL10-SPYNE + 35S∷LIMYB-SPYCE and 35S∷RPL10-SPYCE + 35S∷LIMYB-SPYNE fusion proteins. They are representative samples from three independent biological repeats. Scale bars, 20 μm. DIC, differential interference contrast. b, LIMYB and RPL10 interaction in planta. The indicated constructs were expressed in N. tabacum leaves, and co-immunoprecipitation (Co-IP) assays were performed using an anti-haemagglutinin (HA) antibody. CSN5A is an unrelated protein used as a negative control. c, Co-immunoprecipitation assay was performed using an anti-GFP antibody.
Figure 3
Figure 3. LIMYB links NIK1 activation to the downregulation of RP genes and confers tolerance to begomovirus
a, LIMYB overexpression downregulates RP genes. RP gene expression was monitored by qRT–PCR of RNA from LIMYB-overexpressing leaves and Col-0. b, Induction of RP genes in the limyb-32 mutant, monitored as in a. c, LIMYB overexpression suppresses global host translation. Col-0 and LIMYB-overexpressing seedlings were labelled with [35S]Met in the presence and absence of chloramphenicol, as described in Fig. 1b. d, RPL10 downregulates RP genes, monitored as in a. e, LIMYB binds to the RPL18e promoter in vivo. ChIP assay was performed with LIMYB–GFP-expressing leaves or wild type using anti-GFP antibodies. The co-immunoprecipitated (Co-IP) 150-bp fragment of the RPL18 promoter was detected by PCR. C, amplification of the control plasmid. f, ChIP-qPCR assay of 35S:LIMYB–GFP transgenic and wild-type (Col-0) seedlings. Samples were immunoprecipitated with anti-GFP antibody or IgG antibody. ChIP DNA was quantified with real-time PCR. g, LIMYB or RPL10 repress the RP promoter. N. benthamiana leaves were agro-infiltrated with plasmids carrying the prL28e-luciferase (pL28e), prS23A-luciferase (pS13A) or prUb10-luciferase (pUb10) genes in combination with either the 35S∷LIMYB or 35S:RPL10 DNA constructs. Luciferase activity was measured 48 h after agro-infiltration. F/R, firefly luciferase activity to Renilla activity ratio. h, LIMYB and RPL10 determine the full transcriptional repression of the RP promoter. N. benthamiana leaves were agro-infiltrated with the indicated combination of DNA constructs and luciferase activity was measured 48 h after infiltration. i, Downregulation of RP genes in T474D-expressing lines, monitored as in a. j, T474D requires the function of LIMYB to mediate RP gene suppression. The limyb-32 (limyb) mutant was transformed with 35S∷T474D, and the expression of RP genes was monitored as described in a. k, Symptoms associated with CaLCuV infection in Col-0 plants, the LIMYB-overexpressing line and limyb mutants at 21 dpi. Representative samples from three independent experiments, each one with ten plants (biological replicates). l, Absolute quantitation of CaLCuV genomic units in infected LIMYB-overexpressing lines and limyb mutants. Viral accumulation was determined by quantitative PCR at 14 dpi, as described in Fig. 1f. ad, fj, l, The respective 95% confidence interval limits were estimated based on bootstrap resampling replicates of three independent (n = 3) experiments and two technical repeats, except that in g, n = 2 with two technical repeats.

Comment in

References

    1. Pumplin N, Voinnet O. RNA silencing suppression by plant pathogens: defence, counter-defence and counter-counter-defence. Nature Rev Microbiol. 2013;11:745–760. - PubMed
    1. Mandadi KK, Scholthof KB. Plant immune responses against viruses: how does a virus cause disease? Plant Cell. 2013;25:1489–1505. - PMC - PubMed
    1. Jones JD, Dangl JL. The plant immune system. Nature. 2006;444:323–329. - PubMed
    1. Hanley-Bowdoin L, Bejarano ER, Robertson D, Mansoor S. Geminiviruses: masters at redirecting and reprogramming plant processes. Nature Rev Microbiol. 2013;11:777–788. - PubMed
    1. Santos AA, Lopes KVG, Apfta JAC, Fontes EPB. NSP-interacting kinase, NIK: a transducer of plant defence signalling. J Exp Bot. 2010;61:3839–3845. - PubMed

Publication types

MeSH terms

Substances

Associated data