. 2015 Mar 5;519(7541):45-50.
doi: 10.1038/nature14260. Epub 2015 Feb 18.

Hypothalamic POMC neurons promote cannabinoid-induced feeding

Affiliations

Hypothalamic POMC neurons promote cannabinoid-induced feeding

Marco Koch et al. Nature. .

Abstract

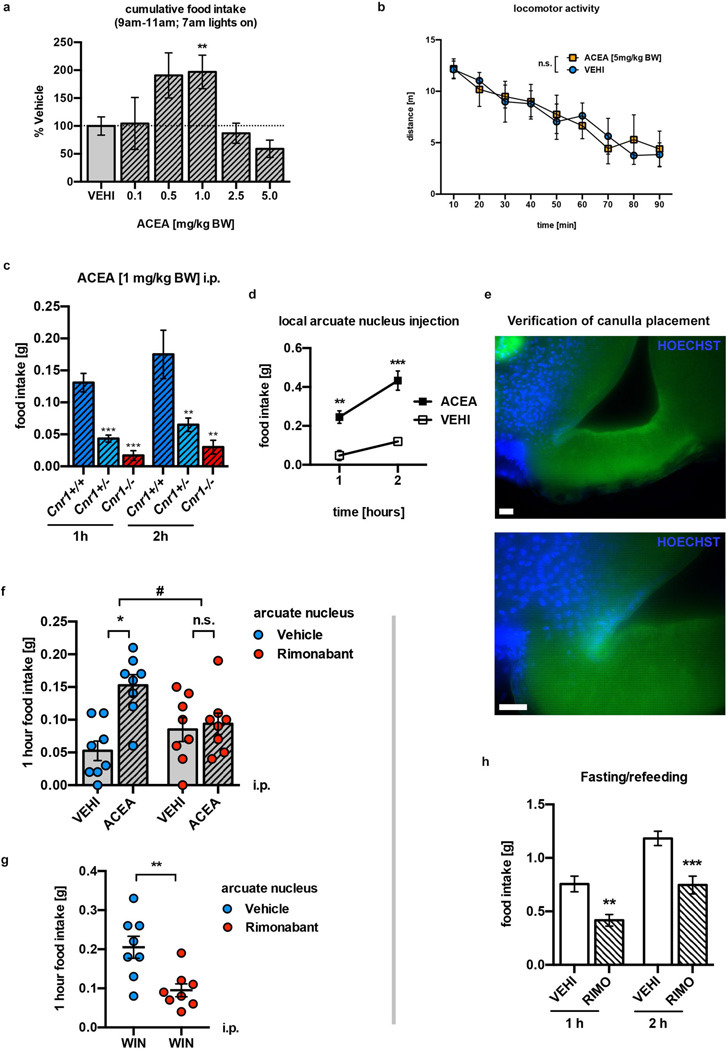
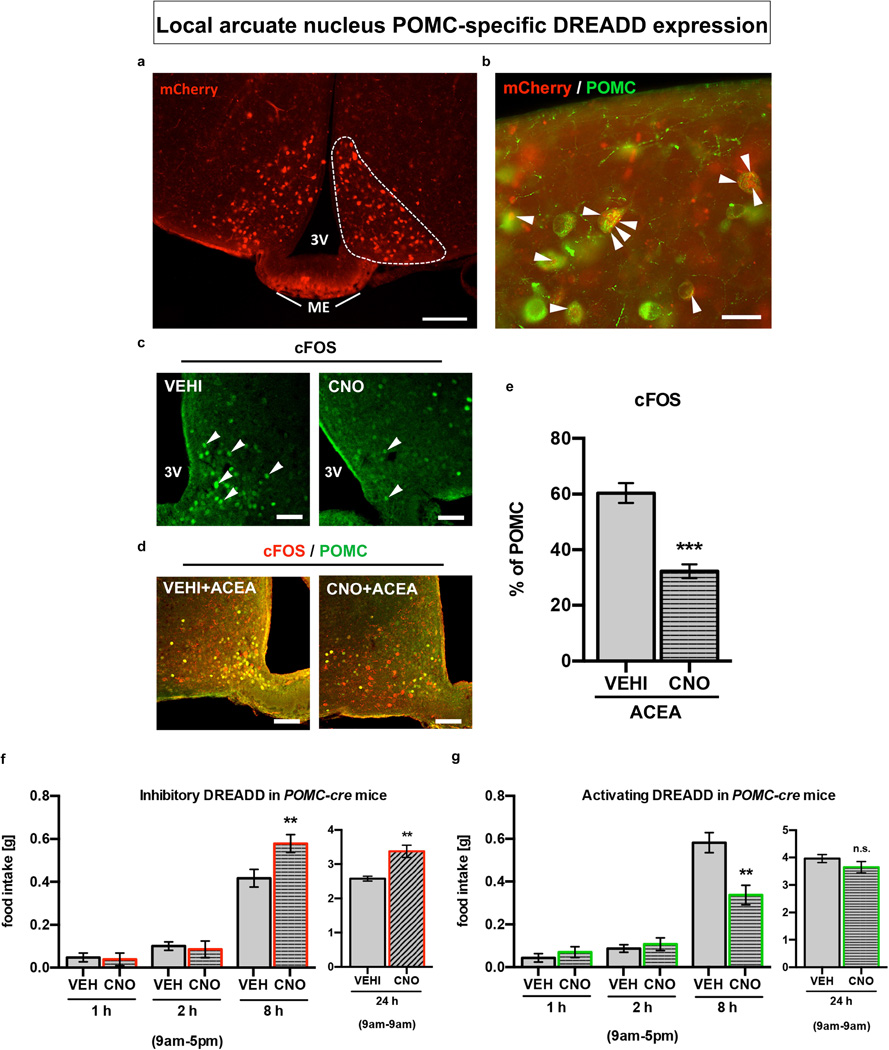
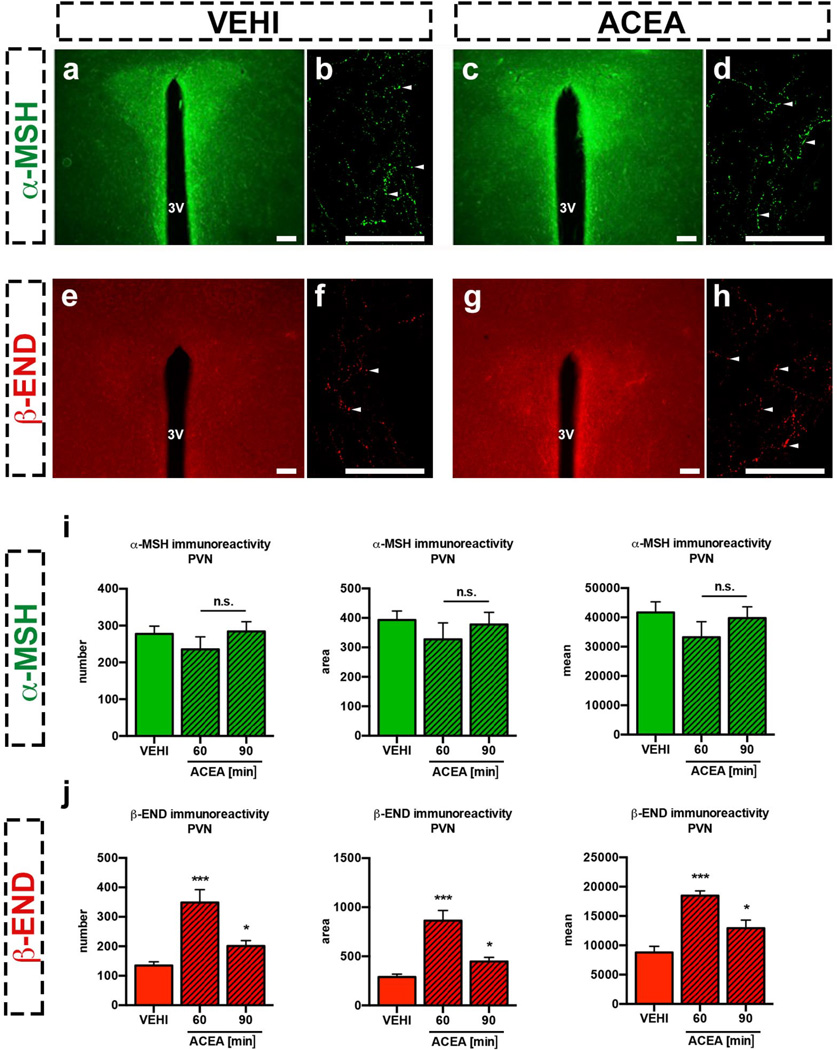
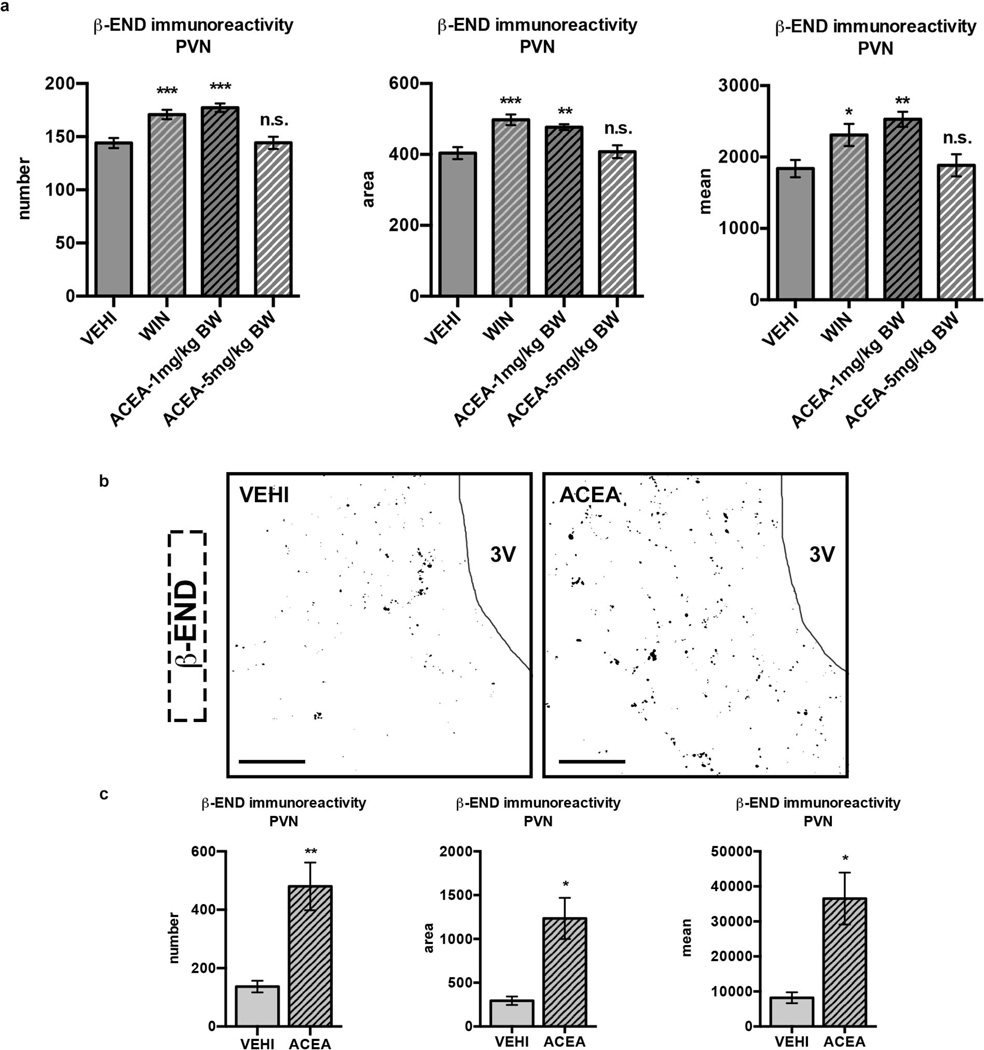
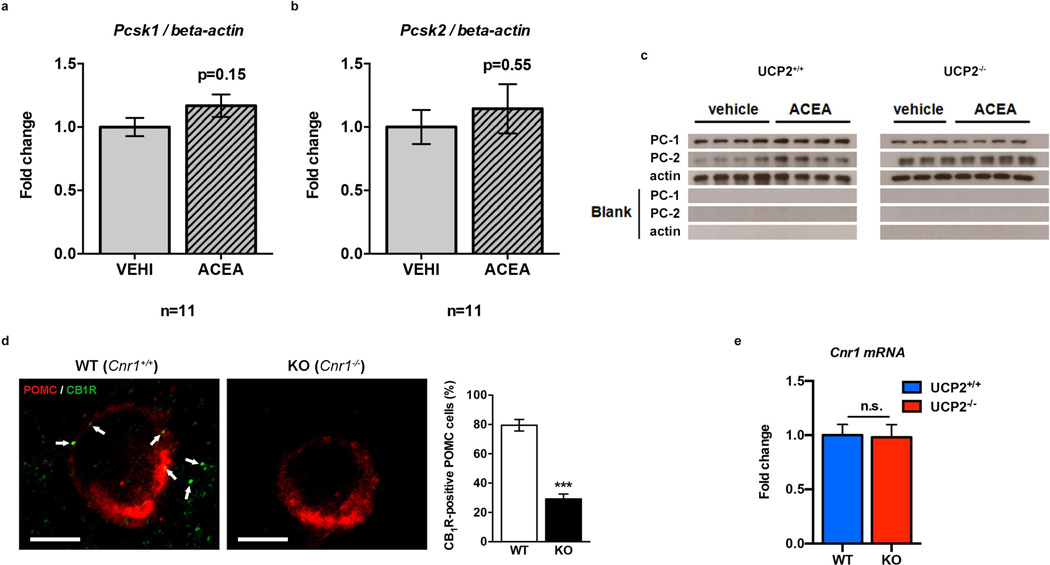
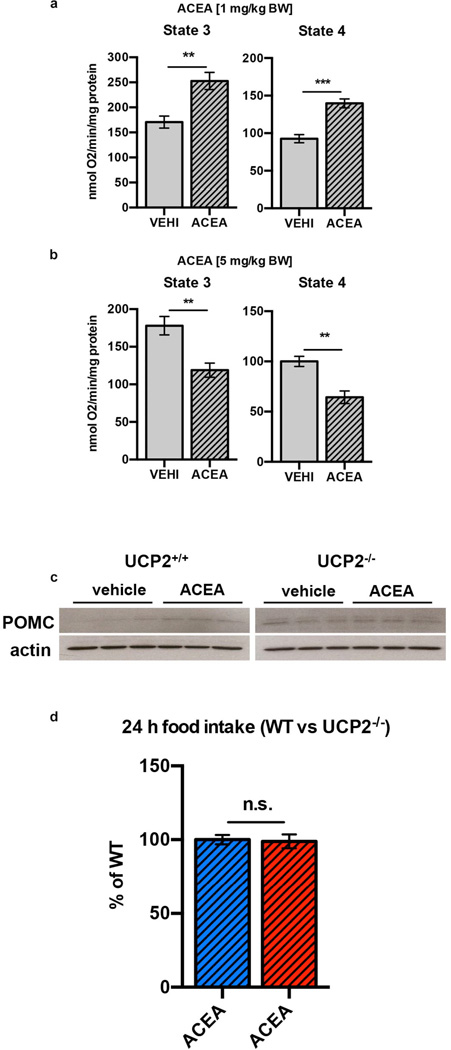
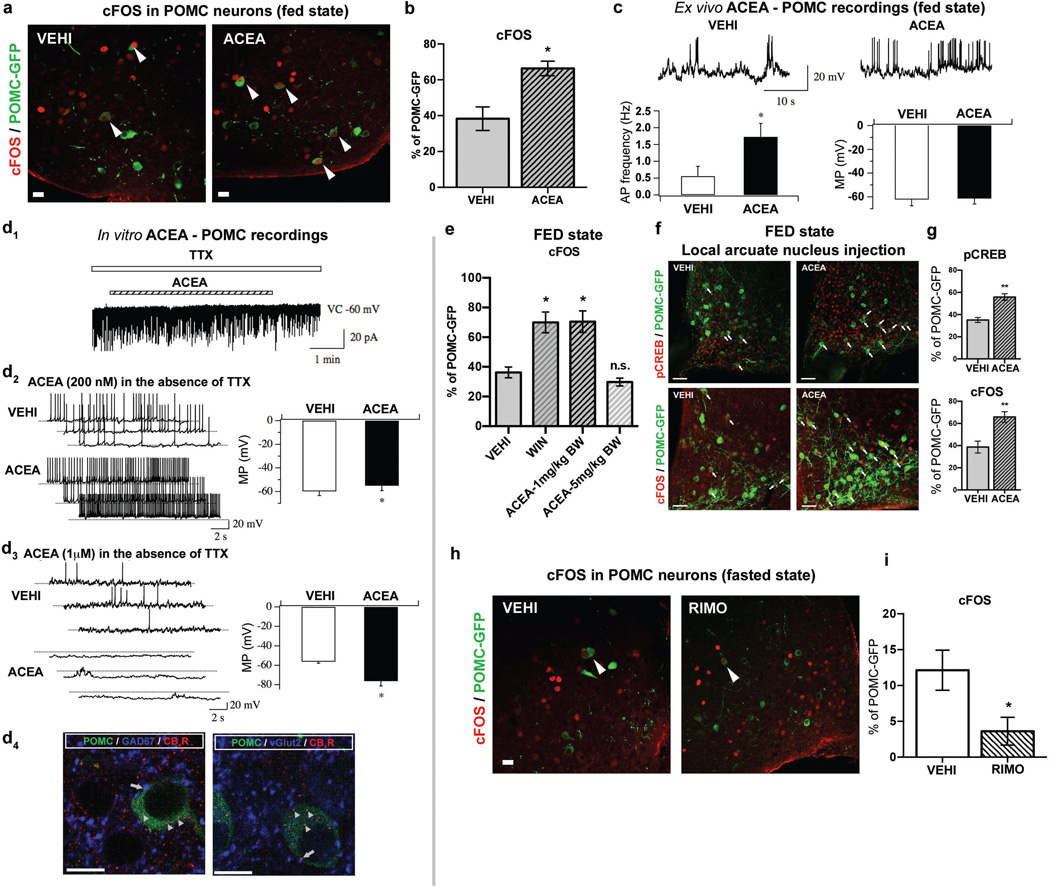
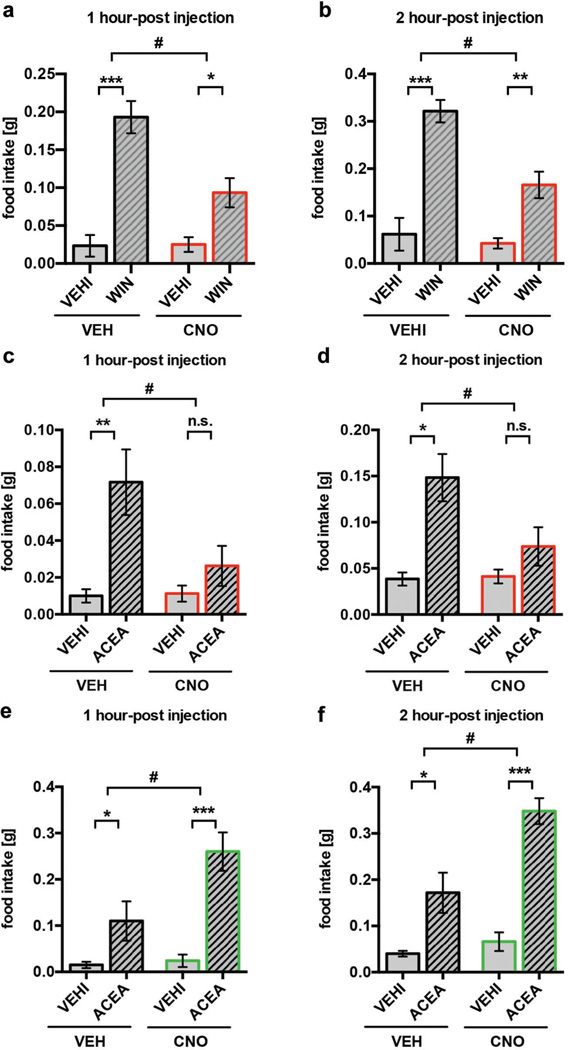
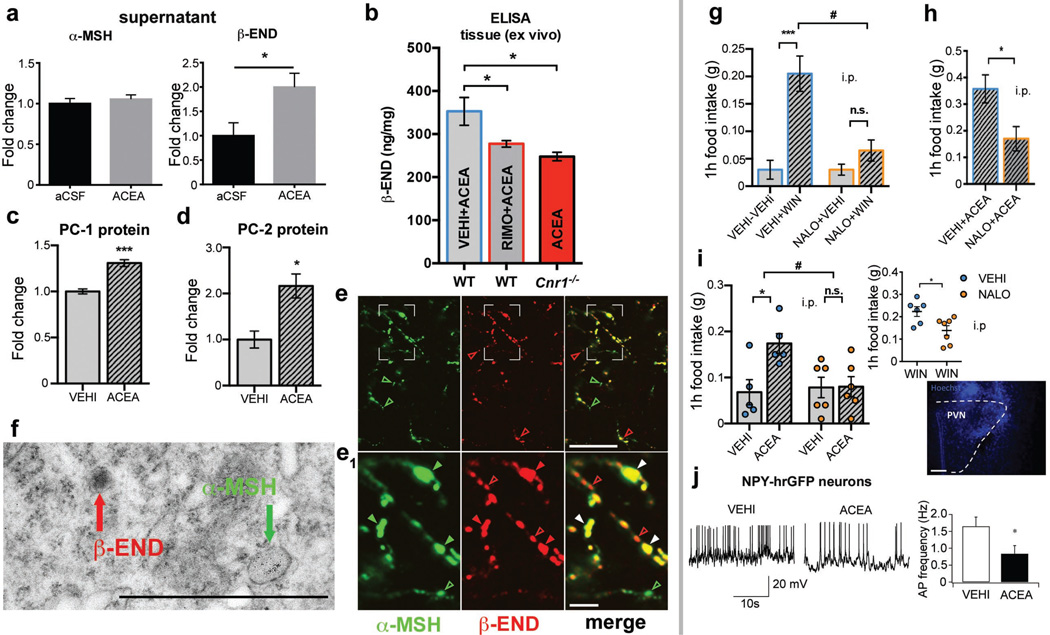
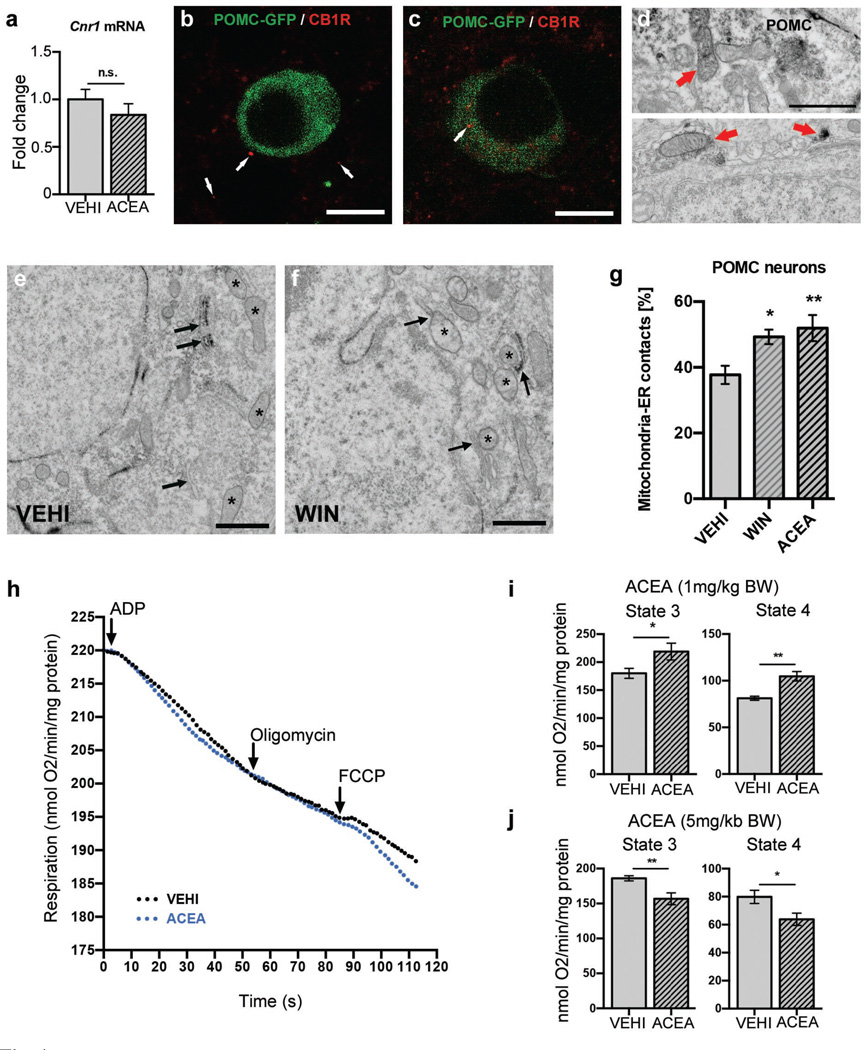
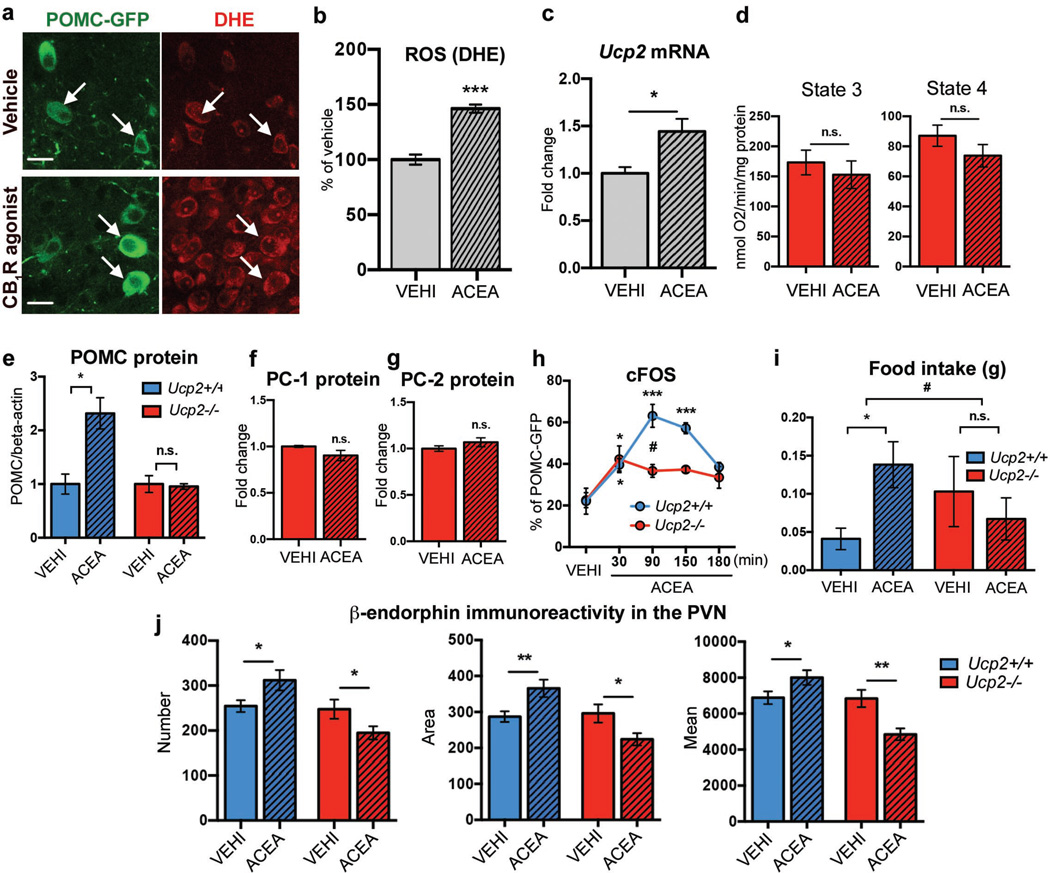
Hypothalamic pro-opiomelanocortin (POMC) neurons promote satiety. Cannabinoid receptor 1 (CB1R) is critical for the central regulation of food intake. Here we test whether CB1R-controlled feeding in sated mice is paralleled by decreased activity of POMC neurons. We show that chemical promotion of CB1R activity increases feeding, and notably, CB1R activation also promotes neuronal activity of POMC cells. This paradoxical increase in POMC activity was crucial for CB1R-induced feeding, because designer-receptors-exclusively-activated-by-designer-drugs (DREADD)-mediated inhibition of POMC neurons diminishes, whereas DREADD-mediated activation of POMC neurons enhances CB1R-driven feeding. The Pomc gene encodes both the anorexigenic peptide α-melanocyte-stimulating hormone, and the opioid peptide β-endorphin. CB1R activation selectively increases β-endorphin but not α-melanocyte-stimulating hormone release in the hypothalamus, and systemic or hypothalamic administration of the opioid receptor antagonist naloxone blocks acute CB1R-induced feeding. These processes involve mitochondrial adaptations that, when blocked, abolish CB1R-induced cellular responses and feeding. Together, these results uncover a previously unsuspected role of POMC neurons in the promotion of feeding by cannabinoids.


Figures

Extended Data Fig. 1
Extended Data Fig. 1. Characterization of CB1R-dependent food intake
a Bimodal effects of different ACEA doses on food intake in fed mice (VEHI, n=23 mice, 100±16.3%; ACEA (in mg/kg BW, i.p.): 0.1, n=8, 104.5±46.6%; 0.5, n=3, 190.8±40.4%; 1.0, n=19, 196.7±30%; 2.5, n=16, 87.1±18%; 5.0, n=11, 59.2±15.5%; * P<0.05 vs. VEHI, P values by ordinary one-way ANOVA, followed by Dunett’s multiple comparisons test). b Neutral dose of ACEA on feeding (5 mg/kg BW, i.p.) did not alter locomotor activity of fed mice (n.s. P>0.05). c Impaired feeding response to ACEA (1 mg/kg BW, i.p.) in CB1R-heterozygote (Cnr1+/−, n=6 mice, 1 h: 0.04±0.01 g, 2 h: 0.07±0.01 g) and CB1R-deficient (Cnr1−/−, 1 h: n=6, 0.02±0.01 g, 2 h: n=4, 0.03±0.01 g) mice, when compared to CB1R-WT mice (Cnr1+/+, 1 h: n=12, 0.13±0.01 g, 2 h: n=4, 0.18±0.04 g; *** P<0.001, ** P<0.01 vs. Cnr1+/+, respectively). d Central, local ACEA injection into the ARC induced food intake (VEHI, n=4 mice, 1 h: 0.05±0.03 g, 2 h: 0.12±0.01 g; ACEA, n=4, 1 h: 0.25±0.03 g; 2 h: 0.43±0.05 g; ** P<0.01, *** P<0.001). e Verification of correct ARC cannula placement by HOECHST (blue) injection. f Hyperphagic CB1R activation (1 mg/kg BW ACEA, i.p.) was abolished by central, local ARC RIMO-mediated CB1R blockade (VEHI+VEHI, n=8 mice, 0.05±0.01 g; VEHI+ACEA, n=8, 0.15±0.02 g; RIMO+VEHI, n=8, 0.09±0.02 g; RIMO+ACEA, n=8, 0.09±0.02 g; * P<0.001, n.s. P>0.05, # P<0.05 for interaction between RIMO and ACEA, P values by ordinary two-way ANOVA, followed by Sidak’s multiple comparisons test). g Hyperphagic CB1R activation (1 mg/kg BW WIN, i.p.) was reduced by local ARC RIMO-mediated CB1R blockade (VEHI+WIN, n=8 mice, 0.21±0.03 g; RIMO+WIN, n=8, 0.1±0.02 g; ** P<0.01). h RIMO-induced hypophagic blockade of CB1R in fasted mice (VEHI, n=10 mice, 1 h: 0.76±0.07 g, 2 h: 1.18±0.07 g; RIMO, n=11 mice, 1 h: 0.42±0.05 g, 2 h: 0.75±0.08 g; ** P<0.01, *** P<0.001). All quantified results ± s.e.m. If not otherwise stated, P values (unpaired comparisons) by two-tailed Student’s t-test. Scale bars; 25 µm.
Extended Data Fig. 2
Extended Data Fig. 2. DREADD-mediated regulation of POMC neurons
a Selective DREADD expression specified by local ARC mCherry fluorescence. b POMC neurons (green) contain mCherry-labeled DREADD (red, arrowheads). c CNO-activated inhibitory DREADD reduced ARC cFOS immunolabeled neurons in fed mice (arrowheads). d, e CNO-activated inhibitory DREADD blocked ACEA-induced POMC activation (cFOS; VEH+ACEA, n=6 mice, 60.4±3.6%; CNO+ACEA, n=5, 32.3±2.5%). f CNO-activated POMC-specific inhibitory DREADD did not acutely affect feeding but enhanced it after 8 hours (VEH, n=17 mice, 0.42±0.04 g; CNO, n=16, 0.58±0.04 g; 24 hours-post injection: VEH, n=5 mice, 2.57±0.07 g; CNO, n=5, 3.37±0.18 g; ** P<0.01 vs. VEH, respectively). g CNO-activated POMC-specific stimulating DREADD did not acutely affect feeding but reduced it after 8 hours (VEH, n=6 mice, 0.58±0.05 g; CNO, n=6, 0.34±0.05 g; ** P<0.01 vs. VEH; 24 hours-post injection: VEH, n=6 mice, 3.96±0.15 g; CNO, 3.65±0.21 g; n.s. P>0.05 vs. VEH). All quantified results ± s.e.m. If not otherwise stated, P values (unpaired comparisons) by two-tailed Student’s t-test.
Extended Data Fig. 3
Extended Data Fig. 3. Hyperphagic CB1R activation selectively increased PVN β-endorphin
a–d, i PVN α-MSH remained unchanged after hyperphagic CB1R activation (PVN unilateral analysis; VEHI, n=6 values/6 sections/3 mice; 60 min ACEA, n=10/10/5; 90 min ACEA, n=6/6/3; values, see Extended Data Table 1a). e–h, j In contrast, hyperphagic ACEA increased PVN β-endorphin (β-END) 60 and 90 min following application (PVN unilateral analysis; VEHI, n=13 values/13 sections/6 mice; 60 min ACEA, n=4/4/4; 90 min ACEA, n=14/14/7; values, see Extended Data Table 1b; *** P<0.001, * P<0.05 vs. VEHI, P values by one-way ANOVA, followed by Dunnett’s multiple comparisons test). Scale bars; 25 µm.
Extended Data Fig. 4
Extended Data Fig. 4. Bimodal character of ARC CB1R-driven β-endorphin increase
a Compared to VEHI (bilateral PVN analysis; n=22 values/11 sections/4 mice), hyperphagic doses (1 mg/kg BW, respectively) of WIN (n=24/12/4) or ACEA (n=18/9/3) induced PVN β-endorphin immunoreactivity. Neutral dose (5 mg/kg BW) of ACEA (n=18/9/3) on feeding showed no effects (all values, see Supplementary Data Table 2). b Representative binary images of β-endorphin immunoreactivity after thresholding (image segmentation) using imagej software (for more details, see methods). c Compared to VEHI (unilateral PVN analysis; n=4 mice, 2–3 section/mouse), central, hyperphagic local ARC injection of ACEA (n=5 mice, 3 sections/mouse) increased PVN β-endorphin immunoreactivity (all values, see Supplementary Data Table 3). All quantified results ± s.e.m. If not otherwise stated, P values (unpaired comparisons) by two-tailed Student’s t-test. Scale bars; 100 µm.
Extended Data Fig. 5
Extended Data Fig. 5. Post-transcriptional regulation of hypothalamic pro-protein convertases, presence of CB1R in POMC neurons and Cnr1 expression in Ucp2−/− mice
a, b ACEA did not affect transcripts of pro-protein convertases 1 (Pcsk1) and 2 (Pcsk2) (in fold change; Pcsk1: VEHI, n=11 mice, 1.00±0.07; ACEA, n=10 mice, 1.17±0.09; Pcsk2: VEHI, n=11 mice, 1.00±0.13; ACEA, n=11 mice, 1.14±0.19; n.s. P>0.05). c Representative Western Blot membranes for PC-1 (~80 kDa) and PC-2 (~72 kDa) immunolabeling. d Equal Cnr1 expression in WT and UCP2−/− mice (in fold change: all groups n=6 mice; WT, 1.00±0.1; UCP2−/−, 0.98±0.12; n.s. P>0.05). e We have previously shown that antibodies raised against CB1R also recognized the mitochondrial protein, stomatin-like protein 2. In line with this, mitochondrial labeling of CB1R was found substantially diminished but not completely eliminated in CB1R-KO (Cnr1−/−) mice. We observed that in contrast to wild type animals (Cnr1+/+ mice), which showed ~80% (77/97, 79.5±3.9%) of POMC neurons (red fluorescence) to contain labeling with the CB1R antisera (green fluorescence), in CB1R-KO (Cnr1−/− mice), less than 30% (37/128, 29.2±3.3%) of POMC neurons retained immunolabeling. Thus, we concluded that a large population of POMC neurons contains CB1R. All quantified results ± s.e.m. If not otherwise stated, P values (unpaired comparisons) by two-tailed Student’s t-test. Scale bar; 25 µm.
Extended Data Fig. 6
Extended Data Fig. 6. Bimodal CB1R-dependent regulation of mitochondrial respiration and UCP2-dependent control of POMC
a, b Bimodal CB1R-controlled mitochondrial respiration in hippocampus. a Hyperphagic (1 mg/kg BW ACEA, i.p.) CB1R activation increased ex vivo mitochondrial respiration (in nmol O2/min/mg protein; state 3: VEHI, n=6 mice, 170.7±12; ACEA, n=8, 252.7±17.2; state 4: VEHI, 92.7±5.4; ACEA, 139.7±6; ** P<0.01, *** P<0.001). b Neutral dose of ACEA on feeding (5 mg/kg BW, i.p.) reduced mitochondrial respiration (state 3: VEHI, n=7 mice, 178.2±12.2; ACEA, n=5, 118.9±9.4; state 4: VEHI, 100±5.1; ACEA, 64.3±6.3). c Representative Western Blot membranes for POMC (pro-POMC, ~31 kDa; POMC, ~27 kDa). d 24-hour food intake did not differ between WT (n=28 mice, 100±3.2%) and Ucp2−/− mice (n=29, 98.9±4.7%; n.s. P>0.05) after ACEA (1 mg/kg BW, i.p.) treatment. All quantified results ± s.e.m. If not otherwise stated, P values (unpaired comparisons) by two-tailed Student’s t-test.
Fig. 1
Fig. 1. CB1R-driven paradoxical POMC activation
a, b In fed mice, ACEA increased POMC cFOS (VEHI, n=5 mice, 38.3±6.6%; ACEA, n=4, 66.4±4.1%; * P <0.05). c ACEA increased POMC action potential (AP) frequency (left, Vehicle, n=22 cells/7 mice, 0.56±0.29 Hz; ACEA, n=22/7, 1.73±0.4 Hz; * P <0.05). POMC membrane potential (MP; right, Vehicle, −61.1±2.7 mV; ACEA, −60.7±2.3 mV). d1 In the presence of TTX, ACEA failed to alter POMC membrane potential (4/4 cells). d2 Without TTX, 200 nM ACEA depolarized POMC neurons (vehicle, n=6 cells, −59.8±3.7 mV; ACEA, n=6, −55.0±4.2 mV; * P <0.05). d3 1 µM ACEA hyperpolarized POMC neurons (vehicle, n=6, −56.2±1.6 mV; ACEA, n=6, −76.1±5.1 mV; * P <0.05). d4 Representative GABAergic (blue, left) and glutamatergic (blue, right) CB1R immunolabeling (red) in presynaptic terminals of POMC-GFP neurons (green). e Increased POMC cFOS by hyperphagic, but not by neutral CB1R activation (VEHI, n=3 mice, 36.3±3.6%; WIN, n=4, 69.9±7%; 1 mg/kg BW ACEA, n=3, 70.4±7.2%; 5 mg/kg BW ACEA, n=3, 29.8±2.6%; * P <0.05 vs. VEHI, P values by ordinary one-way ANOVA, followed by Dunett’s multiple comparisons test). f, g Local ARC hyperphagic CB1R activation induced pCREB-Ser133 (pCREB: VEHI, n=4 mice, 35.2±2.2%; ACEA, n=5, 55.8±3%) and cFOS (cFOS: VEHI, n=5, 38.7±5.4%; ACEA, n=5, 65.8±4.8%; ** P <0.01) in POMC cells. h, i RIMO decreased POMC cFOS (VEHI, n=6 mice, 12.1±2.8%; RIMO, n=6, 3.6±1.9%; * P <0.05). All values ± s.e.m. P values (unpaired comparisons) by two-tailed Student’s t-test. Scale bars; a, b, d4: 25 µm; f: 50 µm.
Fig. 2
Fig. 2. DREADD-controlled POMC activity interferes with cannabinoid-induced feeding
a, b DREADD-driven POMC inhibition reduced WIN-mediated hyperphagia (1 hour-post injection: VEH+VEHI, n=6 mice, 0.02±0.01; VEH+WIN, n=13, 0.19±0.02; CNO+VEHI, n=8, 0.03±0.01; CNO+WIN, n=12, 0.09±0.02; 2 hour-post injection: VEH+VEHI, 0.06±0.03; VEH+WIN, 0.32±0.02; CNO+VEHI, 0.04±0.01; CNO+WIN, 0.17±0.03) c, d DREADD-driven POMC inhibition blocked ACEA-mediated hyperphagia (1 hour-post injection: VEH+VEHI, n=6, 0.01±0.004; VEH+ACEA, n=6, 0.07±0.02; CNO+VEHI, n=8, 0.01±0.004; CNO+ACEA, n=8, 0.03±0.01; 2 hour-post injection: VEH+VEHI, 0.04±0.01; VEH+ACEA, 0.15±0.03; CNO+VEHI, 0.04±0.01; CNO+ACEA, 0.07±0.02). e, f DREADD-driven POMC activation enhanced ACEA-mediated hyperphagia (1 hour-post injection: VEH+VEHI, n=6, 0.02±0.01; VEH+ACEA, n=6, 0.11±0.04; CNO+VEHI, n=5, 0.02±0.01; CNO+ACEA, n=5, 0.26±0.04; 2 hour-post injection: VEH+VEHI, 0.04±0.01; VEH+ACEA, 0.17±0.04; CNO+VEHI, 0.07±0.02; CNO+ACEA, 0.35±0.03). All values ± s.e.m. * P <0.05, ** P <0.01, *** P <0.001, # P <0.05 interaction of WIN or ACEA and CNO. P values by ordinary two-way ANOVA, followed by Sidak’s multiple comparisons test.
Fig. 3
Fig. 3. CB1R triggers hypothalamic β-endorphin release and drives feeding via opioid receptors
a ACEA did not affect in vitro α-MSH secretion (aCSF, n=13 mice, 1.00±0.06; ACEA, n=6, 1.05±0.05; n.s. P >0.05) but increased β-endorphin release (aCSF, n=9, 1.00±0.27; ACEA, n=4, 2.00±0.29; * P <0.05). b ARC administration of RIMO blocked ACEA-induced increase of β-endorphin in WT mice (all values in ng/mg protein; VEHI+ACEA, n=6 mice, 352.7±32.4; RIMO+ACEA, n=6, 277.4±7.5; * P <0.05 vs. VEHI+ACEA). ACEA did not increase β-endorphin in CB1R knockout (Cnr1−/−) mice (* P <0.05 P values by one-way ANOVA, followed by Dunnett’s multiple comparisons test). c, d ACEA elevated hypothalamic PC-1 and PC-2 protein levels (all groups n=4 mice; PC-1: VEHI, 1.00±0.03; ACEA, 1.31±0.04; *** P<0.001; PC-2: VEHI, 1.00±0.18; ACEA, 2.16±0.26; * P<0.05). e (overview), e1 (magnification) α-MSH (green fluorescence) and β-endorphin (red fluorescence) in POMC fibers in the PVN. Colored arrows indicate nonoverlapping immunolabeling. f Electron micrograph showing peroxidase immunolabeling of β-endorphin (red arrow) and immunogold labeling of α-MSH (green arrow) in different vesicles of the same process. g, h Peripheral NALO (7.5 mg/kg BW, i.p.) blocked hyperphagia induced by WIN (all values in g; g; VEHI+VEHI, n=10 mice, 0.03±0.02; VEHI+WIN, n=10, 0.21±0.03; NALO+VEHI, n=8, 0.03±0.01, NALO+WIN, n=10, 0.07±0.02; *** P <0.001, n.s. P >0.05, # P <0.05 for interaction of NALO and WIN, P values by ordinary two-way ANOVA, followed by Sidak’s multiple comparisons test) or ACEA (h; VEHI+ACEA, n=4, 0.36±0.05; NALO+ACEA, n=4, 0.17±0.05; * P <0.05). i PVN NALO (5 µg/0.5µL) blocked hyperphagia by ACEA (i.p.; VEHI+VEHI, n=5, 0.07±0.03; VEHI+ACEA, n=5, 0.17±0.02; NALO+VEHI, n=6, 0.08±0.02; NALO+ACEA, n=6, 0.08±0.02; * P <0.05, n.s. P >0.05, # P <0.05 for interaction of NALO and ACEA, P values by ordinary two-way ANOVA, followed by Sidak’s multiple comparisons test) or WIN (i.p.; VEHI+WIN, n=6, 0.22±0.02; NALO+WIN, n=7, 0.14±0.02; * P <0.05; Hoechst (blue) injection for verification of correct cannula placement). j Hyperphagic ACEA decreased AgRP (NPY-hrGFP) action potential (AP) frequency (vehicle, n=20 cells/4mice, 1.65±0.27 Hz; ACEA, n=20/4, 0.84±0.24 Hz; * P <0.05). All values ± s.e.m. P values (unpaired comparisons) by two-tailed Student’s t-test. Scale bars; e: 25 µm; e1: 5 µm f: 1 µm; i: 25 µm.
Fig. 4
Fig. 4. CB1R-induces mitochondrial energetic switch in POMC neurons
a ARC Cnr1 expression (VEHI, n=5 mice, 1.00±0.11; ACEA, n=5, 0.84±0.12, n.s. P >0.05). b CB1R (red, arrow) presynaptic to a POMC cell (GFP, green). c, d Intracellular CB1R in a POMC neuron (arrow). D Mitochondrial CB1R labeling (arrow) in POMC cell body (top) and process (bottom). e–g Increased mitochondria-ER contacts in POMC neurons by WIN and ACEA (VEHI, n=10 cells/3 mice, 37.7±2.8; WIN, n=10/3, 49.3±2.2; ACEA, n=10/3, 51.9±4; * P <0.05, ** P <0.01 vs. VEHI, P values by one-way ANOVA, followed by Dunnett’s multiple comparisons test). h, i Hyperphagic (1 mg/kg BW) ACEA treatment increased ex vivo hypothalamic mitochondrial respiration (in nmol O2/min/mg protein; state 3: VEHI, n=6 mice, 180±8.9; ACEA, n=8, 218.9±15; state 4: VEHI, 81.2±2.1; ACEA, 104.7±5; * P <0.05, ** P <0.01). j Neutral dose of ACEA (5 mg/kg BW) reduced mitochondrial respiration (state 3: VEHI, n=8, 186.1±3.7; ACEA, n=6, 156.8±8.4; state 4: VEHI, 79.9±4.7; ACEA, 63.8±4.4) All values ± s.e.m. P values (unpaired comparisons) by two-tailed Student’s t-test. Scale bars; b, c: 25 µm; d: 0.5 µm; e, f: 1 µm.
Fig. 5
Fig. 5. CB1R-induced energetic switch in POMC neurons relies on UCP2
a, b ACEA increased POMC-GFP ROS (DHE; VEHI, n=130 cells/7 mice, 100±4.5%; ACEA, n=248/9, 146.2±3.7%; *** P <0.001). c ACEA triggered hypothalamic Ucp2 expression (VEHI, n=5 mice, 1.00±0.07; ACEA, n=5, 1.44±0.13, * P <0.05). d No effect of ACEA on ex vivo mitochondrial respiration in Ucp2−/− mice (state 3: VEHI, n=3 mice, 172.9±20.6; ACEA, n=3, 152.9±22.9; state 4: VEHI, 87.1±7.1; ACEA, 73.8±7.5, n.s. P>0.05). e Increased POMC protein by ACEA in WT (VEHI, n=3 mice, 1.00±0.19; ACEA, n=3, 2.3±0.29, * P<0.05) but not in Ucp2−/− littermates (VEHI, n=3, 1.00±0.16; ACEA, n=3, 0.96±0.05; n.s. P>0.05). No effect of ACEA on (f) PC-1 protein (in fold change; VEHI, n=3 mice, 1.00±0.01; ACEA, n=4, 0.9±0.06, n.s. P>0.05) and (g) PC-2 protein (VEHI, n=3, 1.00±0.03; ACEA, n=4, 1.07±0.05, n.s. P>0.05) in Ucp2−/− mice. h cFOS in POMC neurons induced by ACEA in WT (VEHI, n=4 mice, 22.1±6.2%; ACEA: 30 min, n=5, 39.6±3%; 90 min, n=3, 63.1±5,5%; 150 min, n=3, 57.2±2.6%; 180 min, n=3, 38.5±2.2%; *** P<0.001 vs. VEHI, * P<0.05 vs. VEHI, P values by ordinary one-way ANOVA, followed by Dunett’s multiple comparisons test) and Ucp2−/− littermates (VEHI, n=6 mice, 22.6±3.6%; ACEA: 30 min, n=6, 42.2±6.4%; 90 min, n=6, 36.6±3.1%; 150 min, n=3, 37.3±1.6%; 180 min, n=3, 33.5±5.2%; * P<0.05 vs. VEHI, P values by ordinary one-way ANOVA, followed by Dunett’s multiple comparisons test; # P<0.05 vs. WT, ACEA 90 min, P values (unpaired comparisons) by multiple t-tests, followed by Holm-Sidak’s multiple comparisons test). i ACEA (2 h)-induced hyperphagia in WT (VEHI, n=10 mice, 0.04±0.01 g; ACEA, n=11, 0.14±0.03 g, * P<0.05) but not in Ucp2−/− littermates (VEHI, n=10 mice, 0.1±0.05 g; ACEA, n=14, 0.07±0.03 g, n.s. P>0.05, # P<0.05 for interaction between ACEA and genotypes). All values ± s.e.m. j Increased PVN β-endorphin immunoreactivity in WT littermates (bilateral PVN analysis; VEHI, n=24 values/12 sections/4 mice; 90 min ACEA, n=24/12/4); reduced PVN β-endorphin in Ucp2−/− mice (VEHI, n=18/9/3; ACEA, 18/9/3; values, see Supplementary Data Table 4; * P<0.05, ** P<0.01).

Comment in

References

    1. Dietrich MO, Horvath TL. Hypothalamic control of energy balance: insights into the role of synaptic plasticity. Trends in neurosciences. 2013;36:65–73. - PubMed
    1. Aponte Y, Atasoy D, Sternson SM. AGRP neurons are sufficient to orchestrate feeding behavior rapidly and without training. Nature neuroscience. 2011;14:351–355. - PMC - PubMed
    1. Krashes MJ, et al. Rapid, reversible activation of AgRP neurons drives feeding behavior in mice. The Journal of clinical investigation. 2011;121:1424–1428. - PMC - PubMed
    1. Yang Y, Atasoy D, Su HH, Sternson SM. Hunger states switch a flip-flop memory circuit via a synaptic AMPK-dependent positive feedback loop. Cell. 2011;146:992–1003. - PMC - PubMed
    1. DiPatrizio NV, Piomelli D. The thrifty lipids: endocannabinoids and the neural control of energy conservation. Trends in neurosciences. 2012;35:403–411. - PMC - PubMed

Publication types

MeSH terms