

Genome-wide analysis of transcription factor binding sites and their characteristic DNA structures
- PMID: 25708259
- PMCID: PMC4331811
- DOI: 10.1186/1471-2164-16-S3-S8
Genome-wide analysis of transcription factor binding sites and their characteristic DNA structures
Abstract
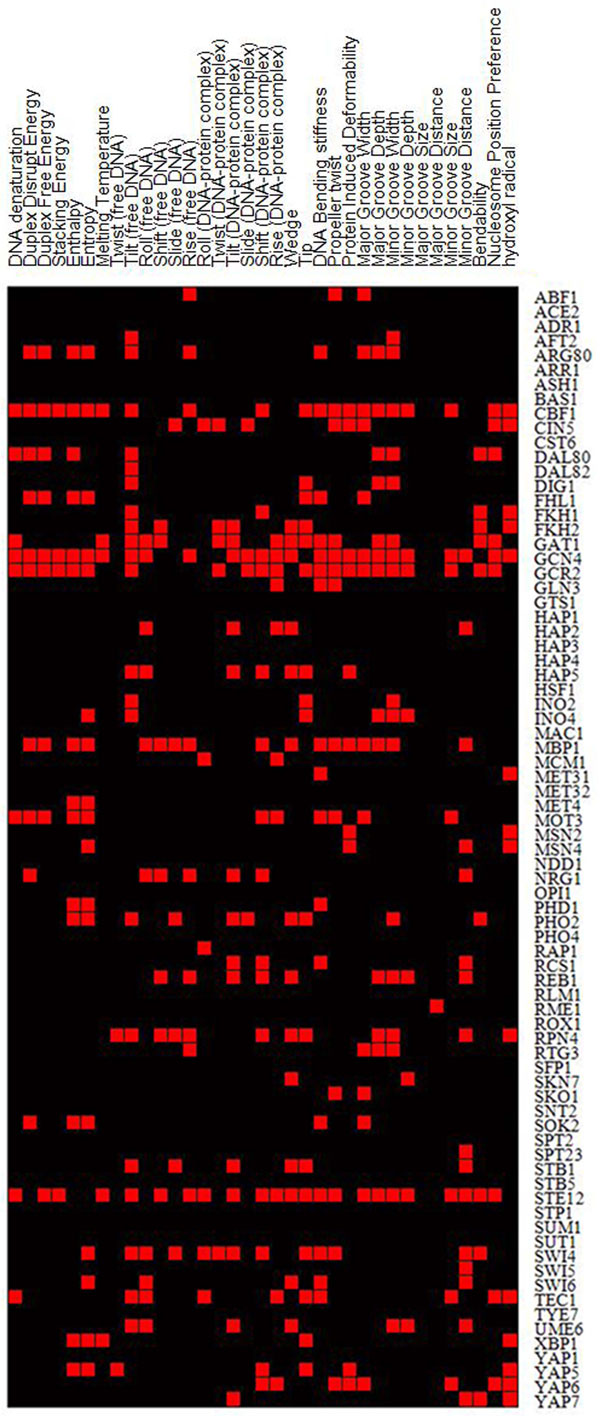
Background: Transcription factors (TF) regulate gene expression by binding DNA regulatory regions. Transcription factor binding sites (TFBSs) are conserved not only in primary DNA sequences but also in DNA structures. However, the global relationship between TFs and their preferred DNA structures remains to be elucidated.
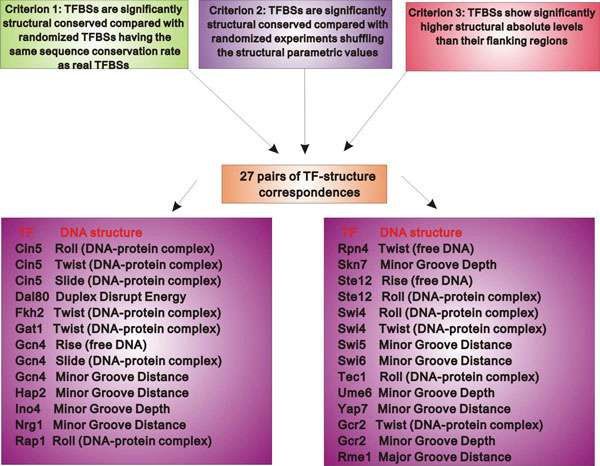
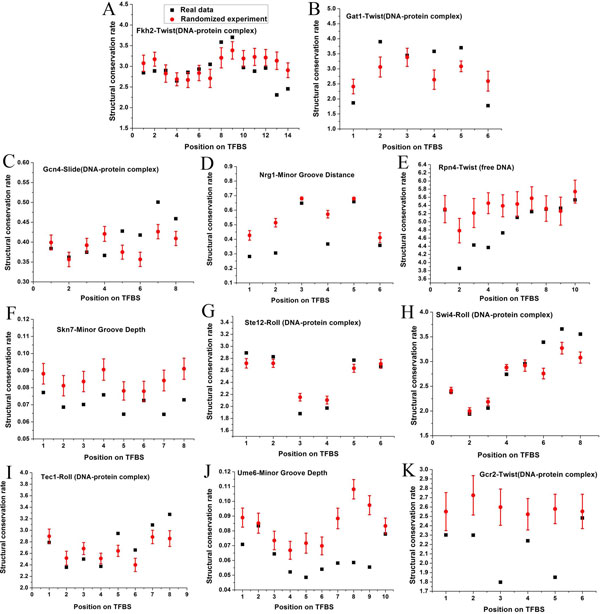
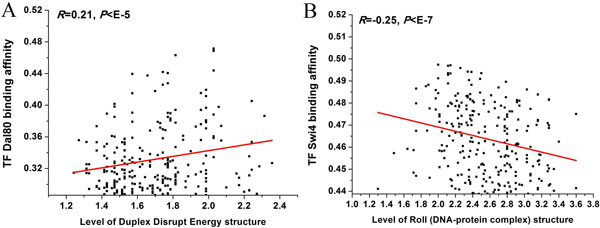
Results: In this paper, we have developed a computational method to generate a genome-wide landscape of TFs and their characteristic binding DNA structures in Saccharomyces cerevisiae. We revealed DNA structural features for different TFs. The structural conservation shows positional preference in TFBSs. Structural levels of DNA sequences are correlated with TF-DNA binding affinities.
Conclusions: We provided the genome-wide correspondences of TFs to DNA structures. Our findings will have implications in understanding TF regulatory mechanisms.
Figures
Similar articles
-
A computational "genome walk" technique to identify regulatory interactions in gene networks.Pac Symp Biocomput. 1998:264-78. Pac Symp Biocomput. 1998. PMID: 9697188
-
Nucleosomal context of binding sites influences transcription factor binding affinity and gene regulation.Genomics Proteomics Bioinformatics. 2009 Dec;7(4):155-62. doi: 10.1016/S1672-0229(08)60045-5. Genomics Proteomics Bioinformatics. 2009. PMID: 20172488 Free PMC article.
-
PhyloGibbs: a Gibbs sampling motif finder that incorporates phylogeny.PLoS Comput Biol. 2005 Dec;1(7):e67. doi: 10.1371/journal.pcbi.0010067. Epub 2005 Dec 9. PLoS Comput Biol. 2005. PMID: 16477324 Free PMC article.
-
Genome-wide analysis of the context-dependence of regulatory networks.Genome Biol. 2005;6(2):206. doi: 10.1186/gb-2005-6-2-206. Epub 2005 Jan 27. Genome Biol. 2005. PMID: 15693953 Free PMC article. Review.
-
Transcriptional networks: reverse-engineering gene regulation on a global scale.Curr Opin Microbiol. 2004 Dec;7(6):638-46. doi: 10.1016/j.mib.2004.10.009. Curr Opin Microbiol. 2004. PMID: 15556037 Review.
Cited by
-
Hydrophobic Amino Acids as Universal Elements of Protein-Induced DNA Structure Deformation.Int J Mol Sci. 2020 Jun 2;21(11):3986. doi: 10.3390/ijms21113986. Int J Mol Sci. 2020. PMID: 32498246 Free PMC article.
-
Transversions have larger regulatory effects than transitions.BMC Genomics. 2017 May 19;18(1):394. doi: 10.1186/s12864-017-3785-4. BMC Genomics. 2017. PMID: 28525990 Free PMC article.
References
-
- Hertz GZ, Stormo GD. Identifying DNA and protein patterns with statistically significant alignments of multiple sequences. Bioinformatics (Oxford, England) 1999;15(7-8):563–577. - PubMed
-
- Price A, Ramabhadran S, Pevzner PA. Finding subtle motifs by branching from sample strings. Bioinformatics (Oxford, England) 2003. pp. ii149–155. - PubMed
Publication types
MeSH terms
Substances
LinkOut - more resources
Full Text Sources
Molecular Biology Databases
Miscellaneous
