. 2015 Mar 30;10(1):019002.
doi: 10.1116/1.4906485.

Experimental characterization of adsorbed protein orientation, conformation, and bioactivity

Affiliations

Experimental characterization of adsorbed protein orientation, conformation, and bioactivity

Aby A Thyparambil et al. Biointerphases. .

Abstract

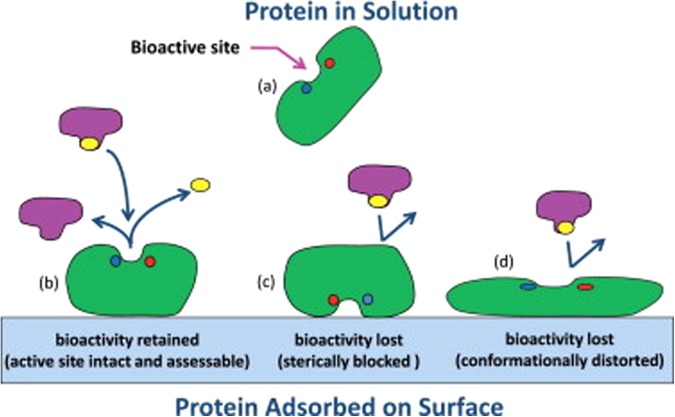
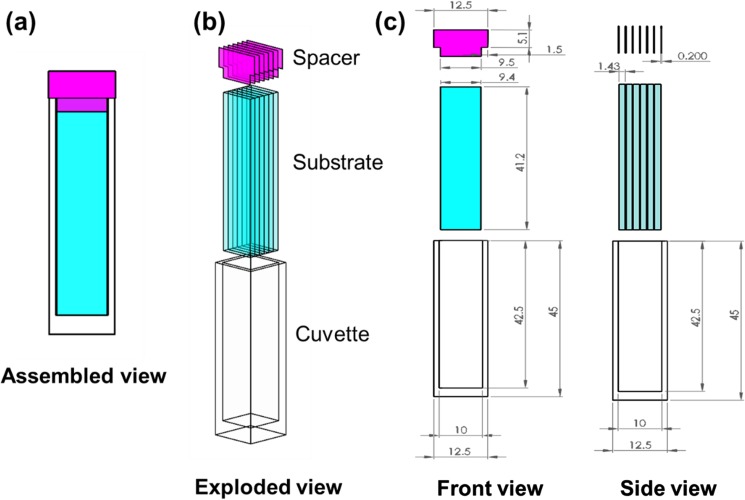
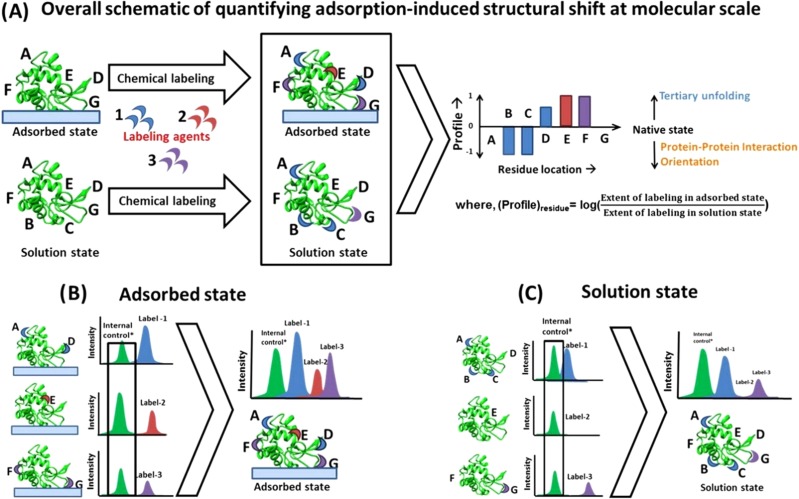
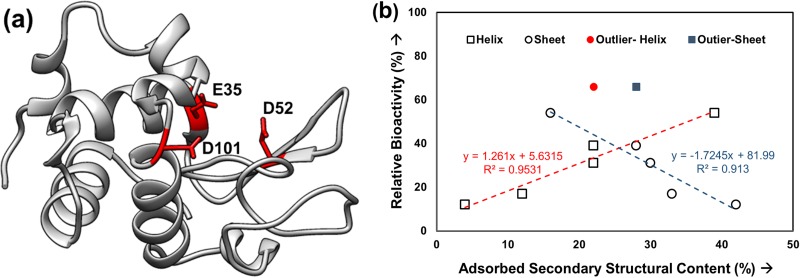
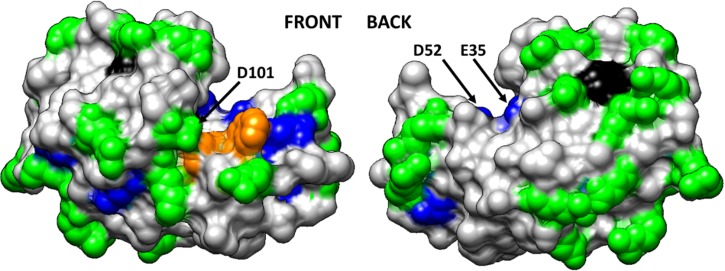
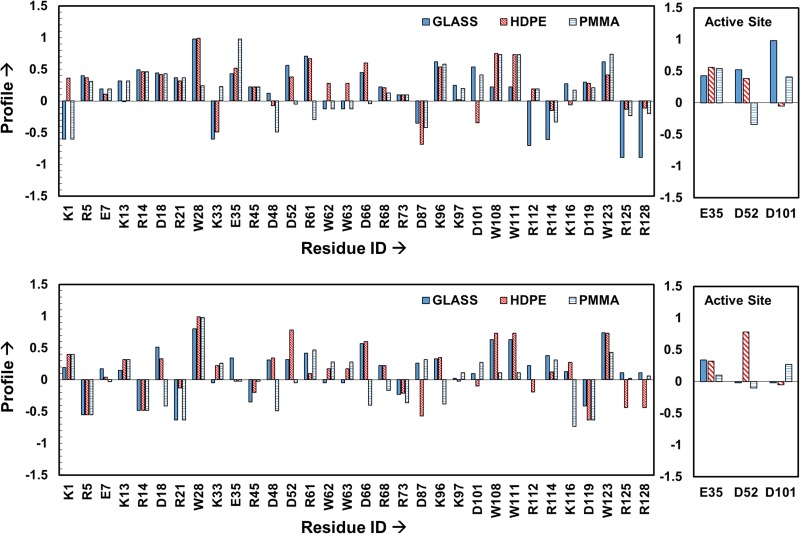
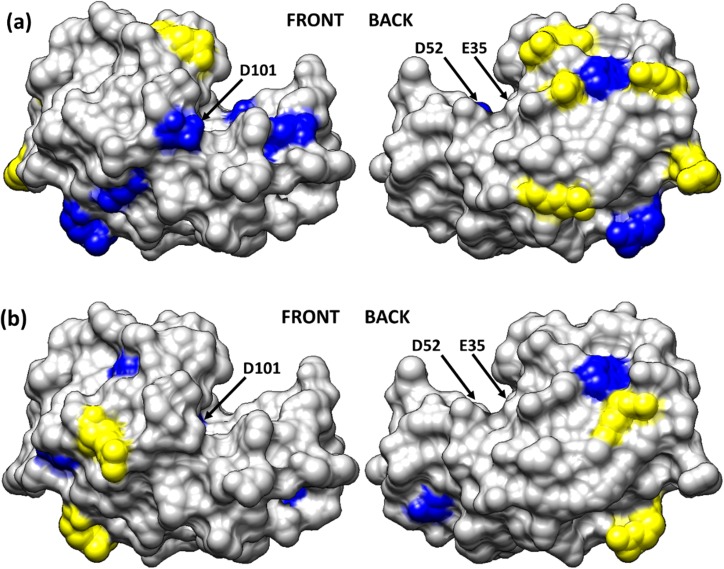
Protein adsorption on material surfaces is a common phenomenon that is of critical importance in many biotechnological applications. The structure and function of adsorbed proteins are tightly interrelated and play a key role in the communication and interaction of the adsorbed proteins with the surrounding environment. Because the bioactive state of a protein on a surface is a function of the orientation, conformation, and accessibility of its bioactive site(s), the isolated determination of just one or two of these factors will typically not be sufficient to understand the structure-function relationships of the adsorbed layer. Rather a combination of methods is needed to address each of these factors in a synergistic manner to provide a complementary dataset to characterize and understand the bioactive state of adsorbed protein. Over the past several years, the authors have focused on the development of such a set of complementary methods to address this need. These methods include adsorbed-state circular dichroism spectropolarimetry to determine adsorption-induced changes in protein secondary structure, amino-acid labeling/mass spectrometry to assess adsorbed protein orientation and tertiary structure by monitoring adsorption-induced changes in residue solvent accessibility, and bioactivity assays to assess adsorption-induced changes in protein bioactivity. In this paper, the authors describe the methods that they have developed and/or adapted for each of these assays. The authors then provide an example of their application to characterize how adsorption-induced changes in protein structure influence the enzymatic activity of hen egg-white lysozyme on fused silica glass, high density polyethylene, and poly(methyl-methacrylate) as a set of model systems.


Figures

F<sc>ig.</sc> 1.
Fig. 1.
Illustration of the influence of adsorption on the bioactive state of an enzyme. (a) The enzyme in its native-state structure in solution, and (b) when adsorbed with its bioactive site accessible and conformationally intact, thus providing native-state-like bioactivity. (c) Enzyme adsorbed with its bioactive site sterically blocked by the surface, thus inhibiting substrate binding with subsequent loss in bioactivity due to adsorbed orientation. (d) Enzyme adsorbed with its bioactive site accessible but conformationally distorted with subsequent loss in bioactivity due to structural changes of the bioactive site. Reproduced with permission from R. A. Latour, Colloids Surf., B 124, 25 (2014). Copyright 2014 Elsevier.
F<sc>ig.</sc> 2.
Fig. 2.
Improved experimental setup to investigate the effect of bulk surface properties on the structure of adsorbed proteins is shown in (a)–(c). The assembled view of the improved setup is shown in panel (a) with the individual components within the setup [one standard spectroscopic grade quartz cuvette (21-Q-10, Starna Cells), six custom-cut fused silica substrates (Custom order CU-1005-041JS, ChemGlass Life sciences), and seven vinyl polymeric spacers] being shown in the exploded view of (b) and (c). The dimensions of each individual component: the standard spectroscopic grade quartz cuvette of path length 1 cm (external dimension: 12.5 mm × 12.5 mm × 45 mm; internal dimension: 42.5 mm × 10 mm × 10 mm), fused silica substrates (9.4 mm × 1.43 mm × 41.2 mm), and T-spacers (base: 1.5 mm × 9.5 mm × 0.2 mm; head: 5.1 mm × 12.5 mm × 0.2 mm) are shown in the front and side views of the setup.
F<sc>ig.</sc> 3.
Fig. 3.
Quantification of adsorption-induced structural shifts at a molecular level using the AAL/MS technique (Ref. 51). (a) The overall scheme of the methodology while the specific approach to directly compare the labeling from multiple sites within the adsorbed and solution state are shown in (b) and (c), respectively. The extent of amino acid labeling by a labeling agent is directly related to its solvent exposure. After being labeled for each individual amino acid residue type, the proteins are digested off of the surface, and the mass spectrum from each labeling process is acquired. The mass spectra from different batch labeling processes are then directly compared after normalizing them with the mass spectra of an internal control peptide fragment that does not contain one of the targeted amino acids to adjust for batch-to-batch differences in MS intensities. Subsequently, the profile of a residue relates to the extent of its solvent exposure in the adsorbed state relative to the solution state. When the protein is adsorbed from a very low solution concentration, a negative shift in an amino acid profile can be considered to be primarily related to adsorbed orientation, while a positive shift infers areas of tertiary unfolding. When the protein is adsorbed from high solution concentration, the negative shift in an amino acid's profile can also be due to protein–protein interaction effects on the surface. Reproduced with permission from Thyparambil et al., Acta Biomater. 10, 2404 (2014). Copyright 2014 by Elsevier.
F<sc>ig.</sc> 4.
Fig. 4.
(a) Ribbon diagram of the three-dimensional structure of HEWL (PDB ID: 193L) (Ref. 70). The three residues most important for catalysis: E35, D52, and D101 are marked in red, and (b) % relative bioactivity (y-axis) vs % secondary structural content (helix and sheet) (x-axis) in the adsorbed HEWL layers on different surfaces. The helix and β-sheet content of HEWL in solution was found to be ∼38% (±2%) and 16% (±2%) (N = 3, averaged 95% C.I. values = ±4% helicity for each data point, averaged 95% C.I. values = ±9% for bioactivity).
F<sc>ig.</sc> 5.
Fig. 5.
Space-filled model of HEWL (PDB ID: 193L) with amino acid residues color coded by their solvent accessibility as determined from targeted amino acid labeling in solution (Ref. 70). Color coding: charged amino acid residues (Asp, Glu, Lys, Arg) with high solvent accessibility (green) and moderate solvent accessibility (blue), Trp residues with high solvent accessibility (orange) and low solvent accessibility (black). Nontargeted amino acid residues are color coded in light gray. This figure is illustrated using UCSF Chimera (Ref. 73). The arrows point out the location of the three key amino acid residues that provide the catalytic function of the enzyme (E35, D52, and D101). Reproduced with permission from Thyparambil et al., Acta Biomater. 10, 2404 (2014). Copyright 2014 Elsevier.
F<sc>ig.</sc> 6.
Fig. 6.
Labeling profile of the targeted residues in HEWL on glass, PMMA and HDPE surfaces when adsorbed from 0.03 mg/ml (top plot) to 1.00 mg/ml (bottom plot) protein solutions. The residues within the active site of HEWL are shown separately in the right-hand plot to more clearly show their response. Profiles within about ±0.1 of zero can be considered to be not significantly different from the solution state (n = 3). Profiles beyond ±0.5 represent greater than threefold change to the native-state solvent exposure, which is a highly significant difference (p < 0.0001). Residues showing no difference in their solvation between solution and the adsorbed states have profile values equal to 0. Reproduced with permission from Thyparambil et al., Acta Biomater. 10, 2404 (2014). Copyright 2014 Elsevier.
F<sc>ig.</sc> 7.
Fig. 7.
Solvation profile of the residues in HEWL adsorbed from (a) 0.03 and (b) 1.00 mg/ml on the glass surface. Residue color code: yellow (>threefold decrease in solvent accessibility), blue (>threefold increase in solvent accessibility) and light gray (other residues). The arrows point to the location of the three key amino acid residues that provide the catalytic function of the enzyme (E35, D52, and D101). Reproduced with permission from Thyparambil et al., Acta Biomater. 10, 2404 (2014). Copyright 2014 Elsevier.

References

    1. Itamar W., Azalia R., Benjamin S., Dalia R., and Eugenii K., Adv. Mater. 5, 912 (1993).10.1002/adma.19930051206 - DOI
    1. Larsson A., Ekblad T., Andersson O., and Liedberg B., Biomacromolecules 8, 287 (2007).10.1021/bm060685g - DOI - PubMed
    1. Czeslik C., Jackler G., and Royer C., Spectroscopy 16, 139 (2002).10.1155/2002/473035 - DOI
    1. Knowles J. R., Nature 350, 121 (1991).10.1038/350121a0 - DOI - PubMed
    1. Shard A. G. and Tomlins P. E., Regener. Med. 1, 789 (2006).10.2217/17460751.1.6.789 - DOI - PubMed

Publication types