

Robust Intensity Standardization in Brain Magnetic Resonance Images
- PMID: 25708893
- PMCID: PMC4636718
- DOI: 10.1007/s10278-015-9782-8
Robust Intensity Standardization in Brain Magnetic Resonance Images
Abstract
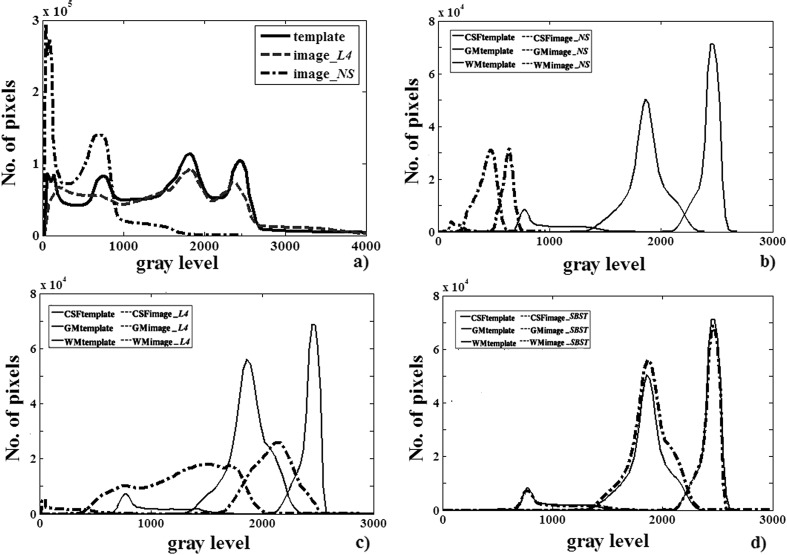
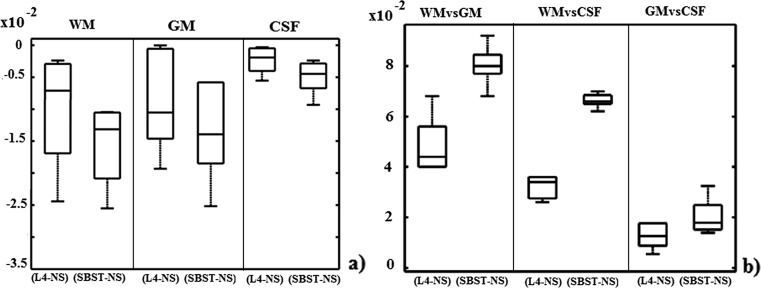
The paper is focused on a tiSsue-Based Standardization Technique (SBST) of magnetic resonance (MR) brain images. Magnetic Resonance Imaging intensities have no fixed tissue-specific numeric meaning, even within the same MRI protocol, for the same body region, or even for images of the same patient obtained on the same scanner in different moments. This affects postprocessing tasks such as automatic segmentation or unsupervised/supervised classification methods, which strictly depend on the observed image intensities, compromising the accuracy and efficiency of many image analyses algorithms. A large number of MR images from public databases, belonging to healthy people and to patients with different degrees of neurodegenerative pathology, were employed together with synthetic MRIs. Combining both histogram and tissue-specific intensity information, a correspondence is obtained for each tissue across images. The novelty consists of computing three standardizing transformations for the three main brain tissues, for each tissue class separately. In order to create a continuous intensity mapping, spline smoothing of the overall slightly discontinuous piecewise-linear intensity transformation is performed. The robustness of the technique is assessed in a post hoc manner, by verifying that automatic segmentation of images before and after standardization gives a high overlapping (Dice index >0.9) for each tissue class, even across images coming from different sources. Furthermore, SBST efficacy is tested by evaluating if and how much it increases intertissue discrimination and by assessing gaussianity of tissue gray-level distributions before and after standardization. Some quantitative comparisons to already existing different approaches available in the literature are performed.
Keywords: Alzheimer’s Disease Neuroimaging Initiative; General intensity scale; Intensity standardization; Magnetic Resonance Imaging; Nonlinear registration.
Figures


References
-
- Leung KK, Clarkson MJ, Bartlett JW, Clegg S, Jack CR, Jr, Weiner MW, Fox NC, Ourselin S, Alzheimer's Disease Neuroimaging Initiative Robust atrophy rate measurement in Alzheimer's disease using multi-site serial MRI: Tissue-specific intensity standardization and parameter selection. Neuroimage. 2010;50:516–523. doi: 10.1016/j.neuroimage.2009.12.059. - DOI - PMC - PubMed
-
- Jovicich J, Czanner S, Greve D, Haley E, van der Kouwe A, Gollub R, Kennedy D, Schmitt F, Brown G, Macfall J, Fischl B, Dale A. Reliability in multi-site structural MRI studies: effects of gradient non-linearity correction on phantom and human data. Neuroimage. 2006;30:436–443. doi: 10.1016/j.neuroimage.2005.09.046. - DOI - PubMed
Publication types
MeSH terms
Grants and funding
LinkOut - more resources
Full Text Sources
Other Literature Sources
Medical
