. 2015;15 Suppl 1(Suppl 1):S3.
doi: 10.1186/1471-2148-15-S1-S3. Epub 2015 Feb 2.

Modeling evolution of spatially distributed bacterial communities: a simulation with the haploid evolutionary constructor

Modeling evolution of spatially distributed bacterial communities: a simulation with the haploid evolutionary constructor

Alexandra Klimenko et al. BMC Evol Biol. 2015.

Abstract

Background: Multiscale approaches for integrating submodels of various levels of biological organization into a single model became the major tool of systems biology. In this paper, we have constructed and simulated a set of multiscale models of spatially distributed microbial communities and study an influence of unevenly distributed environmental factors on the genetic diversity and evolution of the community members.

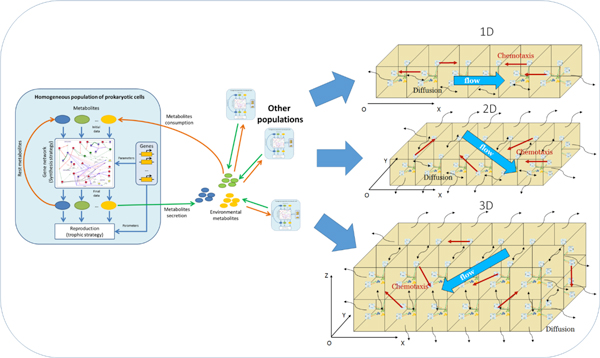
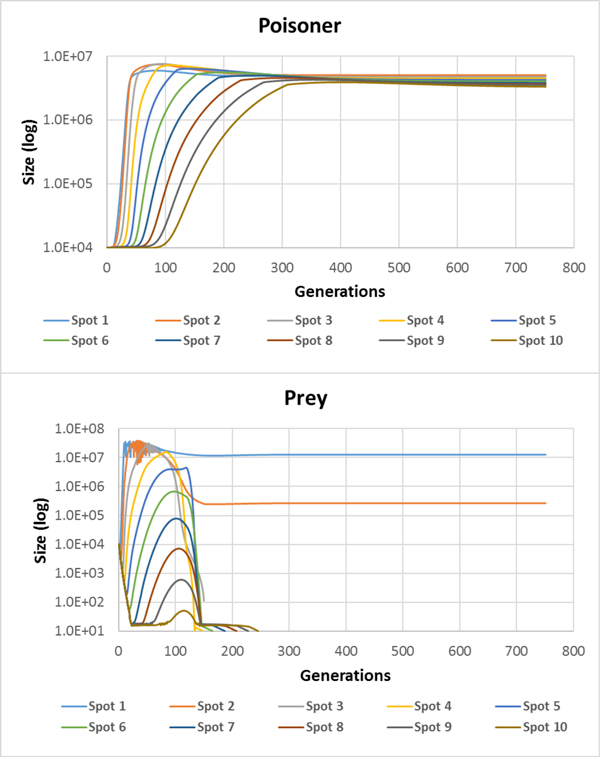
Results: Haploid Evolutionary Constructor software http://evol-constructor.bionet.nsc.ru/ was expanded by adding the tool for the spatial modeling of a microbial community (1D, 2D and 3D versions). A set of the models of spatially distributed communities was built to demonstrate that the spatial distribution of cells affects both intensity of selection and evolution rate.

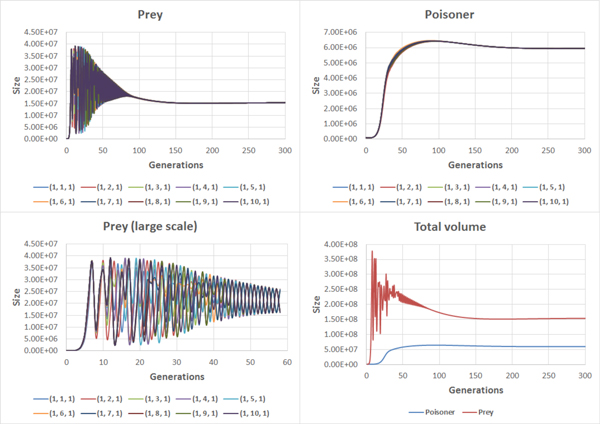
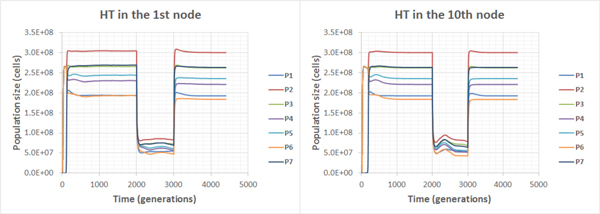
Conclusion: In spatially heterogeneous communities, the change in the direction of the environmental flow might be reflected in local irregular population dynamics, while the genetic structure of populations (frequencies of the alleles) remains stable. Furthermore, in spatially heterogeneous communities, the chemotaxis might dramatically affect the evolution of community members.


Figures

Figure 1
Figure 1
Principal diagram of main HEC objects and processes in the 0D case (uniform mixing [36]).
Figure 2
Figure 2
Building 1D, 2D and 3D environments form 0D blocks.
Figure 3
Figure 3
Spatial organization of a habitat: a) flow-through; b) perpendicular-flow.
Figure 4
Figure 4
Trophic graph of the "poisoner-prey" community. P1 - poisoner population, P2 - prey population, S1 - substrate synthesized by the prey, S2 - substrate (toxin) synthesized by the poisoner, N1 - non-specific substrate coming with the inflow.
Figure 5
Figure 5
Population dynamics of the prey (top) and poisoners (bottom) in the "poisoner-prey" model with the initial genetic polymorphism in both populations (Additional file 1). Various colors show various nodes of the habitat.
Figure 6
Figure 6
Dynamics of allele frequencies in prey and poisoner populations in nodes 1 and 10 in the "poisoner-prey" model with the initial genetic polymorphism (Additional file1). Color width denotes proportion of allele in a population.
Figure 7
Figure 7
Population dynamics of preys (left) and poisoners (right) in different nodes and a whole habitat (chemotaxis is off, Additional file2).
Figure 8
Figure 8
Trophic graph of a community consisting of two trophic cycles: P1-P2-P3 and P4-P5-P6 [38]. N is a non-specific substrate contained in the flow. HT of the gene from P6 cells to P1 cells is shown by a lightning. As a result of the HT, the new type of cells, which forms P7 population (grey arrow) originates.
Figure 9
Figure 9
Population dynamics in the C-C community in the flow-through habitat. Chemotaxis is on (Additional file 3, Additional file 4).
Figure 10
Figure 10
Population dynamics in the NC-NC community in the flow-through habitat. Chemotaxis on (Additional file 5 , Additional file 6 , Additional file 7).
Figure 11
Figure 11
Graph of trophic interactions in the NC-NC community in the flow-through habitat (chemotaxis is on) after the HT and starvation (HT occurred in 1st - 5th nodes).
Figure 12
Figure 12
Graph of trophic interactions in the NC-NC community in the flow-through habitat (chemotaxis is on) after the HT and starvation (HT occurred in the 10th node).

Similar articles

Cited by

References

    1. Zavarzin G. In: Glob Ecol. 1. Jørgensen SE, editor. Academic Press; 2010. Microbial Cycles; pp. 183–190.
    1. Dobretsov N, Kolchanov N, Rozanov A, Zavarzin G. Biosphere Origin and Evolution. Boston, MA: Springer US; 2008. p. 426.
    1. Madigan MT, Martinko JM, Bender KS, Buckley DH, Stahl DA. Brock Biology of Microorganisms. 14. New York: Benjamin Cummings; 2014. p. 1136.
    1. Stoodley P, Sauer K, Davies DG, Costerton JW. Biofilms as complex differentiated communities. Annu Rev Microbiol. 2002;56:187–209. doi: 10.1146/annurev.micro.56.012302.160705. - DOI - PubMed
    1. Conrad JC. Physics of bacterial near-surface motility using flagella and type IV pili: implications for biofilm formation. Res Microbiol. 2012;163:619–29. doi: 10.1016/j.resmic.2012.10.016. - DOI - PubMed

Publication types

LinkOut - more resources