Review
. 2015 Feb 9:8:408.
doi: 10.3389/fnins.2014.00408. eCollection 2014.

Cerebral metabolism following traumatic brain injury: new discoveries with implications for treatment

Affiliations
Review

Cerebral metabolism following traumatic brain injury: new discoveries with implications for treatment

George A Brooks et al. Front Neurosci. .

Abstract

Because it is the product of glycolysis and main substrate for mitochondrial respiration, lactate is the central metabolic intermediate in cerebral energy substrate delivery. Our recent studies on healthy controls and patients following traumatic brain injury (TBI) using [6,6-(2)H2]glucose and [3-(13)C]lactate, along with cerebral blood flow (CBF) and arterial-venous (jugular bulb) difference measurements for oxygen, metabolite levels, isotopic enrichments and (13)CO2 show a massive and previously unrecognized mobilization of lactate from corporeal (muscle, skin, and other) glycogen reserves in TBI patients who were studied 5.7 ± 2.2 days after injury at which time brain oxygen consumption and glucose uptake (CMRO2 and CMRgluc, respectively) were depressed. By tracking the incorporation of the (13)C from lactate tracer we found that gluconeogenesis (GNG) from lactate accounted for 67.1 ± 6.9%, of whole-body glucose appearance rate (Ra) in TBI, which was compared to 15.2 ± 2.8% (mean ± SD, respectively) in healthy, well-nourished controls. Standard of care treatment of TBI patients in state-of-the-art facilities by talented and dedicated heath care professionals reveals presence of a catabolic Body Energy State (BES). Results are interpreted to mean that additional nutritive support is required to fuel the body and brain following TBI. Use of a diagnostic to monitor BES to provide health care professionals with actionable data in providing nutritive formulations to fuel the body and brain and achieve exquisite glycemic control are discussed. In particular, the advantages of using inorganic and organic lactate salts, esters and other compounds are examined. To date, several investigations on brain-injured patients with intact hepatic and renal functions show that compared to dextrose + insulin treatment, exogenous lactate infusion results in normal glycemia.

Keywords: brain fuel; brain metabolism; gluconeogenesis; lactate shuttle; trauma.


Figures
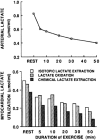
Figure 1
Figure 1
Arterial lactate level (upper graph) and a comparison of myocardial tracer-measured (isotopic) lactate extraction, lactate oxidation, and chemical extraction based on (a-v) and myocardial blood flow (lower graph) are shown for a trained bicyclist whose arterial [lactate] fell during moderate-intensity exercise. The results show that net lactate exchange measurements underestimate total lactate production, that most lactate produced is oxidized, and that lactate uptake is concentration dependent. From Gertz et al. (1988).
Figure 2
Figure 2
Cerebral metabolic rate (CMR) for chemical lactate [CMRlac = (CBF) (a-v)lac] over time in patients with severe TBI. To illustrate the change in CMRlac over time, data presented as percentage of patients demonstrating net cerebral lactate uptake (i.e., CMRlac < 0, white area) compared percentage of patients demonstrating cerebral net lactate release (i.e., CMRlac > 0, dark area). Patients display wide variability and significant changes over time with regression to control values of net cerebral lactate release over time. As illustrated in Figure 1, CMRlac underestimates total lactate production. Redrawn from Glenn et al. (2003) and ongoing studies with control values courtesy of T. C. Glenn.
Figure 3
Figure 3
Arterial glucose (A) and lactate concentrations (B) in control and TBI patients. Values were constant over time, so mean values for min 60, 90, and 120 min are shown. Solid lines represent TBI patients (n = 12) while dashed lines are normal control subjects (n = 6). This and subsequent figures depict the following components: median (light circle), mean (dark circle), standard deviation (heavy vertical bar), box-plot whisker (thin vertical bar) and a kernel density estimation of the data distribution (replacing the box-plot's rectangular depiction) following Hintze and Nelson (1998) as visualized by R package “Caroline” (Schruth, 2012). When coincident, the median circle symbol obscures the mean symbol. TBI patients demonstrated arterial glucose and lactate levels similar to those in healthy control subjects. From Glenn et al. (2014).
Figure 4
Figure 4
Cerebral metabolic rates (CMR) for glucose (A) and lactate (B), in control and TBI patients; CMR = (Metabolite AVD) (Cerebral Blood Flow), alternatively termed net exchange. Values were constant over time, so mean values for min 60, 90, and 120 min are shown. Solid lines represent TBI patients (n = 12) while dashed lines are normal control subjects (n–6); other aspects of the figure described in the legend to Figure 3, above. Figures show net glucose uptake and net lactate release. Compared to values in controls, CMRgluc, but not CMRlac, was depressed in TBI patients. From Glenn et al. (2015).
Figure 5
Figure 5
Hepatic (+ renal) glucose production, Ra (A) and body lactate appearance rate (B) in control and TBI patients. Values were constant over time, so mean values for min 60, 90, and 120 min are shown. Solid lines represent TBI patients while dashed lines are normal control subjects. Due to variability in TBI patients, the tendency for higher glucose production was NSD (P = 0.06). However, whole-body production was ≈ 90% higher in TBI patients than healthy controls (P < 0.01). From (Glenn et al., 2014).
Figure 6
Figure 6
Percent contribution of lactate to glucose production (gluconeogenesis, GNG) in healthy controls (dashed lines, n = 6) and TBI patients (solid lines, n = 12). Values significantly greater following TBI, p < 0.05. Trauma caused a major change in gluconeogenesis from lactate. From Glenn et al. (2014).
Figure 7
Figure 7
By supporting gluconeogenesis, lactate indirectly supports CMR glucose. The relative contributions to CMR glucose from hepatic gluconeogenesis (GNG), and glucose from hepatic glycogenolysis in healthy control subjects (Left, A), and TBI patients (Right, B). A comparison of (A) (control) and (B) (TBI) shows the large increase in percentage cerebral glucose uptake contributed by GNG from lactate following TBI. From (Glenn et al., 2015).
Figure 8
Figure 8
Cerebral lactate fractional extraction (A) and tracer-measured cerebral lactate uptake (B) in healthy control subjects and TBI patients. Solid lines represent TBI patients while dashed lines are normal control subjects. Both fractional extraction and lactate uptake are preserved in TBI patients indicating plausibility of increasing cerebral lactate uptake by raising arterial [lactate] by means of exogenous lactate infusion. From (Glenn et al., 2015).
Figure 9
Figure 9
Components of cerebral lactate metabolism: Release (CMRlac), Tracer-Measured Uptake and Total Cerebral Lactate Production = TMU-CMRlac. Solid lines represent TBI patients while dashed lines are normal control subjects. The use of [13-13C]lactate tracer allow a very different view of cerebral lact production. Should CMRlac be taken as a measure of lactate production, total lactate production would be grossly underestimated. Regardless, whether estimated from CMR or total lactate production, control subjects and TBI patients show similar capacities for lactate uptake, release and production. From Glenn et al. (2015).
Figure 10
Figure 10
Cerebral lactate Oxidation in control and TBI patients. Values given in relative terms (% lactate uptake that is oxidized). Lactate taken up by healthy controls and TBI patients is oxidized directly within the tissue. Values corrected for the contribution to cerebral release of 13CO2 from the oxidation of 13C-glucose produced from circulating [3-13C]lactate. From (Glenn et al., 2015).
Figure 11
Figure 11
Absolute and relative contributions to total cerebral carbohydrate (CHO) from lactate, glucose from gluconeogenesis (GNG), and glucose from hepatic glycogenolysis (GLY = Glucose Ra – GNGgluc) in healthy control subjects (Left, A), and TBI patients (Right, B). Compared to (A), panel (B) shows the decrease in total CHO use and CMRgluc following TBI, but increased contributions of lactate and glucose from GNG to total cerebral CHO uptake after TBI. A comparison of (A) (control) and (B) (TBI) shows the large increase in percentage cerebral CHO uptake contributed by lactate, directly, or indirectly, in comparison to healthy controls who have hepatic GLY available for to support CMRgluc. From Glenn et al. (2015).

Similar articles

Cited by

References

    1. Ahlborg G., Felig P. (1982). Lactate and glucose exchange across the forearm, legs, and splanchnic bed during and after prolonged leg exercise. J. Clin. Invest. 69, 45–54. 10.1172/JCI110440 - DOI - PMC - PubMed
    1. Alessandri B., Schwandt E., Kamada Y., Nagata M., Heimann A., Kempski O. (2012). The neuroprotective effect of lactate is not due to improved glutamate uptake after controlled cortical impact in rats. J. Neurotrauma 29, 2181–2191. 10.1089/neu.2011.2067 - DOI - PubMed
    1. Bartnik B. L., Sutton R. L., Fukushima M., Harris N. G., Hovda D. A., Lee S. M. (2005). Upregulation of pentose phosphate pathway and preservation of tricarboxylic acid cycle flux after experimental brain injury. J. Neurotrauma 22, 1052–1065. 10.1089/neu.2005.22.1052 - DOI - PubMed
    1. Bergman B. C., Butterfield G. E., Wolfel E. E., Lopaschuk G. D., Casazza G. A., Horning M. A., et al. . (1999a). Muscle net glucose uptake and glucose kinetics after endurance training in men. Am. J. Physiol. 277(1 Pt 1): E81–E92. - PubMed
    1. Bergman B. C., Tsvetkova T., Lowes B., Wolfel E. E. (2009). Myocardial glucose and lactate metabolism during rest and atrial pacing in humans. J. Physiol. 587(Pt 9): 2087–2099. 10.1113/jphysiol.2008.168286 - DOI - PMC - PubMed