Activation of the mouse primary visual cortex by medial prefrontal subregion stimulation is not mediated by cholinergic basalo-cortical projections
- PMID: 25709570
- PMCID: PMC4321436
- DOI: 10.3389/fnsys.2015.00001
Activation of the mouse primary visual cortex by medial prefrontal subregion stimulation is not mediated by cholinergic basalo-cortical projections
Abstract
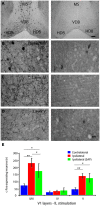
The medial prefrontal cortex (mPFC) exerts top-down control of primary visual cortex (V1) activity. As there is no direct neuronal projection from mPFC to V1, this functional connection may use an indirect route, i.e., via basalo-cortical cholinergic projections. The cholinergic projections to V1 originate from neurons in the horizontal limb of the diagonal band of Broca (HDB), which receive neuronal projections from the ventral part of the mPFC, composed of prelimbic (PrL) and infralimbic cortices (IL). Therefore, the objective of this study was to determine whether electrical stimulation of mice mPFC subregions activate (1) V1 neurons; and (2) HDB cholinergic neurons, suggesting that the HDB serves as a relay point in the mPFC-V1 interaction. Neuronal activation was quantified using c-Fos immunocytochemistry or thallium autometallography for each V1 layer using automated particle analysis tools and optical density measurement. Stimulation of IL and PrL induced significantly higher c-Fos expression or thallium labeling in layers II/III and V of V1 in the stimulated hemisphere only. A HDB cholinergic neuron-specific lesion by saporin administration reduced IL-induced c-Fos expression in layers II/III of V1 but not in layer V. However, there was no c-Fos expression or thallium labeling in the HDB neurons, suggesting that this area was not activated by IL stimulation. Stimulation of another mPFC subarea, the anterior cingulate cortex (AC), which is involved in attention and receives input from V1, activated neither V1 nor HDB. The present results indicate that IL and PrL, but not AC, stimulation activates V1 with the minor involvement of the HDB cholinergic projections. These results suggest a functional link between the ventral mPFC and V1, but this function is only marginally supported by HDB cholinergic neurons and may involve other brain regions.
Keywords: autometallography; basal forebrain; cholinergic neurons; immunocytochemistry; neuronal activity; prefrontal cortex; thallium; visual cortex.
Figures


Similar articles
-
Basal Forebrain Nuclei Display Distinct Projecting Pathways and Functional Circuits to Sensory Primary and Prefrontal Cortices in the Rat.Front Neuroanat. 2018 Aug 15;12:69. doi: 10.3389/fnana.2018.00069. eCollection 2018. Front Neuroanat. 2018. PMID: 30158859 Free PMC article.
-
Topographic Organization of Cholinergic Innervation From the Basal Forebrain to the Visual Cortex in the Rat.Front Neural Circuits. 2018 Mar 8;12:19. doi: 10.3389/fncir.2018.00019. eCollection 2018. Front Neural Circuits. 2018. PMID: 29662442 Free PMC article.
-
Basal Forebrain Projections to the Retrosplenial and Cingulate Cortex in Rats.J Comp Neurol. 2025 Feb;533(2):e70027. doi: 10.1002/cne.70027. J Comp Neurol. 2025. PMID: 39924777 Free PMC article.
-
The Medial Prefrontal Cortex as a Central Hub for Mental Comorbidities Associated with Chronic Pain.Int J Mol Sci. 2020 May 13;21(10):3440. doi: 10.3390/ijms21103440. Int J Mol Sci. 2020. PMID: 32414089 Free PMC article. Review.
-
Projections of the Mouse Primary Visual Cortex.Front Neural Circuits. 2021 Nov 19;15:751331. doi: 10.3389/fncir.2021.751331. eCollection 2021. Front Neural Circuits. 2021. PMID: 34867213 Free PMC article. Review.
Cited by
-
Paraventricular nucleus-Medullary interactions: How they help enable endocrine responses to metabolic stress.Curr Opin Endocr Metab Res. 2022 Dec;27:100401. doi: 10.1016/j.coemr.2022.100401. Epub 2022 Aug 18. Curr Opin Endocr Metab Res. 2022. PMID: 39575062 Free PMC article.
-
Neural ensembles in the murine medial prefrontal cortex process distinct information during visual perceptual learning.BMC Biol. 2023 Feb 24;21(1):44. doi: 10.1186/s12915-023-01529-x. BMC Biol. 2023. PMID: 36829186 Free PMC article.
-
Basal Forebrain Cholinergic Circuits and Signaling in Cognition and Cognitive Decline.Neuron. 2016 Sep 21;91(6):1199-1218. doi: 10.1016/j.neuron.2016.09.006. Neuron. 2016. PMID: 27657448 Free PMC article. Review.
-
Local connections among excitatory neurons underlie characteristics of enriched environment exposure-induced neuronal response modulation in layers 2/3 of the mouse V1.Front Syst Neurosci. 2025 Feb 19;19:1525717. doi: 10.3389/fnsys.2025.1525717. eCollection 2025. Front Syst Neurosci. 2025. PMID: 40046289 Free PMC article.
-
Multisensory Integration: Is Medial Prefrontal Cortex Signaling Relevant for the Treatment of Higher-Order Visual Dysfunctions?Front Mol Neurosci. 2022 Jan 17;14:806376. doi: 10.3389/fnmol.2021.806376. eCollection 2021. Front Mol Neurosci. 2022. PMID: 35110996 Free PMC article. Review.
References
-
- Arckens L., Van Der Gucht E., Eysel U. T., Orban G. A., Vandesande F. (2000). Investigation of cortical reorganization in area 17 and nine extrastriate visual areas through the detection of changes in immediate early gene expression as induced by retinal lesions. J. Comp. Neurol. 425, 531–544. 10.1002/1096-9861(20001002)425:4<531::aid-cne5>3.0.co;2-j - DOI - PubMed
LinkOut - more resources
Full Text Sources
Other Literature Sources
Research Materials

