

Movement patterns of an arboreal marsupial at the edge of its range: a case study of the koala
- PMID: 25709822
- PMCID: PMC4337771
- DOI: 10.1186/2051-3933-1-8
Movement patterns of an arboreal marsupial at the edge of its range: a case study of the koala
Abstract
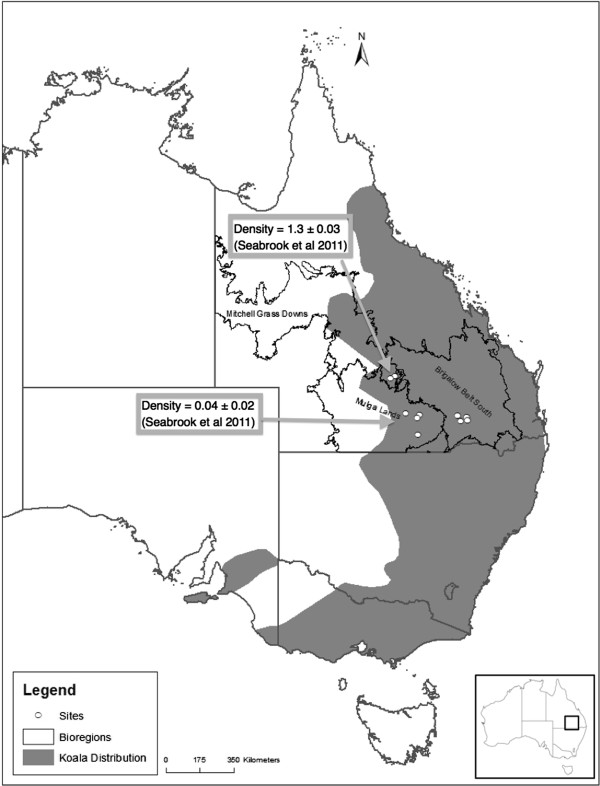
Background: Conservation strategies derived from research carried out in one part of the range of a widely distributed species and then uniformly applied over multiple regions risk being ineffective due to regional variations in species-habitat relationships. This is particularly true at the edge of the range where information on animal movements and resource selection is often limited. Here, we investigate home range size, movement patterns and resource selection of koalas Phascolarctos cinereus in the semi-arid and arid landscapes of southwest Queensland, Australia. We placed collars with GPS units on 21 koalas in three biogeographic regions. Home range sizes, resource selection and movement patterns were examined across the three regions.
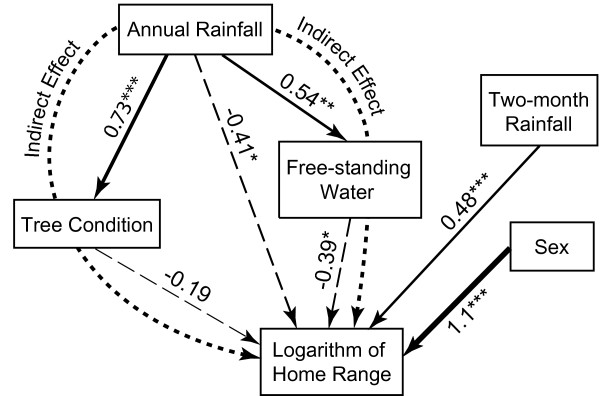
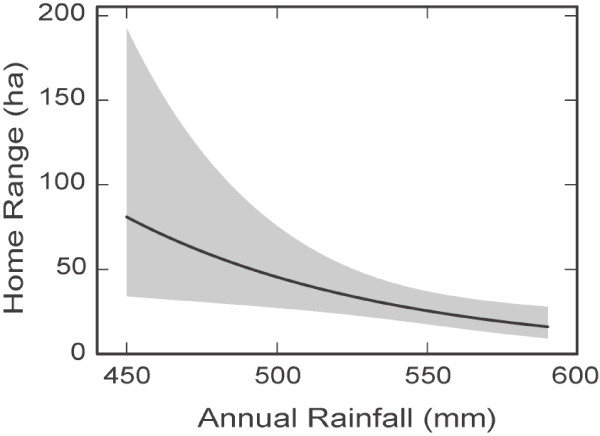
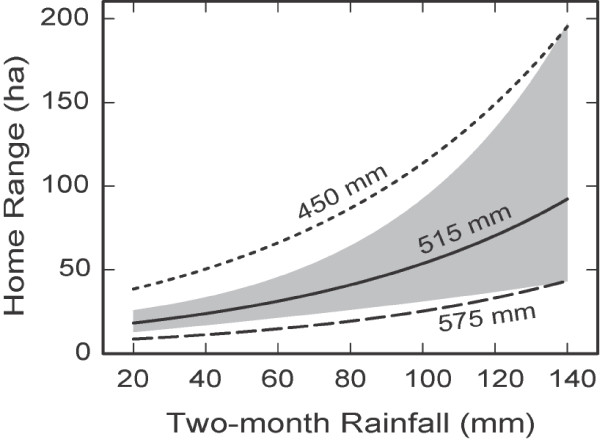
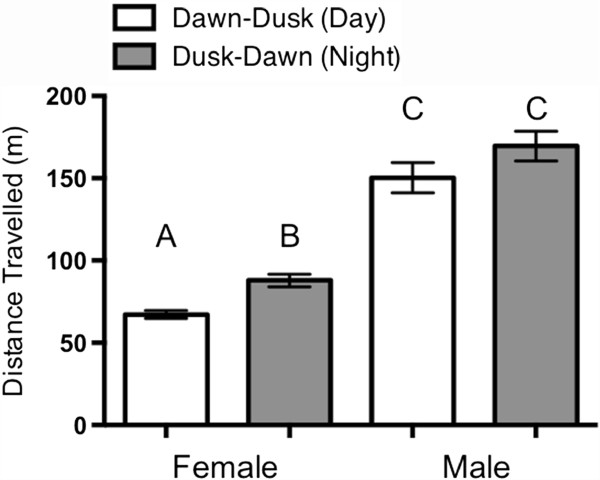
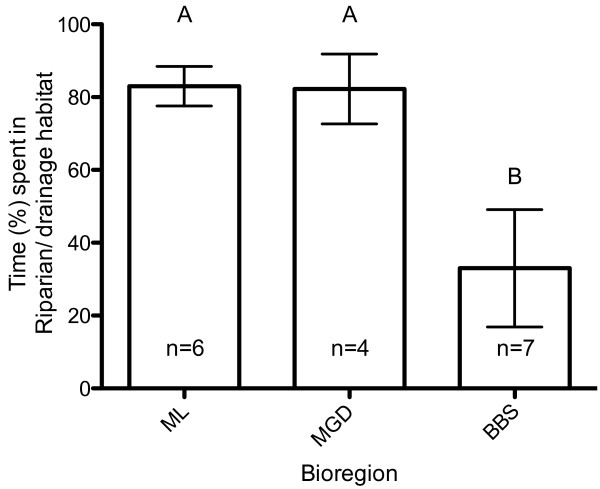
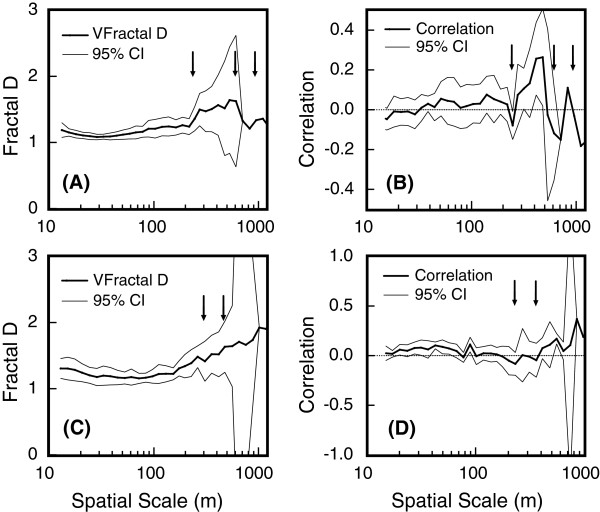
Results: Habitat selectivity was highest at the more arid, western edge of the koala's range with their occupancy restricted to riparian/drainage line habitats, while the more easterly koalas displayed more variability in habitat use. There was no significant difference between home range sizes of koalas at the western edge of the range compared to the more easterly koalas. Instead, variability in home range size was attributed to spatial variations in habitat quality or the availability of a key resource, with a strong influence of rainfall and the presence of freestanding water on the home range size of koalas. Within a 580 m spatial range, movement patterns of male and female paths showed a tortuous trend, consistent with foraging behavior. Beyond this spatial range, male paths showed a trend to more linear patterns, representing a transition of movement behavior from foraging to breeding and dispersal.
Conclusions: The difference in home range movement patterns and resource use among the different koala populations shows that behavior changes with proximity to the arid edge of the koala's range. Changes in home range size and resource use near the range edge highlight the importance of further range-edge studies for informing effective koala conservation and management actions, especially when developing species-specific adaptation responses to climate change.
Keywords: Australia; Home range; Koala; Resource selection; Semi-arid; Spatial distribution.
Figures
Similar articles
-
Home ranges and movements of an arboreal folivore after wildfire: comparing rehabilitated and non-rehabilitated animals in burnt and unburnt woodlands.Mov Ecol. 2024 Dec 3;12(1):75. doi: 10.1186/s40462-024-00519-0. Mov Ecol. 2024. PMID: 39627876 Free PMC article.
-
Association of maternal genetics with the gut microbiome and eucalypt diet selection in captive koalas.PeerJ. 2024 May 27;12:e17385. doi: 10.7717/peerj.17385. eCollection 2024. PeerJ. 2024. PMID: 38818452 Free PMC article.
-
Genomics identifies koala populations at risk across eastern Australia.Ecol Appl. 2025 Jan;35(1):e3062. doi: 10.1002/eap.3062. Epub 2024 Nov 29. Ecol Appl. 2025. PMID: 39611546 Free PMC article.
-
Koala Genome Survey: An Open Data Resource to Improve Conservation Planning.Genes (Basel). 2023 Feb 22;14(3):546. doi: 10.3390/genes14030546. Genes (Basel). 2023. PMID: 36980819 Free PMC article.
-
Distribution models for koalas in South Australia using citizen science-collected data.Ecol Evol. 2014 Jun;4(11):2103-14. doi: 10.1002/ece3.1094. Epub 2014 Apr 28. Ecol Evol. 2014. PMID: 25360252 Free PMC article. Review.
Cited by
-
Genomic comparisons reveal biogeographic and anthropogenic impacts in the koala (Phascolarctos cinereus): a dietary-specialist species distributed across heterogeneous environments.Heredity (Edinb). 2019 May;122(5):525-544. doi: 10.1038/s41437-018-0144-4. Epub 2018 Sep 12. Heredity (Edinb). 2019. PMID: 30209291 Free PMC article.
-
Physiological stress in koala populations near the arid edge of their distribution.PLoS One. 2013 Nov 12;8(11):e79136. doi: 10.1371/journal.pone.0079136. eCollection 2013. PLoS One. 2013. PMID: 24265749 Free PMC article.
-
Resident wild koalas show resilience to large-scale translocation of bushfire-rescued koalas.Conserv Physiol. 2023 Jan 28;11(1):coac088. doi: 10.1093/conphys/coac088. eCollection 2023. Conserv Physiol. 2023. PMID: 36726864 Free PMC article.
-
Home ranges and movements of an arboreal folivore after wildfire: comparing rehabilitated and non-rehabilitated animals in burnt and unburnt woodlands.Mov Ecol. 2024 Dec 3;12(1):75. doi: 10.1186/s40462-024-00519-0. Mov Ecol. 2024. PMID: 39627876 Free PMC article.
-
Range Measurement and a Habitat Suitability Map for the Norway Rat in a Highly Developed Urban Environment.Trop Life Sci Res. 2015 Dec;26(2):27-44. Trop Life Sci Res. 2015. PMID: 26868708 Free PMC article.
References
-
- McAlpine CA, Rhodes JR, Bowen ME, Lunney D, Callaghan JG, Mitchell DL, Possingham HP. Can multiscale models of species' distribution be generalized from region to region? A case study of the koala. J Appl Ecol. 2008;45:558–567. doi: 10.1111/j.1365-2664.2007.01431.x. - DOI
-
- Romeo C, Wauters LA, Preatoni D, Tosi G, Marti- noli A. Living on the edge: space use of Eurasian red squirrels in marginal high-elevation habitat. Acta Oncol. 2010;36:604–610.
-
- Pitt JA. The edge of a species' range: survival and space-use patterns of raccoons at the northern periphery of their distribution. University of Saskatchewan: Department of Biology; 2006.
LinkOut - more resources
Full Text Sources
Other Literature Sources
