On-chip picosecond pulse detection and generation using graphene photoconductive switches
- PMID: 25710079
- PMCID: PMC4370719
- DOI: 10.1021/nl504116w
On-chip picosecond pulse detection and generation using graphene photoconductive switches
Abstract
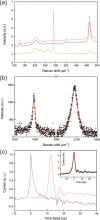
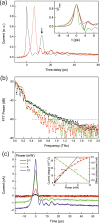
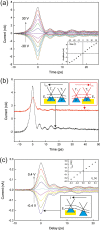
We report on the use of graphene for room temperature on-chip detection and generation of pulsed terahertz (THz) frequency radiation, exploiting the fast carrier dynamics of light-generated hot carriers, and compare our results with conventional low-temperature-grown gallium arsenide (LT-GaAs) photoconductive (PC) switches. Coupling of picosecond-duration pulses from a biased graphene PC switch into Goubau line waveguides is also demonstrated. A Drude transport model based on the transient photoconductance of graphene is used to describe the mechanism for both detection and generation of THz radiation.
Keywords: GaAs; Goubau line; Graphene; THz detection; on-chip; photoconductive switch.
Figures


Similar articles
-
Strongly enhanced THz generation enabled by a graphene hot-carrier fast lane.Nat Commun. 2022 Oct 27;13(1):6404. doi: 10.1038/s41467-022-34170-3. Nat Commun. 2022. PMID: 36302852 Free PMC article.
-
Effects of two-photon absorption on terahertz radiation generated by femtosecond-laser excited photoconductive antennas.Opt Express. 2011 Nov 21;19(24):23689-97. doi: 10.1364/OE.19.023689. Opt Express. 2011. PMID: 22109395
-
Carbon irradiated semi insulating GaAs for photoconductive terahertz pulse detection.Opt Express. 2015 Mar 9;23(5):6656-61. doi: 10.1364/OE.23.006656. Opt Express. 2015. PMID: 25836882
-
An Integrated Germanium-Based THz Impulse Radiator with an Optical Waveguide Coupled Photoconductive Switch in Silicon.Micromachines (Basel). 2019 May 31;10(6):367. doi: 10.3390/mi10060367. Micromachines (Basel). 2019. PMID: 31159233 Free PMC article.
-
Intense terahertz generation from photoconductive antennas.Front Optoelectron. 2021 Mar;14(1):64-93. doi: 10.1007/s12200-020-1081-4. Epub 2021 Jan 5. Front Optoelectron. 2021. PMID: 36637784 Free PMC article. Review.
Cited by
-
Ultrafast carrier dynamics in terahertz photoconductors and photomixers: beyond short-carrier-lifetime semiconductors.Nanophotonics. 2022 Mar 10;11(11):2661-2691. doi: 10.1515/nanoph-2021-0785. eCollection 2022 Jun. Nanophotonics. 2022. PMID: 39635674 Free PMC article. Review.
-
Strongly enhanced THz generation enabled by a graphene hot-carrier fast lane.Nat Commun. 2022 Oct 27;13(1):6404. doi: 10.1038/s41467-022-34170-3. Nat Commun. 2022. PMID: 36302852 Free PMC article.
-
Ultrafast terahertz emission from emerging symmetry-broken materials.Light Sci Appl. 2023 Jun 1;12(1):133. doi: 10.1038/s41377-023-01163-w. Light Sci Appl. 2023. PMID: 37258515 Free PMC article. Review.
References
-
- Novoselov K. S.; Geim A. K.; Morozov S. V.; Jiang D.; Zhang Y.; Dubonos S. V.; Grigorieva I. V.; Firsov A. A. Science 2004, 306, 666. - PubMed
-
- Morozov S. V.; Novoselov K. S.; Katsnelson M. I.; Schedin F.; Elias D. C.; Jaszczak J. A.; Geim A. K. Phys. Rev. Lett. 2008, 100, 016602. - PubMed
-
- Dean C. R.; Young A. F.; Meric I.; Lee C.; Wang L.; Sorgenfrei S.; Watanabe K.; Taniguchi T.; Kim P.; Shepard K. L.; Hone J. Nat. Nanotechnol. 2010, 5, 722. - PubMed
-
- Nair R. R.; Blake P.; Grigorenko A. N.; Novoselov K. S.; Booth T. J.; Stauber T.; R. Peres N. M.; Geim A. K. Science 2008, 320, 1308. - PubMed
-
- Bonaccorso F.; Sun Z.; Hasan T.; Ferrari A. C. Nat. Photonics 2010, 4, 611.
Publication types
LinkOut - more resources
Full Text Sources
Other Literature Sources

