. 2015 Jun;11 Suppl 2(Suppl 2):252-7; discussion 257-8.
doi: 10.1227/NEU.0000000000000681.

Integration of indocyanine green videoangiography with operative microscope: augmented reality for interactive assessment of vascular structures and blood flow

Affiliations

Integration of indocyanine green videoangiography with operative microscope: augmented reality for interactive assessment of vascular structures and blood flow

Nikolay L Martirosyan et al. Neurosurgery. 2015 Jun.

Abstract

Background: Preservation of adequate blood flow and exclusion of flow from lesions are key concepts of vascular neurosurgery. Indocyanine green (ICG) fluorescence videoangiography is now widely used for the intraoperative assessment of vessel patency.

Objective: Here, we present a proof-of-concept investigation of fluorescence angiography with augmented microscopy enhancement: real-time overlay of fluorescence videoangiography within the white light field of view of conventional operative microscopy.

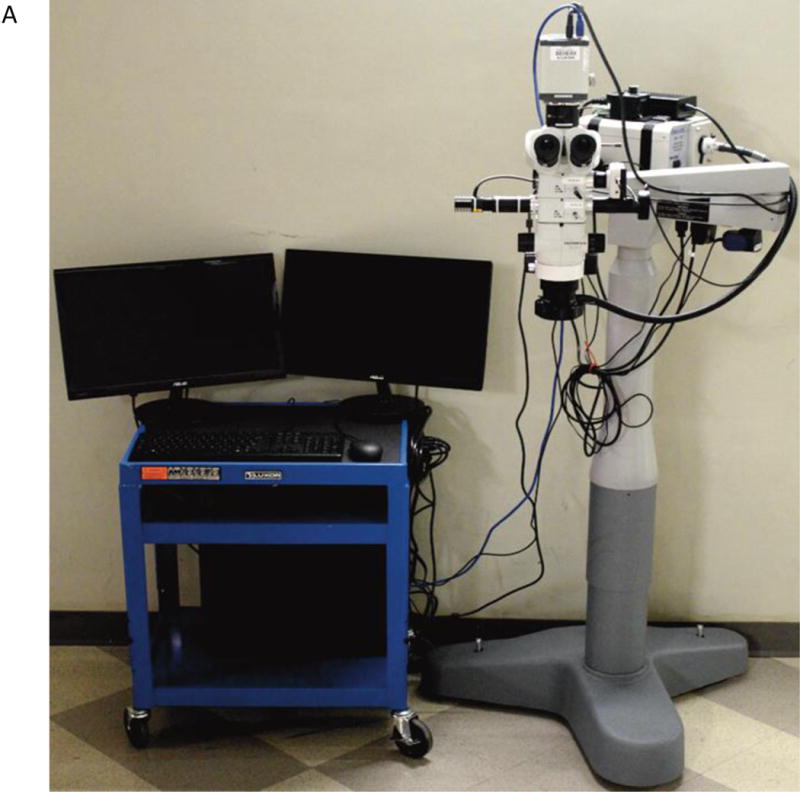
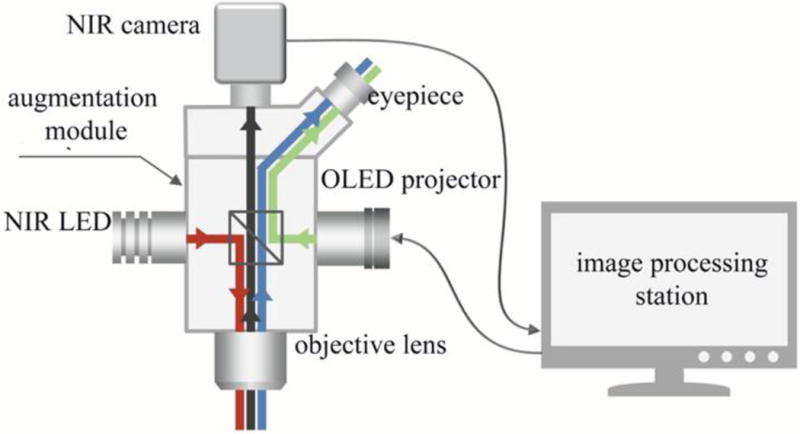
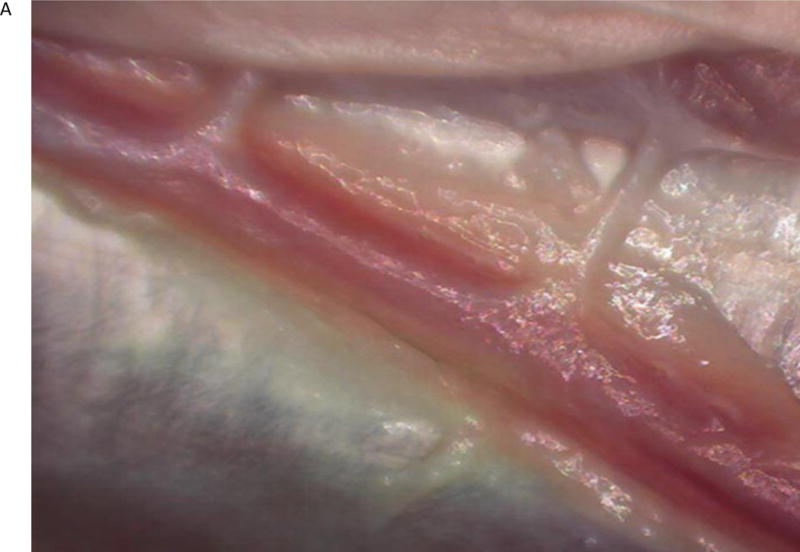
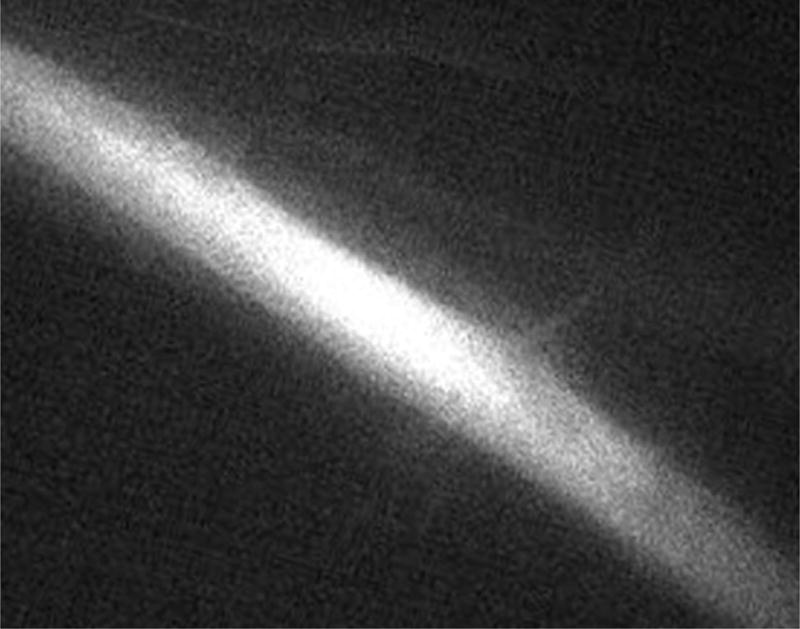
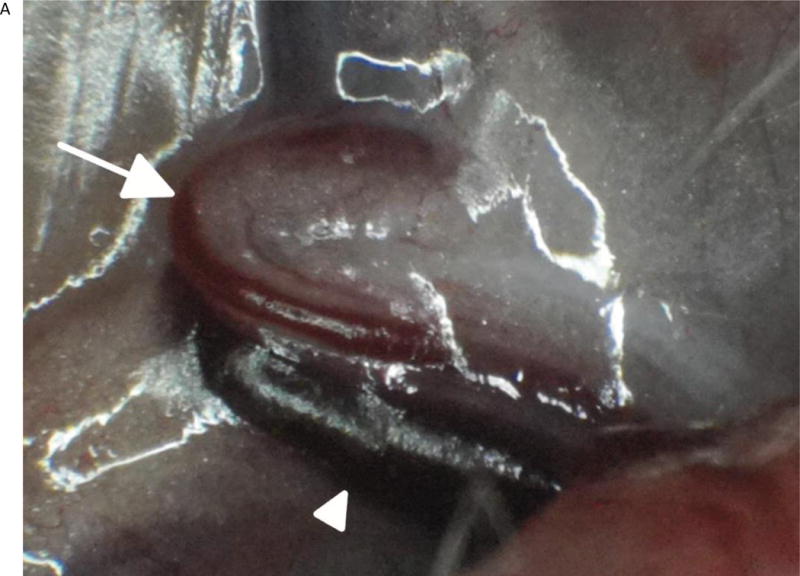
Methods: The femoral artery was exposed in 7 anesthetized rats. The dissection microscope was augmented to integrate real-time electronically processed near-infrared filtered images with conventional white light images seen through the standard oculars. This was accomplished by using an integrated organic light-emitting diode display to yield superimposition of white light and processed near-infrared images. ICG solution was injected into the jugular vein, and fluorescent femoral artery flow was observed.

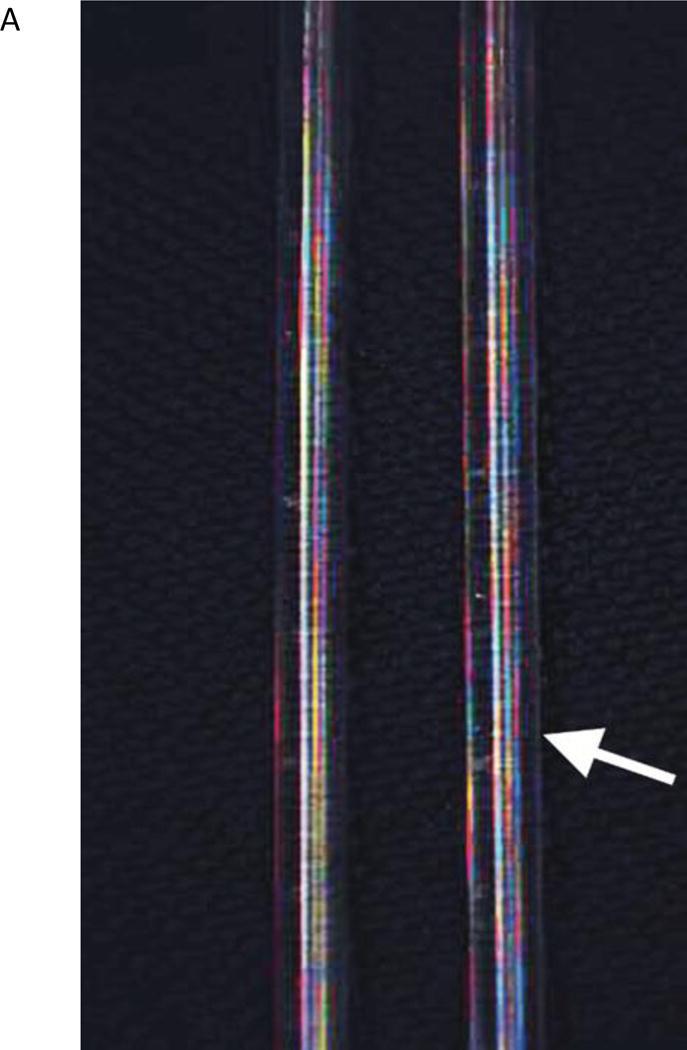
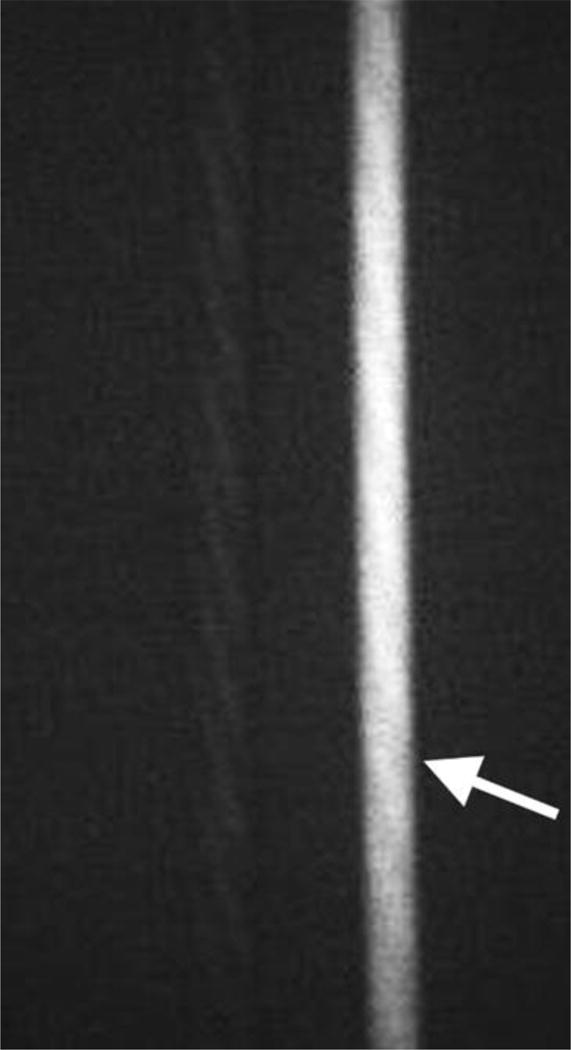
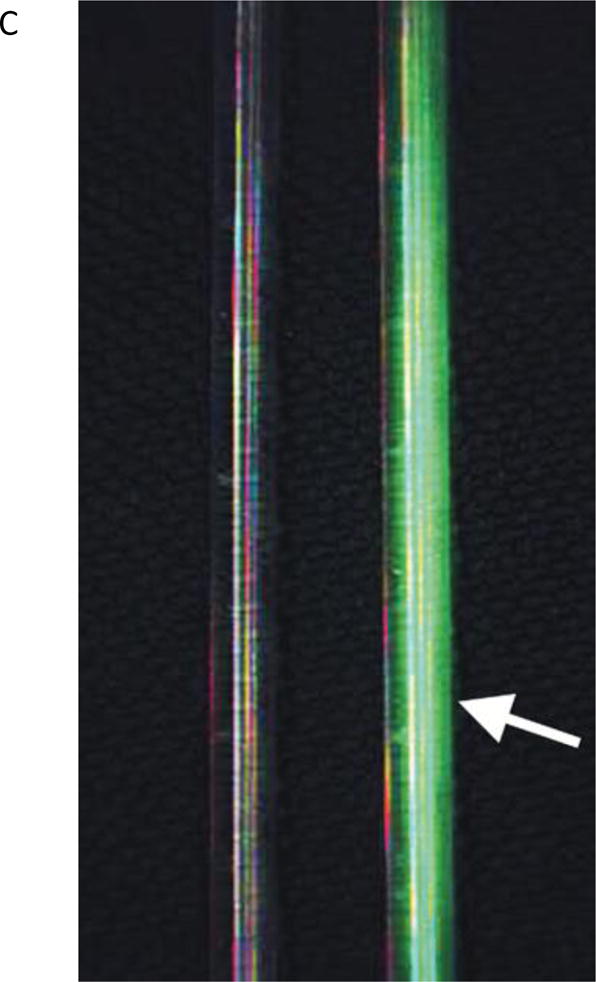
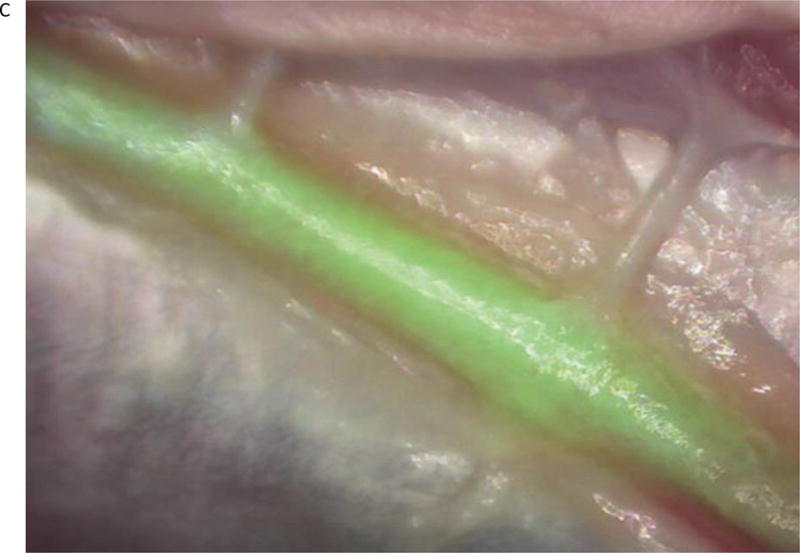
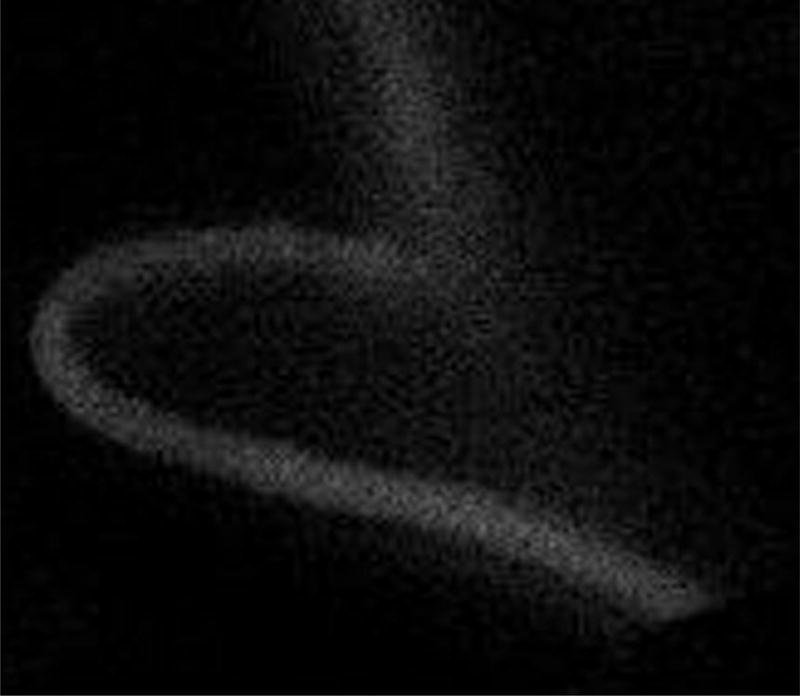
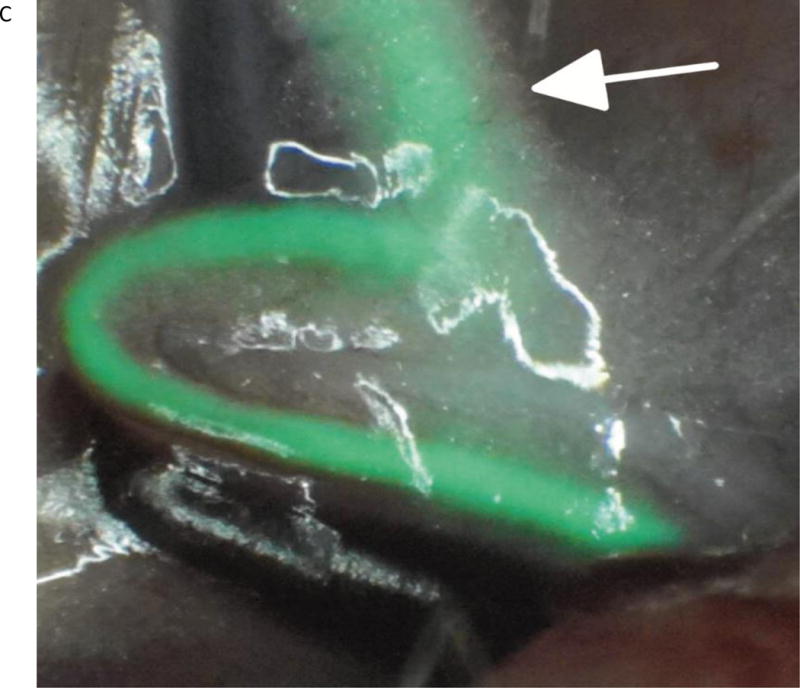
Results: Fluorescence angiography with augmented microscopy enhancement was able to detect ICG fluorescence in a small artery of interest. Fluorescence appeared as a bright-green signal in the ocular overlaid with the anatomic image and limited to the anatomic borders of the femoral artery and its branches. Surrounding anatomic structures were clearly visualized. Observation of ICG within the vessel lumens permitted visualization of the blood flow. Recorded video loops could be reviewed in an offline mode for more detailed assessment of the vasculature.

Conclusion: The overlay of fluorescence videoangiography within the field of view of the white light operative microscope allows real-time assessment of the blood flow within vessels during simultaneous surgical manipulation. This technique could improve intraoperative decision making during complex neurovascular procedures.


Figures

Figure 1
Figure 1
(A) Stereomicroscope modified for FAAME. (B) The optical scheme for the augmented fluorescence microscope. The light from a high power NIR LED is inserted into the microscope optical path using a dichroic mirror (red line). The resulting NIR fluorescence image is separated from the optical path of the microscope by a NIR band pass filter (black line). NIR fluorescence images were captured by the NIR CCD camera and converted into visible green pseudo-color images using the image processing station and a monochromatic OLED projector. The OLED projects the fluorescence image onto a half-mirror placed in the ocular of the microscope, where the processed (synthetic) image overlays with the original (real) visible light image from the objective (green line) to produce augmented, or composite, images. FAAME – fluorescence angiography with augmented microscopy enhancement, NIR – near infrared, LED – light emitting diode, OLED – organic light emitting diode.
Figure 1
Figure 1
(A) Stereomicroscope modified for FAAME. (B) The optical scheme for the augmented fluorescence microscope. The light from a high power NIR LED is inserted into the microscope optical path using a dichroic mirror (red line). The resulting NIR fluorescence image is separated from the optical path of the microscope by a NIR band pass filter (black line). NIR fluorescence images were captured by the NIR CCD camera and converted into visible green pseudo-color images using the image processing station and a monochromatic OLED projector. The OLED projects the fluorescence image onto a half-mirror placed in the ocular of the microscope, where the processed (synthetic) image overlays with the original (real) visible light image from the objective (green line) to produce augmented, or composite, images. FAAME – fluorescence angiography with augmented microscopy enhancement, NIR – near infrared, LED – light emitting diode, OLED – organic light emitting diode.
Figure 2
Figure 2
The in vitro images showing two glass tubes, one filled with saline and another with ICG solution (arrow). All images captured using FAAME. (A) Image obtained using visible optical path only. The saline and ICG filled tubes cannot be distinguished. (B) Image obtained using NIR path only. ICG fluorescence pattern delineates the glass tube shape. The saline filled tube cannot be clearly identified. (C) Image obtained by augmentation of the visible light with NIR fluorescence. The saline filled tube appears identical to white light image. Bright ICG fluorescence corresponds to the shape glass tube. NIR – near infrared, ICG – indocyanine green.
Figure 2
Figure 2
The in vitro images showing two glass tubes, one filled with saline and another with ICG solution (arrow). All images captured using FAAME. (A) Image obtained using visible optical path only. The saline and ICG filled tubes cannot be distinguished. (B) Image obtained using NIR path only. ICG fluorescence pattern delineates the glass tube shape. The saline filled tube cannot be clearly identified. (C) Image obtained by augmentation of the visible light with NIR fluorescence. The saline filled tube appears identical to white light image. Bright ICG fluorescence corresponds to the shape glass tube. NIR – near infrared, ICG – indocyanine green.
Figure 3
Figure 3
The ex vivo FAAME images of the turkey wing after ICG injection into brachial artery. (A) Image obtained using white light path only. Dissected brachial artery is seen within field of view. (B) Image obtained using NIR path only. ICG fluorescence pattern delineates anatomical boundaries of the brachial artery. The surrounding anatomical structures are not visible. (C) Image obtained by augmentation of the visible light with NIR fluorescence. The ICG fluorescence pattern and surrounding anatomical structures are seen within the field of view. NIR – near infrared, ICG – indocyanine green.
Figure 3
Figure 3
The ex vivo FAAME images of the turkey wing after ICG injection into brachial artery. (A) Image obtained using white light path only. Dissected brachial artery is seen within field of view. (B) Image obtained using NIR path only. ICG fluorescence pattern delineates anatomical boundaries of the brachial artery. The surrounding anatomical structures are not visible. (C) Image obtained by augmentation of the visible light with NIR fluorescence. The ICG fluorescence pattern and surrounding anatomical structures are seen within the field of view. NIR – near infrared, ICG – indocyanine green.
Figure 4
Figure 4
The in vivo images using FAAME of the femoral artery of the rat after ICG injection into jugular vein. (A) Image obtained using white light path only. Exposed femoral artery (arrow) and femoral vein (arrowhead) are visible within the field of view. (B) Image obtained using NIR path only. ICG fluorescence is observed within anatomical borders of femoral artery. The surrounding anatomical structures cannot be identified. (C) Image obtained by augmentation of the visible light with NIR fluorescence. The anatomical structures within the field of view can be identified. The ICG fluorescence appears as a bright green signal within anatomical borders of the femoral artery. The segment of the femoral artery covered by fat and connective tissue is clearly delineated (arrow). NIR – near infrared, ICG – indocyanine green.
Figure 4
Figure 4
The in vivo images using FAAME of the femoral artery of the rat after ICG injection into jugular vein. (A) Image obtained using white light path only. Exposed femoral artery (arrow) and femoral vein (arrowhead) are visible within the field of view. (B) Image obtained using NIR path only. ICG fluorescence is observed within anatomical borders of femoral artery. The surrounding anatomical structures cannot be identified. (C) Image obtained by augmentation of the visible light with NIR fluorescence. The anatomical structures within the field of view can be identified. The ICG fluorescence appears as a bright green signal within anatomical borders of the femoral artery. The segment of the femoral artery covered by fat and connective tissue is clearly delineated (arrow). NIR – near infrared, ICG – indocyanine green.

References

    1. Karhunen PJ. Neurosurgical vascular complications associated with aneurysm clips evaluated by postmortem angiography. Forensic Sci Int. 1991 Oct;51(1):13–22. - PubMed
    1. Siasios I, Kapsalaki EZ, Fountas KN. The role of intraoperative micro-Doppler ultrasound in verifying proper clip placement in intracranial aneurysm surgery. Neuroradiology. 2012 Oct;54(10):1109–1118. - PubMed
    1. Alexander TD, Macdonald RL, Weir B, Kowalczuk A. Intraoperative angiography in cerebral aneurysm surgery: a prospective study of 100 craniotomies. Neurosurgery. 1996 Jul;39(1):10–17. discussion 17–18. - PubMed
    1. Amin-Hanjani S, Meglio G, Gatto R, Bauer A, Charbel FT. The utility of intraoperative blood flow measurement during aneurysm surgery using an ultrasonic perivascular flow probe. Neurosurgery. 2008 Jun;62(6 Suppl 3):1346–1353. - PubMed
    1. Raabe A, Beck J, Gerlach R, Zimmermann M, Seifert V. Near-infrared indocyanine green video angiography: a new method for intraoperative assessment of vascular flow. Neurosurgery. 2003 Jan;52(1):132–139. discussion 139. - PubMed

Publication types