. 2015 Feb 24;12(2):e1001789.
doi: 10.1371/journal.pmed.1001789. eCollection 2015 Feb.

Spatial and temporal heterogeneity in high-grade serous ovarian cancer: a phylogenetic analysis

Affiliations

Spatial and temporal heterogeneity in high-grade serous ovarian cancer: a phylogenetic analysis

Roland F Schwarz et al. PLoS Med. .

Abstract

Background: The major clinical challenge in the treatment of high-grade serous ovarian cancer (HGSOC) is the development of progressive resistance to platinum-based chemotherapy. The objective of this study was to determine whether intra-tumour genetic heterogeneity resulting from clonal evolution and the emergence of subclonal tumour populations in HGSOC was associated with the development of resistant disease.

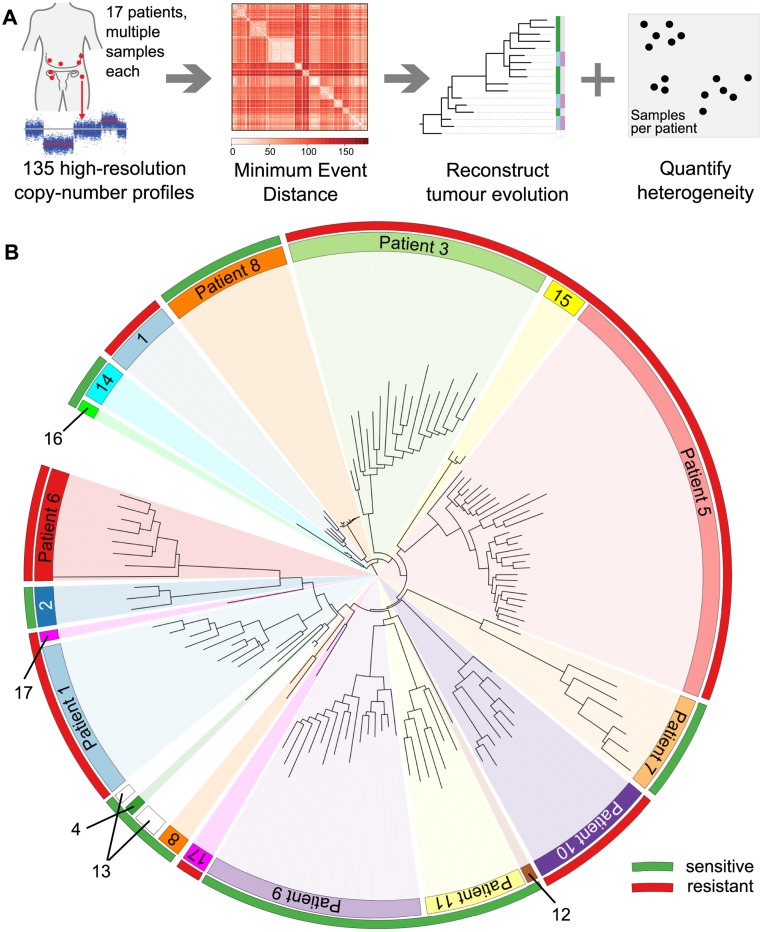
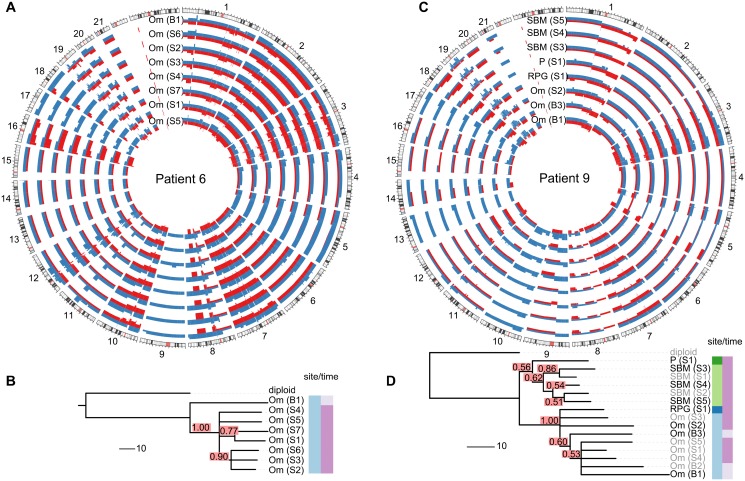
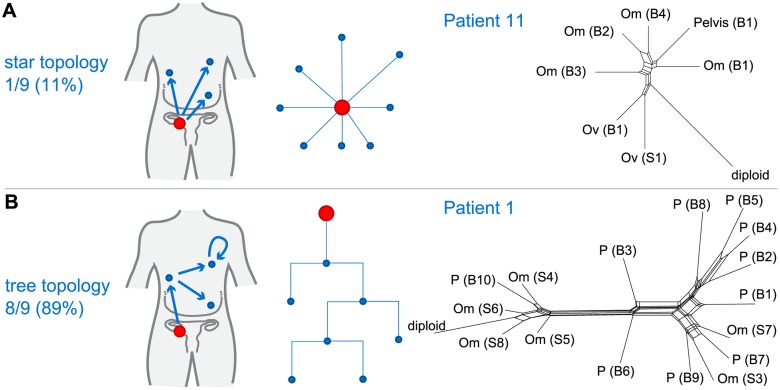
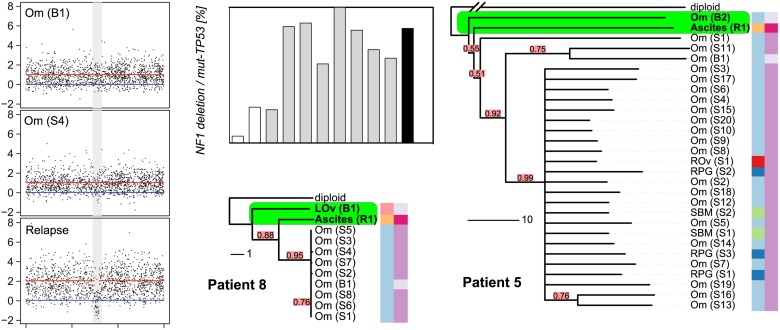
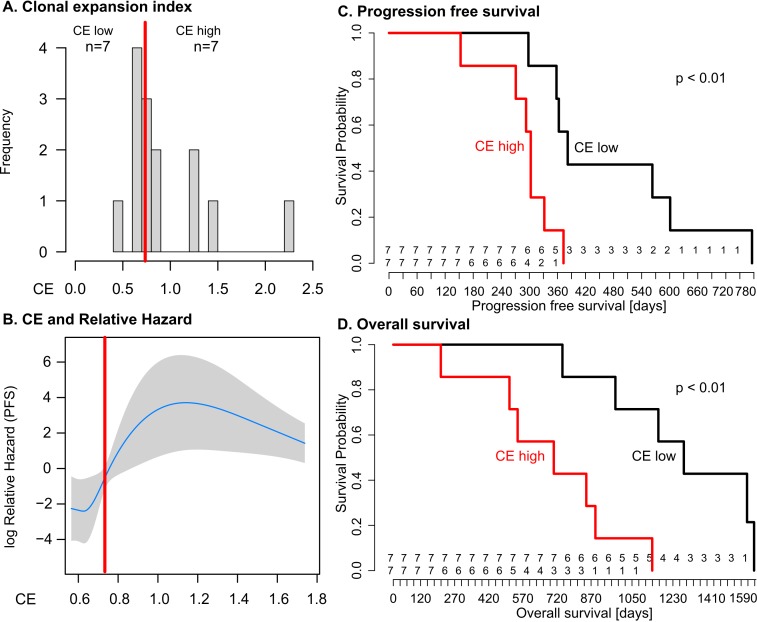
Methods and findings: Evolutionary inference and phylogenetic quantification of heterogeneity was performed using the MEDICC algorithm on high-resolution whole genome copy number profiles and selected genome-wide sequencing of 135 spatially and temporally separated samples from 14 patients with HGSOC who received platinum-based chemotherapy. Samples were obtained from the clinical CTCR-OV03/04 studies, and patients were enrolled between 20 July 2007 and 22 October 2009. Median follow-up of the cohort was 31 mo (interquartile range 22-46 mo), censored after 26 October 2013. Outcome measures were overall survival (OS) and progression-free survival (PFS). There were marked differences in the degree of clonal expansion (CE) between patients (median 0.74, interquartile range 0.66-1.15), and dichotimization by median CE showed worse survival in CE-high cases (PFS 12.7 versus 10.1 mo, p = 0.009; OS 42.6 versus 23.5 mo, p = 0.003). Bootstrap analysis with resampling showed that the 95% confidence intervals for the hazard ratios for PFS and OS in the CE-high group were greater than 1.0. These data support a relationship between heterogeneity and survival but do not precisely determine its effect size. Relapsed tissue was available for two patients in the CE-high group, and phylogenetic analysis showed that the prevalent clonal population at clinical recurrence arose from early divergence events. A subclonal population marked by a NF1 deletion showed a progressive increase in tumour allele fraction during chemotherapy.

Conclusions: This study demonstrates that quantitative measures of intra-tumour heterogeneity may have predictive value for survival after chemotherapy treatment in HGSOC. Subclonal tumour populations are present in pre-treatment biopsies in HGSOC and can undergo expansion during chemotherapy, causing clinical relapse.


Conflict of interest statement

The authors have declared that no competing interests exist.

Figures

Fig 1
Fig 1. Overview of the analysis and the clinical dataset.
(A) Numerical quantification of intra-tumour genetic heterogeneity by evolutionary comparisons. Copy number profiles from 135 metastatic sites were obtained for 17 patients with HGSOC. The MEDICC algorithm was used to compute minimum event distances between profiles and to reconstruct the evolutionary history for each sample, enabling numerical quantification of both spatial and TH and CE for each patient. (B) HGSOC exhibits significant patient-specific intra-tumour genetic heterogeneity. Neighbour-joining tree of all samples based on total copy number. Samples from each patient (coloured inner circular bar) cluster into clades. The outer circular bar indicates HGSOC classified as resistant versus sensitive to treatment based on survival: red, resistant, PFS < 12 mo; green, sensitive, PFS > 12 mo. No immediate clustering of patients into sensitive and resistant subgroups is visible.
Fig 2
Fig 2. Examples of spatial and temporal heterogeneity in HGSOC.
(A and C) Total copy number profiles show strong overall conservation. As examples, a representative subset of the allele-specific genomic copy number profiles of patients 6 and 9 are shown. Separate alleles are indicated in red and blue. (B and D) Genomic changes between biopsy and surgery reveal tumour evolution. The black sample names in the trees indicate the samples shown in the Circos plots. Confidence values for each split are printed in red boxes. The colour-coded bars on the right of the phylogenies indicate different sites (left column) and different sampling times (right column). Branch lengths indicate number of genetic events as determined by MEDICC (scale bar shows ten events). Om, omentum; P, peritoneum; RPG, right paracolic gutter; SBM, small bowel mesentery.
Fig 3
Fig 3. Branching patterns in HGSOC.
(A) Radial pattern of metastatic spread leads to a star topology. The schematic shows how the evolutionary relationships are predicted to have a star-like topology if all metastases (blue) are derived from the primary lesion (red). A neighbour-net representation of the evolutionary distances from patient 11 shows deviation from a tree structure (right). (B) Branched metastatic spread leads to a tree topology. The schematic shows that evolutionary history is predicted to be tree-like if metastases create new metastases (including metastasis-to-metastasis spread). A neighbour-net representation of the distance matrix for patient 1 shows a tree-like structure (right). The number and proportion of patients classified to star or tree topology are shown. Labels on trees indicate site of metastasis (Om, omentum; Ov, ovary; P, peritoneum). Sample identifiers indicate whether the sample was collected from pre-chemotherapy biopsy (B) or interval debulking surgery (S).
Fig 4
Fig 4. Relapse is an early diverged clonal expansion of a low-prevalence subclone of pre-treatment disease.
Array copy number profiles (left) from patient 8 detected a focal NF1 deletion in the relapsed ascites sample that was not observed in the pre-chemotherapy or interval debulking samples. The bar plot shows the results of digital PCR for the NF1 breakpoint from pre-chemotherapy (white bars), interval debulking (grey bars), and relapsed ascites (black) samples. Phylogenetic trees for patients 8 and 5 are shown. The relapsed clonal population for each case is placed next to the pre-chemotherapy biopsy sample, indicating early branching events from the diploid. The length of each branch indicates the degree of divergence. Colour coding and sample identifiers are as for Fig. 3. LOv, left ovary; Om, omentum; SBM, small bowel mesentery; RPG, right paracolic gutter.
Fig 5
Fig 5. Clonal expansion index stratifies patients into prognostic subgroups.
(A) Distribution of CE index over all patients and the respective group sample sizes (n). The red line indicates median CE = 0.73, dichotomizing the cases into equal-sized CE-low and CE-high groups. (B) The relationship between CE and relative hazard is nonlinear. The fit line is generated from the multivariable model incorporating penalised spline smoothing. Grey shading indicates the 95% confidence interval for log hazard. Extreme CE values are not shown as the spline smoothing algorithm disregards values outside the 95% range. The median (red line) separates a region of low hazard from a region of high hazard indicated by non-overlapping confidence intervals. (C and D) The CE-low and CE-high groups show a statistically significant difference in PFS (log-rank p < 0.01) and OS (log-rank p < 0.01). Numbers at risk are given above the x-axis for the CE-low (top) and CE-high (bottom) groups.

References

    1. Nowell PC (1976) The clonal evolution of tumor cell populations. Science 194: 23–28. - PubMed
    1. Dexter DL, Kowalski HM, Blazar BA, Fligiel Z, Vogel R, et al. (1978) Heterogeneity of tumor cells from a single mouse mammary tumor. Cancer Res 38: 3174–3181. - PubMed
    1. Khalique L, Ayhan A, Weale ME, Jacobs IJ, Ramus SJ, et al. (2007) Genetic intra-tumour heterogeneity in epithelial ovarian cancer and its implications for molecular diagnosis of tumours. J Pathol 211: 286–295. - PubMed
    1. Khalique L, Ayhan A, Whittaker JC, Singh N, Jacobs IJ, et al. (2009) The clonal evolution of metastases from primary serous epithelial ovarian cancers. Int J Cancer 124: 1579–1586. 10.1002/ijc.24148 - DOI - PubMed
    1. Shah SP, Morin RD, Khattra J, Prentice L, Pugh T, et al. (2009) Mutational evolution in a lobular breast tumour profiled at single nucleotide resolution. Nature 461: 809–813. 10.1038/nature08489 - DOI - PubMed

Publication types

Associated data