

Visualizing collaborative electronic health record usage for hospitalized patients with heart failure
- PMID: 25710558
- PMCID: PMC4394967
- DOI: 10.1093/jamia/ocu017
Visualizing collaborative electronic health record usage for hospitalized patients with heart failure
Abstract
Objective: To visualize and describe collaborative electronic health record (EHR) usage for hospitalized patients with heart failure.
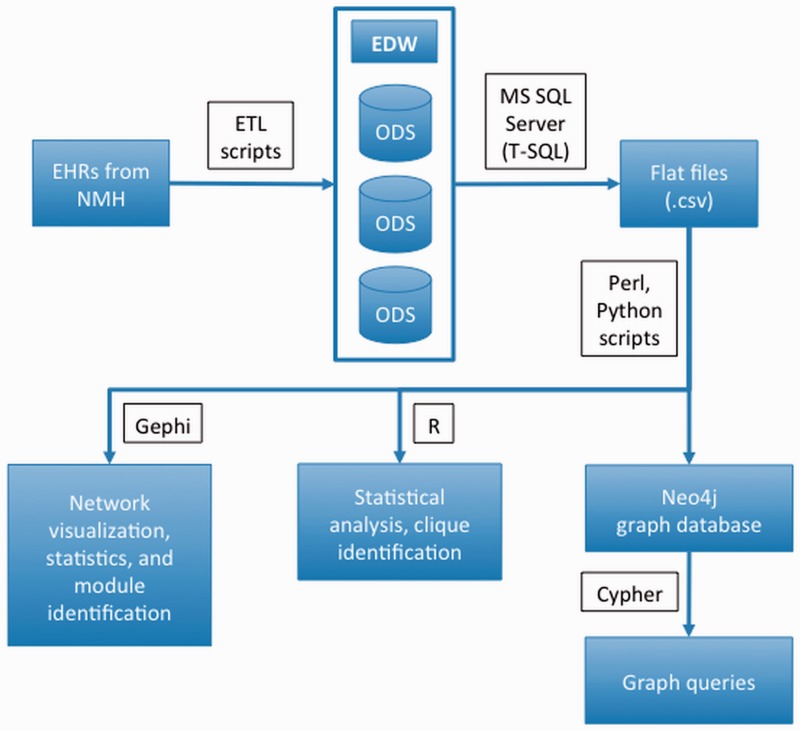
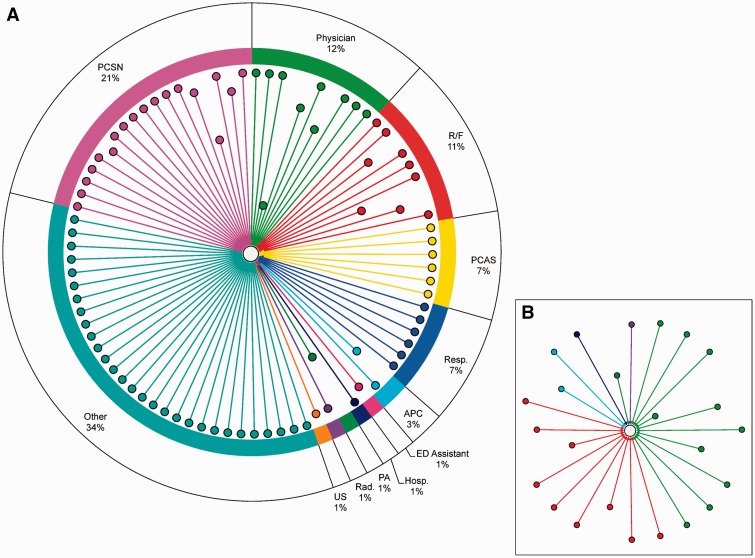
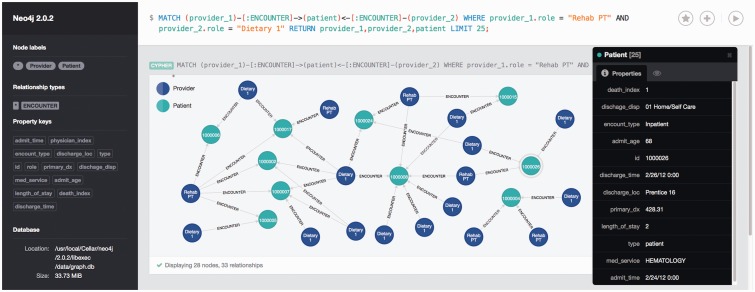
Materials and methods: We identified records of patients with heart failure and all associated healthcare provider record usage through queries of the Northwestern Medicine Enterprise Data Warehouse. We constructed a network by equating access and updates of a patient's EHR to a provider-patient interaction. We then considered shared patient record access as the basis for a second network that we termed the provider collaboration network. We calculated network statistics, the modularity of provider interactions, and provider cliques.
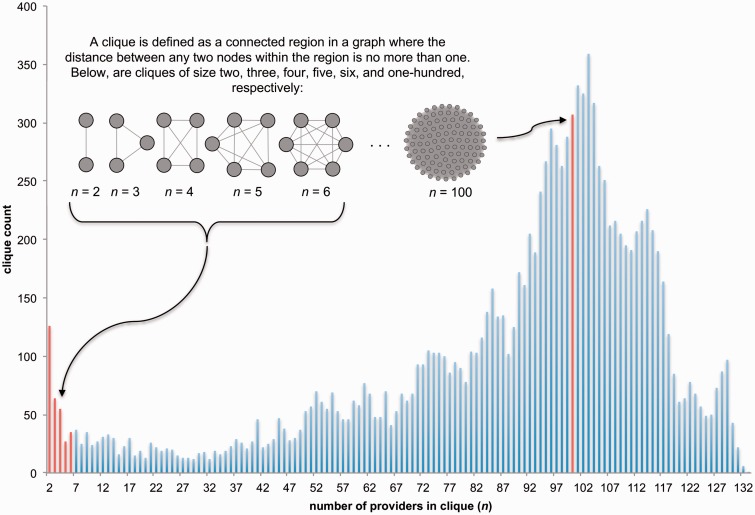
Results: We identified 548 patient records accessed by 5113 healthcare providers in 2012. The provider collaboration network had 1504 nodes and 83 998 edges. We identified 7 major provider collaboration modules. Average clique size was 87.9 providers. We used a graph database to demonstrate an ad hoc query of our provider-patient network.
Discussion: Our analysis suggests a large number of healthcare providers across a wide variety of professions access records of patients with heart failure during their hospital stay. This shared record access tends to take place not only in a pairwise manner but also among large groups of providers.
Conclusion: EHRs encode valuable interactions, implicitly or explicitly, between patients and providers. Network analysis provided strong evidence of multidisciplinary record access of patients with heart failure across teams of 100+ providers. Further investigation may lead to clearer understanding of how record access information can be used to strategically guide care coordination for patients hospitalized for heart failure.
Keywords: Care collaboration; electronic health records; heart failure; network analysis.
© The Author 2015. Published by Oxford University Press on behalf of the American Medical Informatics Association.
Figures

References
-
- Executive Office of the President Council of Economic Advisers. Reducing Costs and Improving the Quality of Healthcare. In: Economic Report of the President (2013). http://fraser.stlouisfed.org/publication/?pid=45. Accessed October 1, 2013.
-
- Cutler D. Analysis & commentary. How health care reform must bend the cost curve. Health Aff. 2010;29(6): 1131–1135. - PubMed
-
- Readmissions Reduction Program. Centers for Medicare & Medicaid Services website. http://www.cms.gov/Medicare/Medicare-Fee-for-Service-Payment/AcuteInpati.... Accessed October 1, 2013.
-
- Bonow RO, Masoudi FA, Rumsfeld JS, et al. ACC/AHA classification of care metrics: performance measures and quality metrics: a report of the American College of Cardiology/American Heart Association Task Force on Performance Measures. J Am Coll Cardiol. 2008;52:2113–2117. - PubMed
Publication types
MeSH terms
Grants and funding
LinkOut - more resources
Full Text Sources
Other Literature Sources
Medical
