. 2015 Feb 20;107(4):djv017.
doi: 10.1093/jnci/djv017. Print 2015 Apr.

Blockade of MMP14 activity in murine breast carcinomas: implications for macrophages, vessels, and radiotherapy

Affiliations

Blockade of MMP14 activity in murine breast carcinomas: implications for macrophages, vessels, and radiotherapy

Eleanor I Ager et al. J Natl Cancer Inst. .

Abstract

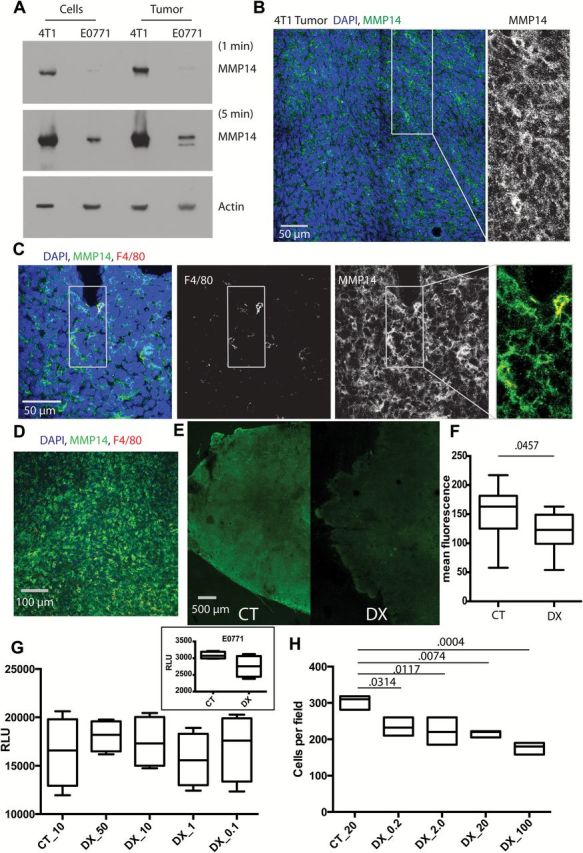
Background: Matrix metalloproteinase (MMP) 14 may mediate tumor progression through vascular and immune-modulatory effects.

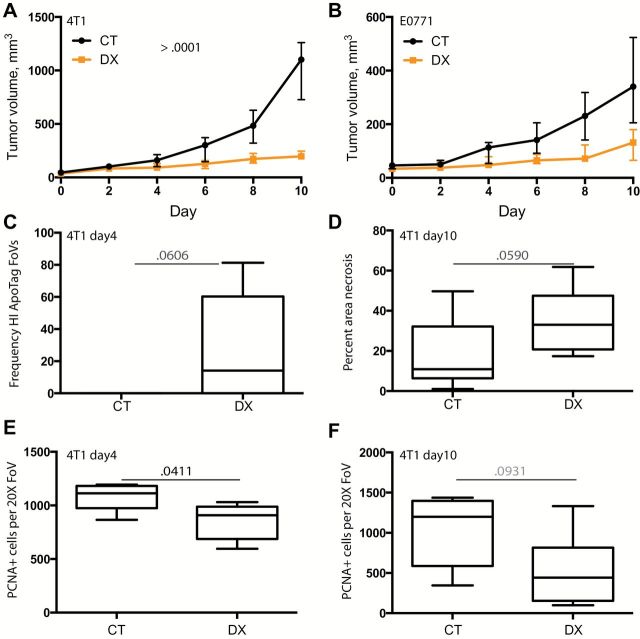
Methods: Orthotopic murine breast tumors (4T1 and E0771 with high and low MMP14 expression, respectively; n = 5-10 per group) were treated with an anti-MMP14 inhibitory antibody (DX-2400), IgG control, fractionated radiation therapy, or their combination. We assessed primary tumor growth, transforming growth factor β (TGFβ) and inducible nitric oxide synthase (iNOS) expression, macrophage phenotype, and vascular parameters. A linear mixed model with repeated observations, with Mann-Whitney or analysis of variance with Bonferroni post hoc adjustment, was used to determine statistical significance. All statistical tests were two-sided.

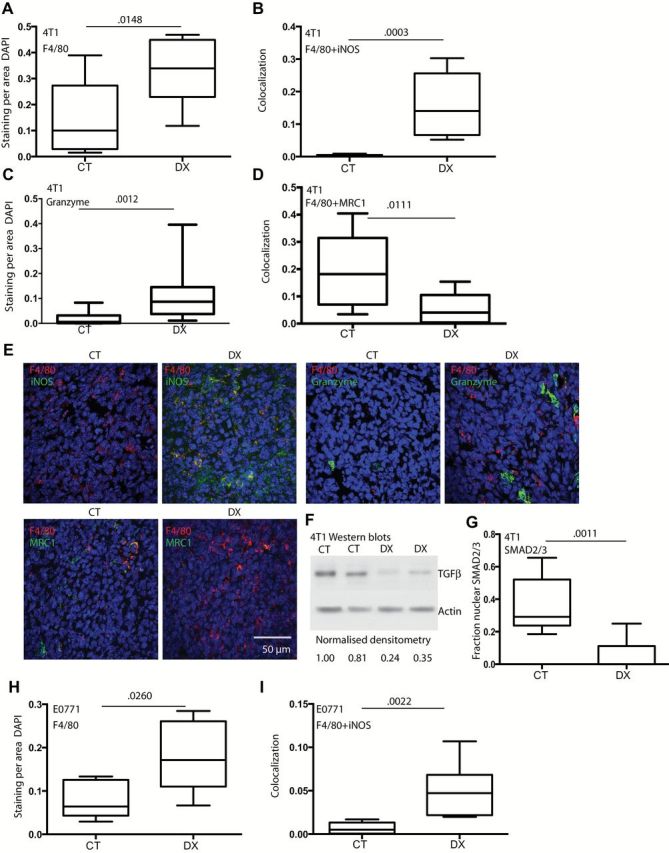
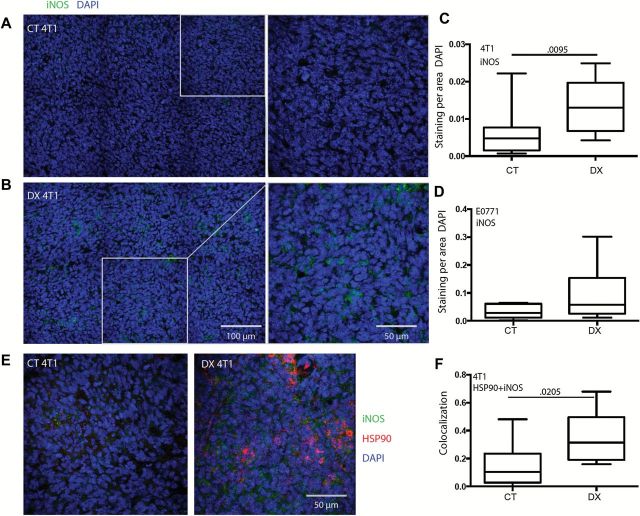
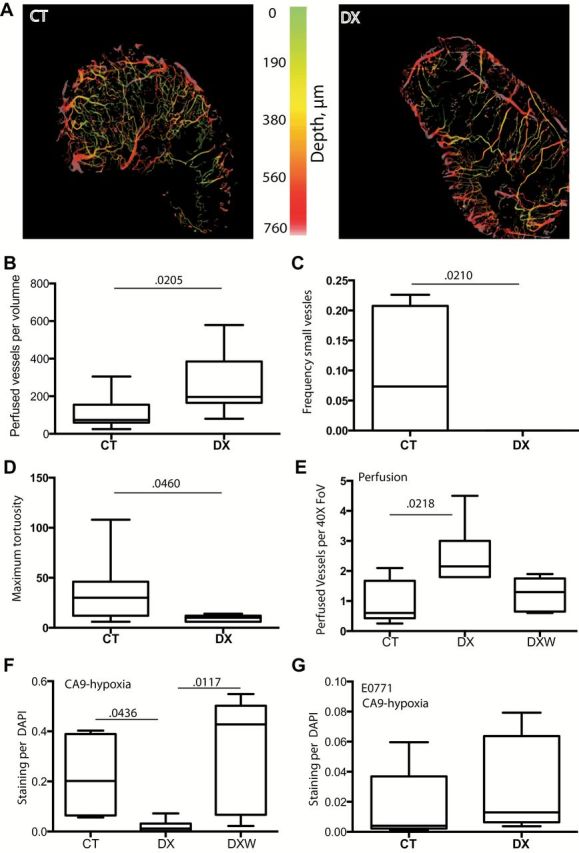
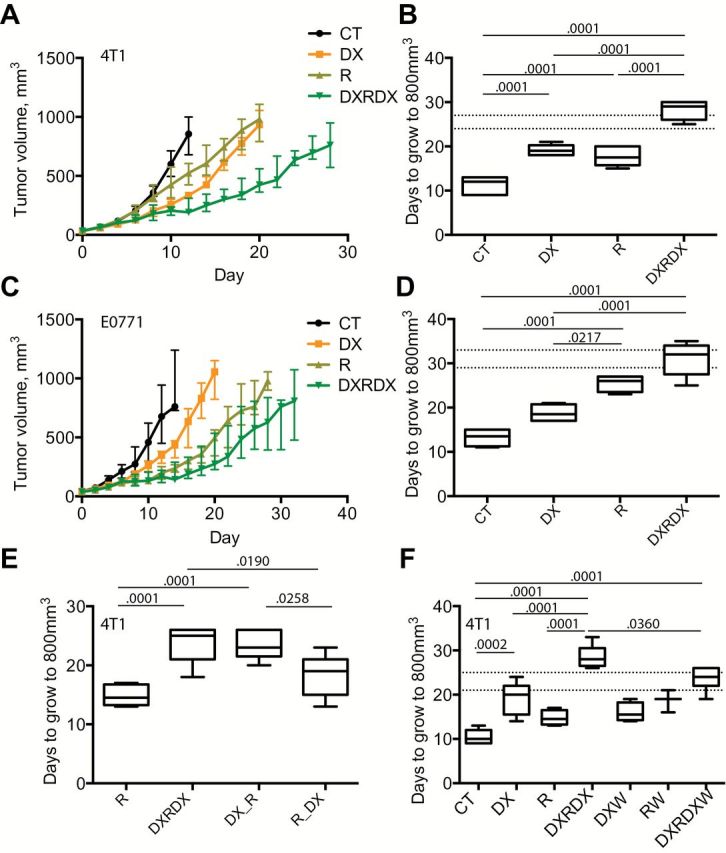
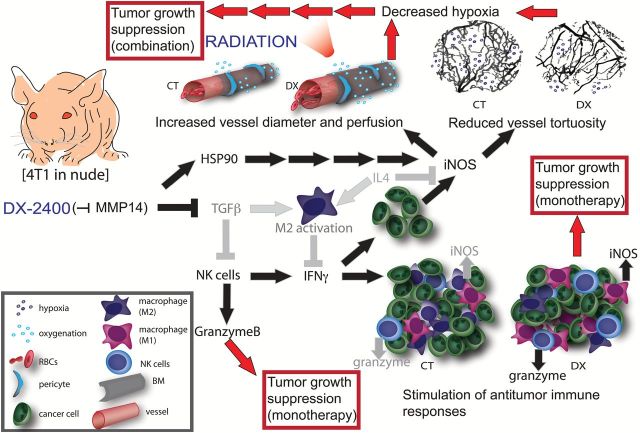
Results: DX-2400 inhibited tumor growth compared with IgG control treatment, increased macrophage numbers, and shifted the macrophage phenotype towards antitumor M1-like. These effects were associated with a reduction in active TGFβ and SMAD2/3 signaling. DX-2400 also transiently increased iNOS expression and tumor perfusion, reduced tissue hypoxia (median % area: control, 20.2%, interquartile range (IQR) = 6.4%-38.9%; DX-2400: 1.2%, IQR = 0.2%-3.2%, P = .044), and synergistically enhanced radiation therapy (days to grow to 800mm(3): control, 12 days, IQR = 9-13 days; DX-2400 plus radiation, 29 days, IQR = 26-30 days, P < .001) in the 4T1 model. The selective iNOS inhibitor, 1400W, abolished the effects of DX-2400 on vessel perfusion and radiotherapy. On the other hand, DX-2400 was not capable of inducing iNOS expression or synergizing with radiation in E0771 tumors.

Conclusion: MMP14 blockade decreased immunosuppressive TGFβ, polarized macrophages to an antitumor phenotype, increased iNOS, and improved tumor perfusion, resulting in reduced primary tumor growth and enhanced response to radiation therapy, especially in high MMP14-expressing tumors.


Figures

Figure 1.
Figure 1.
MMP14 expression and activity in breast cancer in vivo and its direct effects on tumor cells in vitro. A) Western blot of MMP14 in 4T1 and E0771 cell lines and tumors grown orthotopically in the mammary fat pad of nude or C57BL6 mice, respectively. Blots exposed for one minute or five minutes for MMP14 and one minute for β-actin. B-D) Immunofluorescence staining for MMP14 in 4T1 tumors. MMP14 was broadly expressed within the tumor (B) and showed bright staining on macrophages (F4/80 marker) (C-D). All macrophages appeared to express MMP14; ie, no red single staining cells, only yellow colocalization visible (C, higher magnification; D, lower magnification). E-F) Collagenolytic activity decreased following treatment with DX-2400 (10mg/kg). Representative DQ-collagen type I images; control (E) and quantification (relative fluorescence units) of collagenolytic activity (DQ-collagen type-I) (F). G) Data from five replicates are shown. The effect of DX-2400 concentration (µg/mL) on 4T1 cell viability (inset, E0771 cells treated with 50 µM DX-2400) expressed as relative luminescence units. BC cell viability was unaffected by DX-2400 at the concentrations of 0.1–50 µg/mL. E0771 cell data in the inset was P = 0.1. Here, day 3 data are presented. Day 1 and 2 data were similar. H) Data from three replicates are shown. The effect of DX-2400 concentration (µg/mL) on 4T1 cell invasion. In contrast to cell viability, cell invasion through collagen I was statistically significantly reduced by DX-2400 at all concentrations tested (0.2–100 µg/mL). F-H) Data are presented as median with the interquartile range (box and whiskers). P values are shown. Analysis of invasion and viability were performed in triplicate, n > 7 for DQ collagen analysis. Statistical significance determined by two-sided Mann-Whitney test for DQ analysis and analysis of variance with Tukey’s correction. CT = control; DX = DX-2400; RLU = relative luminescence unit.
Figure 2.
Figure 2.
Inhibition of 4T1 and E0771 tumor growth by MMP14 blockade. Mice were treated with control IgG (CT) or DX-2400 (DX) (10mg/kg every 48 hours, up to 10 injections) once tumors reached approximately 40mm3 (day 0) to day 10, at which time mice were killed. A-B) Tumor growth curves. Data for 4T1 in nude (A) and E0771 in C57BL6 (B) are presented as median and interquartile range. Individual tumor growth curves are provided in Supplementary Figure 1 (available online). Tumor growth rates were statistically significantly different according to a mixed model analysis. C-D) Cell death. There was a trend towards increased apoptosis with DX-2400 treatment at day 4 (C; high-frequency Apoptag staining assessed as greater than 10 apoptotic cells per field of view) and, similarly, necrosis tended to be greater in day 10 samples from DX-2400 treated animals. E-F) Cell proliferation. Day 4 proliferation (proliferating cell nuclear antigen) was decreased by DX-2400 (E), while day 10 proliferation showed a trend (F). Images of Apoptag, necrosis, and PCNA are provided in Supplementary Figure 2 (available online). All data from panels C to F were obtained from 4T1 tumors in nude mice. Data are presented as median with the interquartile range (box) and maximum and minimum values (whiskers) for panels C to F. P values determined by two-sided Mann-Whitney test. Samples sizes: n = 6 for all analyses except day 10 necrosis (n > 8) and tumor growth curves (n = 10 for 4T1 and n = 7 for E0771). CT = control; DX = DX-2400; FoV = field of view; HI = high-frequency; PCNA = proliferating cell nuclear antigen.
Figure 3.
Figure 3.
Effect of anti-MMP14 treatment on F4/80+ macrophages and M1-like state. A-G) Data and representative images from day 4 4T1 tumors in nude mice except western blot of TGFβ (F, day 6). Both total F4/80+ area (A) and the area costaining with iNOS (an M1 marker) (B) were increased by DX-2400 (DX) treatment compared with control (CT). Granzyme B (cytotoxic activity) also increased with treatment (C), while MRC1 (an M2 marker) (D) decreased following DX-2400 treatment. E) Representative images of stains. The stain performed is indicated at the top left of each CT image with the matched DX to the right. A scale bar is presented on the bottom right and is the same for all images (50 μm). F) A Western blot confirmed a decrease in active TGFβ (molecular weight ~25 KDa). G) DX decreased nuclear localization of SMAD2/3, downstream of TGFβ activation. H-I) Data from day 4 E0771 tumors in C57BL6 mice. An increase in total macrophages (H) and iNOS-expressing M1 macrophages (I) for E0771 tumors confirmed results from the 4T1 model. Data are presented as median with the interquartile range (box) and maximum and minimum values (whiskers). Statistical significance determined by two-sided Mann-Whitney test; n = 8 for all analysis of 4T1 samples, and n = 6 for E0771 samples. Additional associated images and data are provided in Supplementary Figures 3 and 4 (available online). CT = control; DX = DX-2400.
Figure 4.
Figure 4.
Effect of MMP14 inhibition on iNOS expression in 4T1 tumors. A-C) Immunofluorescence staining of iNOS in 4T1 (A & B, representative images of control [CT] and DX-2400 [DX] treatment, respectively) revealed an increase with DX-2400 treatment at day 4 in 4T1 tumors (B). iNOS levels were not statistically significantly changed by DX-2400 treatment in the E0771 tumor model (D). E-F) HSP90 and iNOS expression. E) Representative images of HSP90 and iNOS immunofluorescent stains). HSP90, an essential cofactor and activator of iNOS, colocalization with iNOS also statistically significantly increased in the 4T1 tumor model (F). Scale bars are presented in the bottom right of each DX image and are the same for CT and DX images. Data are presented as median with the interquartile range (box) and maximum and minimum values (whiskers); n = 6 for E0771 samples, and n = 10 for 4T1 iNOS analysis, and n = 7 for HSP90+iNOS analysis. Statistical significance determined by two-sided Mann-Whitney test. Additional associated images and data are provided in Supplementary Figures 5 and 6 (available online). Note: y-axis scales in panels A and C are optimized for each tumor model. CT = control; DX = DX-2400.
Figure 5.
Figure 5.
Effect of DX-2400 and iNOS blockade on perfusion and hypoxia in the 4T1 tumor model. A) Representative optical frequency domain images (OFDI) of control (CT)- and DX-2400 (DX)–treated tumors. B-E) Analyses of vascular parameters. The number of perfused vessels was increased by DX-2400 (B), while the frequency of vessels with a diameter of less than 15 μm was decreased by DX-2400 (C). The maximum tortuosity of vessels was also decreased by DX-2400 (D). Perfusion, assessed on trichrome stained tumor sections, was confirmed to increase with DX-2400 treatment, while blockade of iNOS with 1400W (DXW) prevented the DX-2400–associated increase in perfusion (E). F-G) Assessment of hypoxia. DX-2400 alone was also seen to decrease staining of CA9 (a marker of hypoxia), while the addition of 1400W to DX-2400 prevented this decrease (F). Contrary to the 4T1 model (A-F), the E0771 tumor model did not show a decrease in hypoxia with DX-2400 treatment (G). All data are from day 4 after treatment initiation. Data are presented as median with the interquartile range (box) and maximum and minimum values (whiskers). Sample size: n = 7 for OFDI analyses, n = 5 or 6 for all other analyses (ie, panels E-G). P values determined by two-sided Mann-Whitney test for B-D and G and by Kruskal-Wallis test for E and H. Additional associated images and data are provided in Supplementary Figures 7–10 (available online). Note: y-axis scales in panels F and G are optimized for each tumor model. CT = control; DX = DX-2400; DXW = 1400W in addition to DX; FoV = field of view.
Figure 6.
Figure 6.
The effect of anti-MMP14, radiation, and their combination on BC models. A-D) The combination of DX-2400 and radiation is modestly synergistic in the 4T1 tumor model and additive in the E0771 tumor model. Tumor growth curves for 4T1 tumors (A) and E0771tumors (C) in mice treated with control (CT), DX-2400 (DX), local fractionated irradiation (R; days 4, 5, and 6), or their combination (DXRDX). Mice were maintained and tumors measured until tumors reached approximately 1000mm3 or until morbidity was evident. Data are presented as median and interquartile range (panels A and C) with individual curves presented in Supplementary Figure 11 (available online). All other data are presented as median with the interquartile range (box) and maximum and minimum values (whiskers). Sample size: n = 6 for 4T1 and n = 4 or 5 for E0771. The time (days) taken for tumors to grow to 800mm3 was used to assess tumor growth delay (panels B, 4T1, and D, E0771). The combination of DX-2400 and radiation was synergistic in the 4T1 model (B; expected additive range of DX+R is shown as horizontal dashed lines), while the combination was additive in the E0771 model (D). E) The effects of the timing of MMP14 inhibition. Ten DX-2400 injections (DXRDX) compared with three initial injections of DX-2400 (DXR; DX on days 0, 2, and 4 with radiation on days 4, 5, and 6) and seven postirradiation injections (RDX). F) The effects of iNOS were assessed using 1400W in addition to DX (DXW), radiation (RW), and the combination (DXRDXW). The synergy associated with combination treatment in the 4T1 model was lost when iNOS was inhibited. Analysis of variance with Bonferroni post hoc t test was performed for analysis of tumor growth. All statistical tests were two-sided. Additional data are provided in Supplementary Figure 11 (available online). CT = control; DX = DX-2400; DXR = three initial injections of DX-2400 plus radiation; DXRDX = ten DX-2400 injections plus radiation; DXRDXW = combination DXRDX plus 1400W; DXW = DX-2400 plus 1400W; RDX = radiation followed by DX-2400; RW = radiation plus 1400W.
Figure 7.
Figure 7.
A schematic representation of the effects of MMP14 inhibition by DX-2400 in 4T1 primary breast tumors in nude mice. Pathways in gray are decreased by DX-2400 and those in black are increased. Red arrows show potential implications for monotherapy and combination therapies. DX-2400 increases vessel perfusion and tumor oxygenation; this is associated with an increase in iNOS expression in the tumor and coincides with an increase in HSP90. DX-2400 treatment also decreased vessel tortuosity, which possibly contributes to improved vessel perfusion. Improved perfusion led to an increase in the efficacy of radiation therapy. DX-2400 reduces TGFβ as well as M2-associated cytokine IL4 and the M2 marker MRC1, while it increases IFNγ, granzyme B, and iNOS—all markers of antitumor immune activity. A shift towards antitumor immune activity could contribute to the tumor growth delay seen earlier than the previously documented antiangiogenic effects. BM = basement membrane; CT = control; DX = DX-2400; NK = natural killer; RBC = red blood cell.

References

    1. Kessenbrock K, Plaks V, Werb Z. Matrix metalloproteinases: regulators of the tumor microenvironment. Cell. 2010;141(1):52–67. - PMC - PubMed
    1. Tetu B, Brisson J, Wang CS, et al. The influence of MMP-14, TIMP-2 and MMP-2 expression on breast cancer prognosis. Breast Cancer Res. 2006;8(3):R28. - PMC - PubMed
    1. Jiang WG, Davies G, Martin TA, et al. Expression of membrane type-1 matrix metalloproteinase, MT1-MMP in human breast cancer and its impact on invasiveness of breast cancer cells. Int J Mol Med. 2006;17(4):583–590. - PubMed
    1. Coussens LM, Fingleton B, Matrisian LM. Matrix metalloproteinase inhibitors and cancer: trials and tribulations. Science. 2002;295(5564):2387–2392. - PubMed
    1. Pavlaki M, Zucker S. Matrix metalloproteinase inhibitors (MMPIs): the beginning of phase I or the termination of phase III clinical trials. Cancer Metastasis Rev. 2003;22(2–3):177–203. - PubMed

Publication types

MeSH terms