. 2015 Mar 9;212(3):415-29.
doi: 10.1084/jem.20131601. Epub 2015 Feb 23.

CD160 is essential for NK-mediated IFN-γ production

Affiliations

CD160 is essential for NK-mediated IFN-γ production

Tony C Tu et al. J Exp Med. .

Abstract

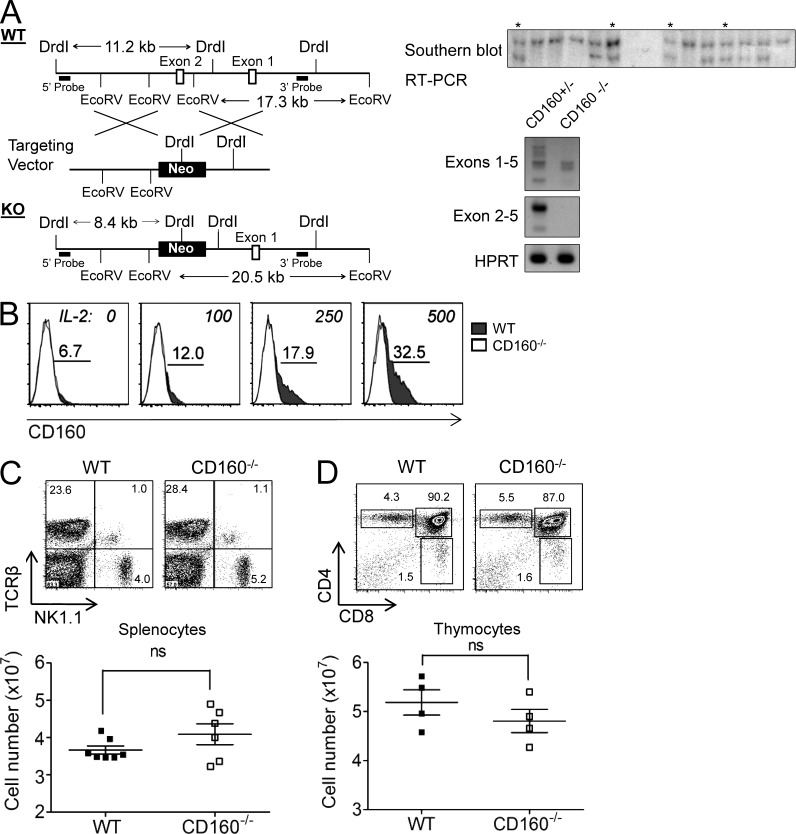
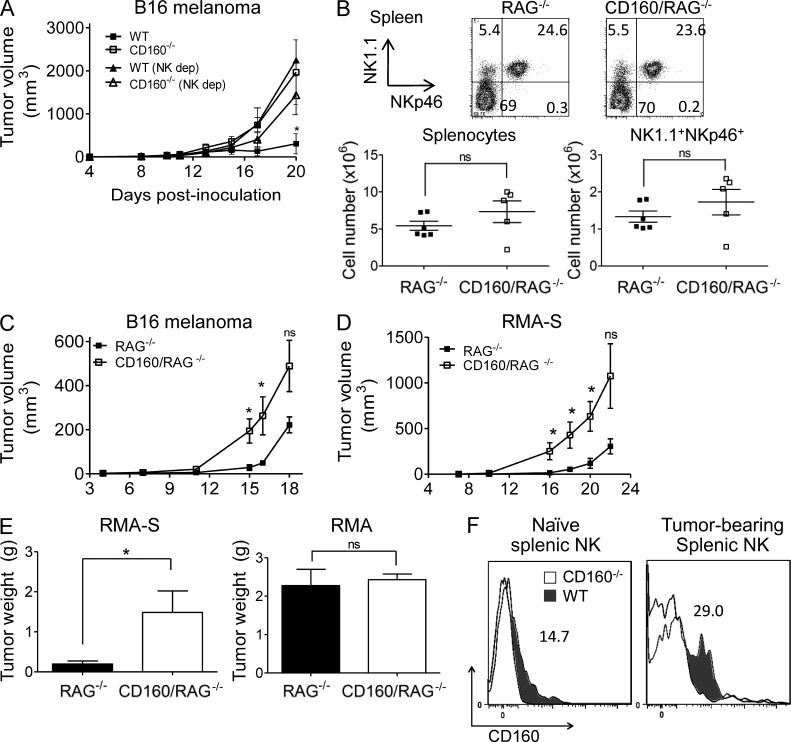
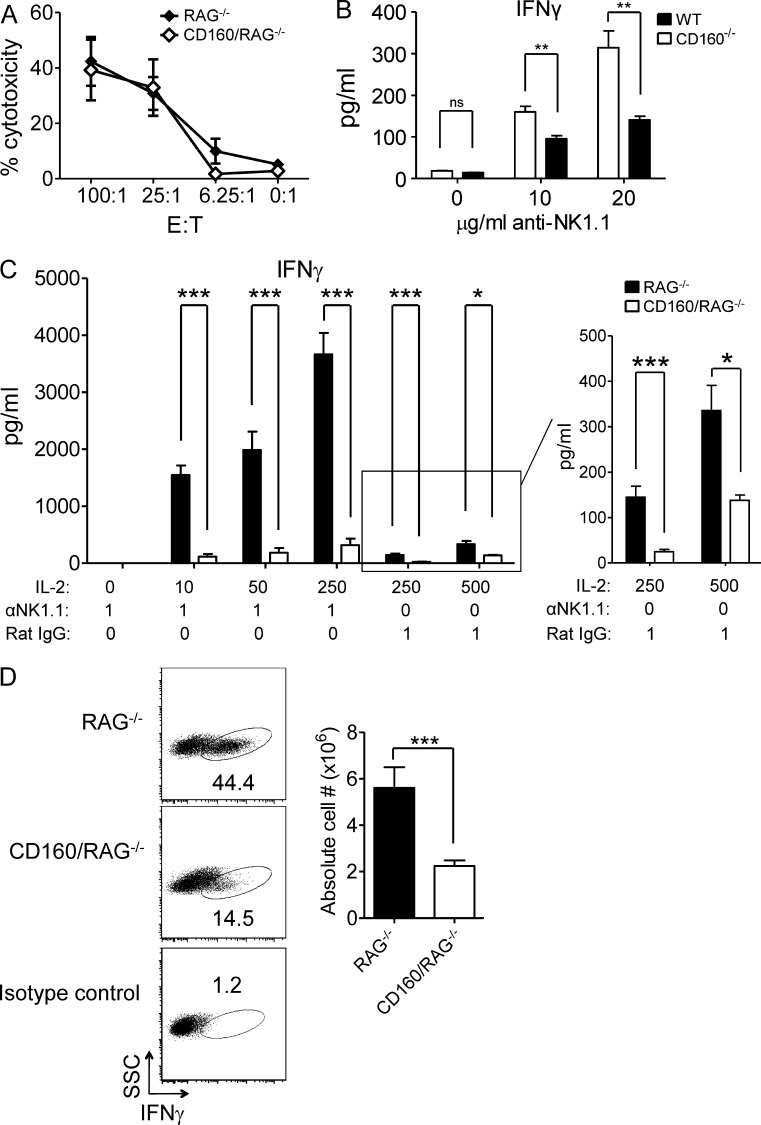
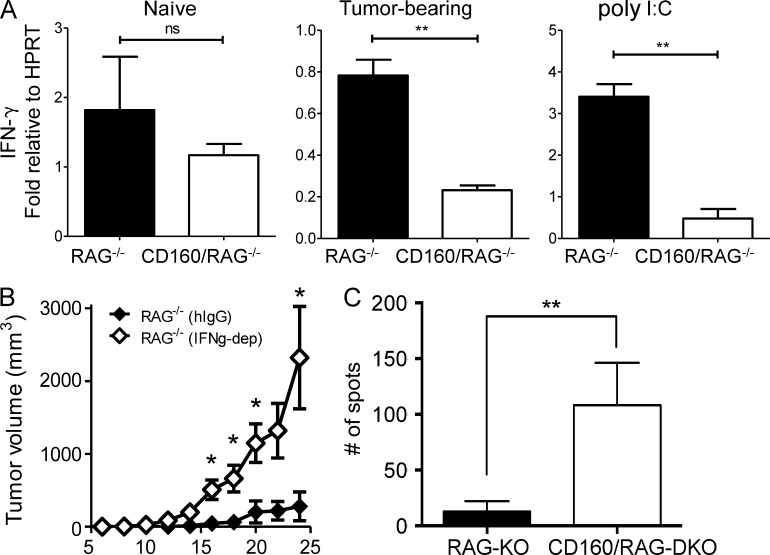
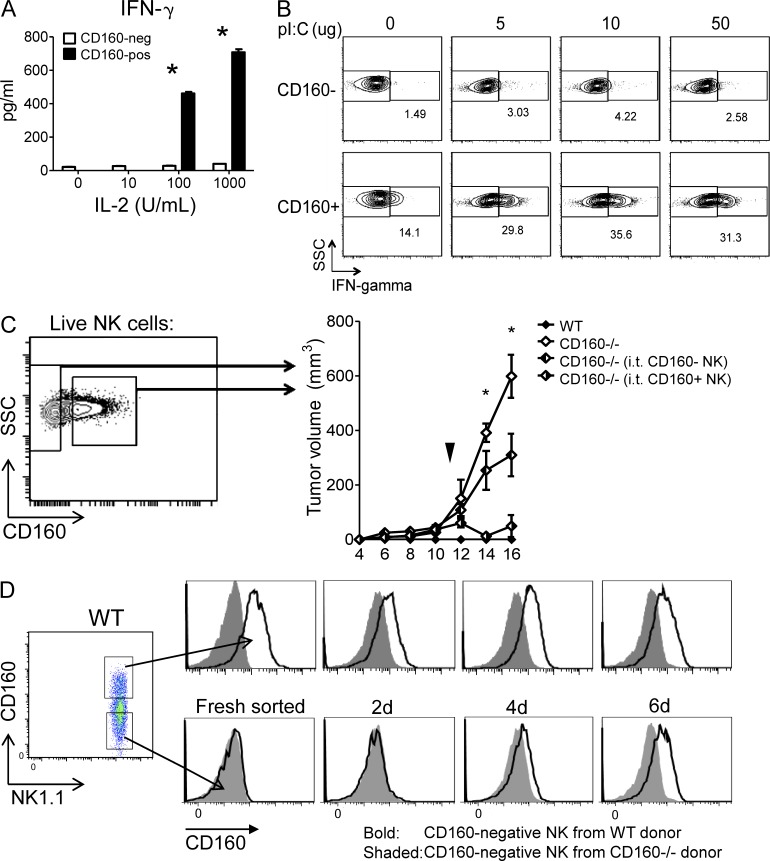
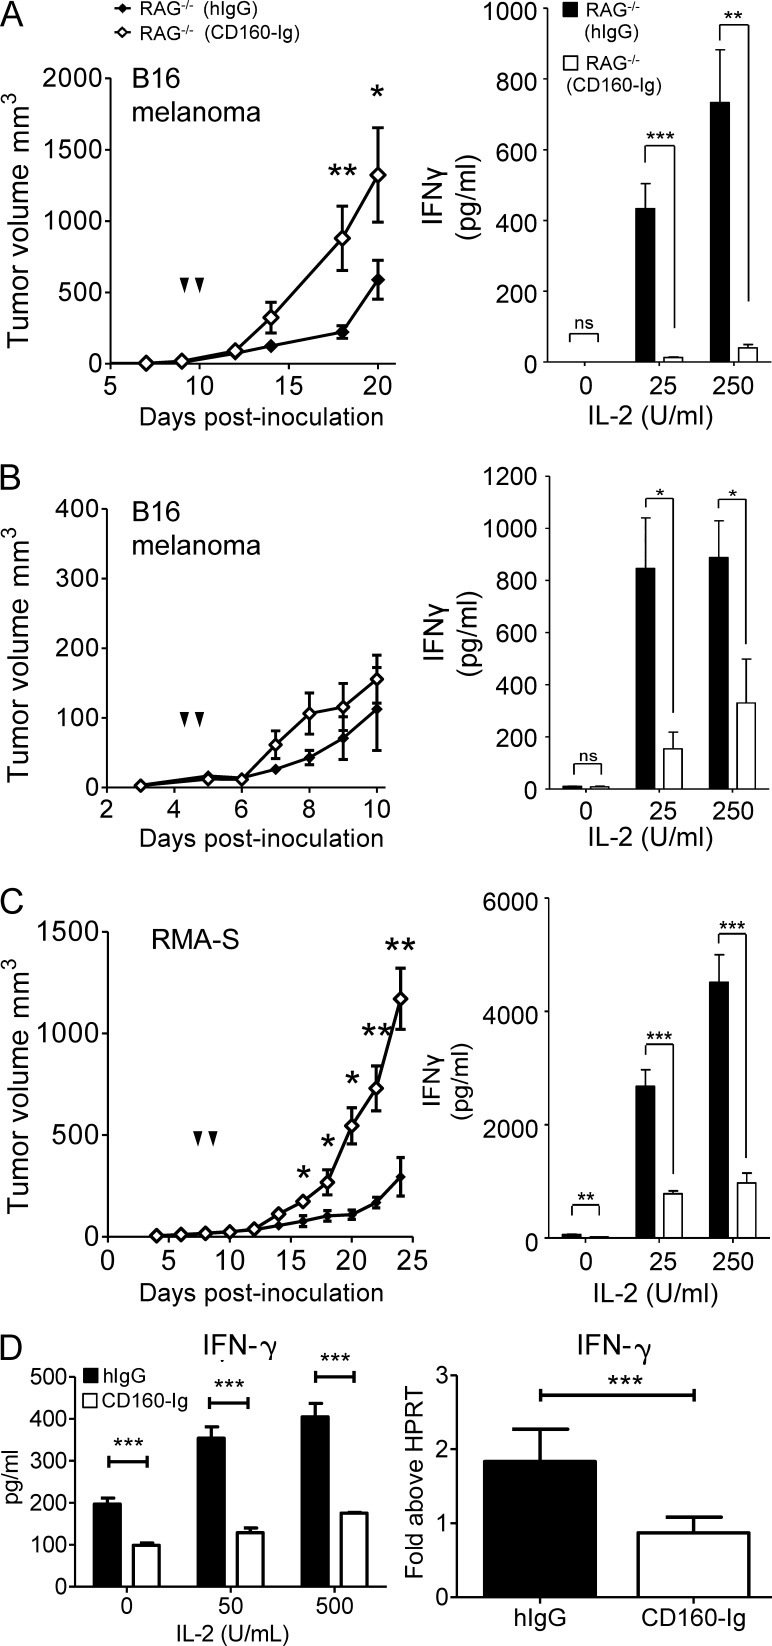
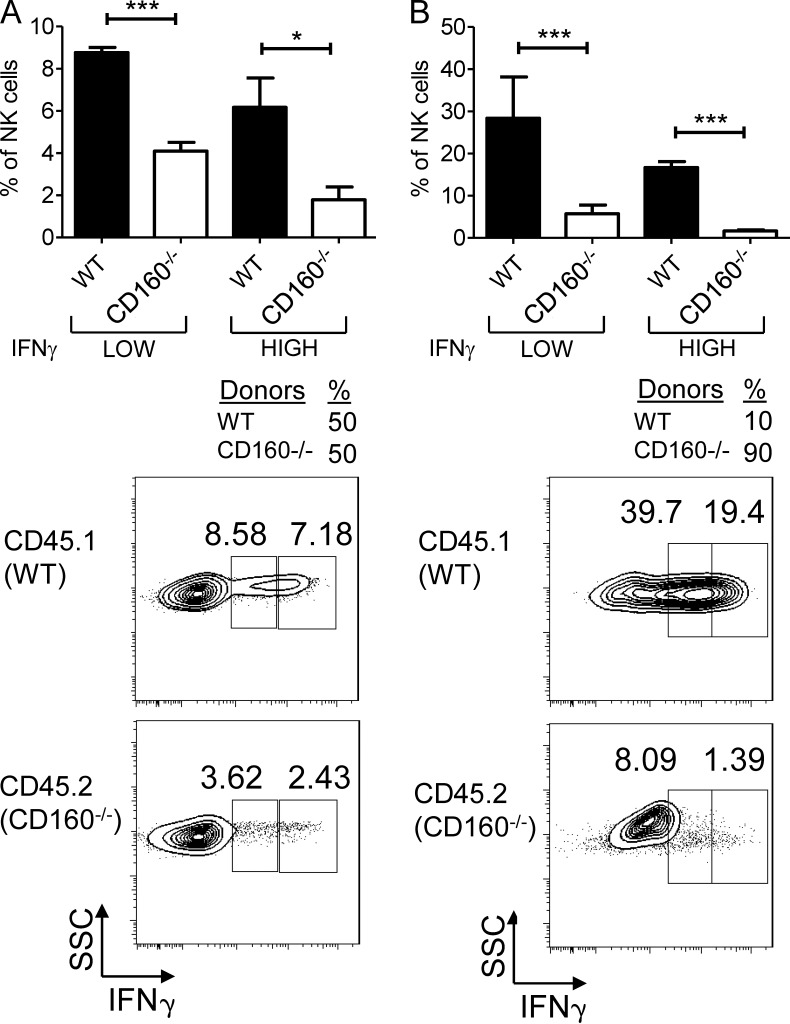
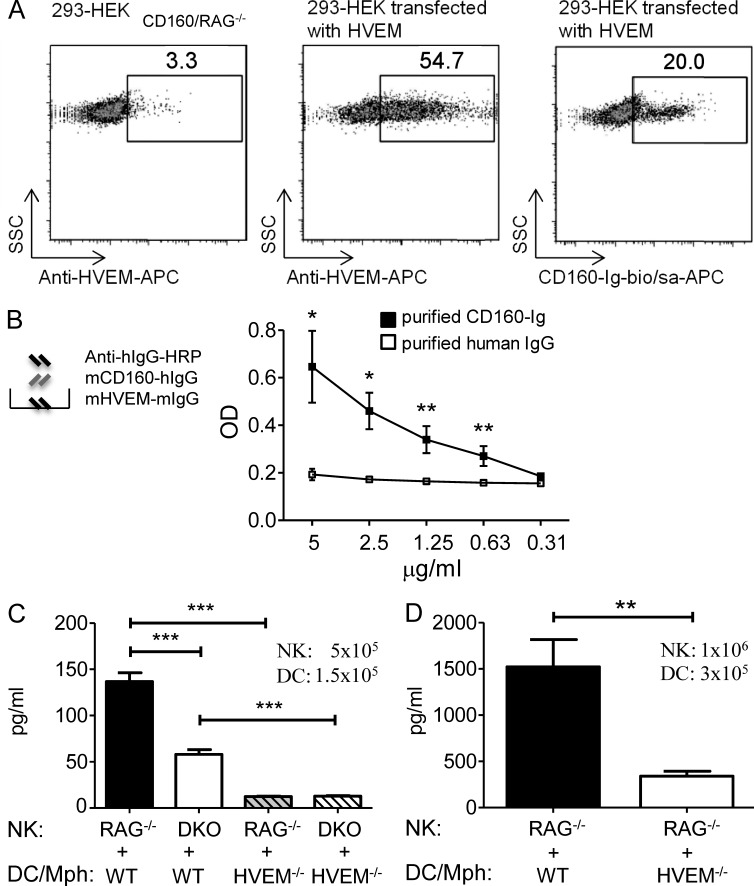
NK-derived cytokines play important roles for natural killer (NK) function, but how the cytokines are regulated is poorly understood. CD160 is expressed on activated NK or T cells in humans but its function is unknown. We generated CD160-deficient mice to probe its function. Although CD160(-/-) mice showed no abnormalities in lymphocyte development, the control of NK-sensitive tumors was severely compromised in CD160(-/-) mice. Surprisingly, the cytotoxicity of NK cells was not impaired, but interferon-γ (IFN-γ) secretion by NK cells was markedly reduced in CD160(-/-) mice. Functionally targeting CD160 signaling with a soluble CD160-Ig also impaired tumor control and IFN-γ production, suggesting an active role of CD160 signaling. Using reciprocal bone marrow transfer and cell culture, we have identified the intrinsic role of CD160 on NK cells, as well as its receptor on non-NK cells, for regulating cytokine production. To demonstrate sufficiency of the CD160(+) NK cell subset in controlling NK-dependent tumor growth, intratumoral transfer of the CD160(+) NK fraction led to tumor regression in CD160(-/-) tumor-bearing mice, indicating demonstrable therapeutic potential for controlling early tumors. Therefore, CD160 is not only an important biomarker but also functionally controls cytokine production by NK cells.


Figures

Figure 1.
Figure 1.
Generation and characterization of CD160−/− mice. (A) Schematic of CD160 targeting vector. (top) Relevant portion of WT mouse chromosome 3, targeting vector, and genomic sequence after homologous recombination. Exon 1, exon 2 (replaced by Neo sequence in KO), and DrdI and EcoRV restriction sites used for typing by Southern blot are shown. (bottom) 5′ Southern blot verifying mutant gene. *, correctly targeted clones successfully used to make CD160−/− founder lines. (right) Electrophoresis by Southern and Northern blots of CD160 exons from CD160+/− and CD160−/− splenocytes. The molecular weights for the WT and KO Southern bands were 11,183 and 8,408 bp, respectively. (B) Splenocytes from WT and CD160−/− mice were cultured in complete medium supplemented with increasing concentrations of rhIL-2 (0, 100, 250, and 500 U/ml). After 18 h, cells were harvested and labeled with NK1.1, TCRβ, and CD160 mAbs. FACS histograms show NK1.1+TCRβ cells. Numbers in FACS plots indicate percentages of gated populations of WT cells. Splenocytes (C) or thymocytes (D) were harvested and labeled with TCRβ and NK1.1 or CD4 and CD8 mAbs, respectively. Cell populations were gated as shown in FACS plots and cell numbers were calculated from total cell counts. Data are representative of three independent experiments.
Figure 2.
Figure 2.
CD160 is required for controlling NK-sensitive tumors. (A) WT and CD160−/− mice were inoculated subcutaneously with 105 B16 melanoma cells. NK-depleted mice were administered NK1.1 mAb 1 d before tumor inoculation, and weekly thereafter. *, significant differences (P < 0.05) at days 17 and 20 between WT and CD160−/− groups, and WT and WT (NK dep) groups. Differences between CD160−/− and CD160−/− (NK dep), and WT (NK dep) and CD160−/− (NK dep) were not significant. Each group contained five mice. Data are representative of three independent experiments. (B) Splenocytes from RAG−/− and CD160/RAG−/− mice were labeled with NK1.1 and NKp46 mAbs. Cell populations were gated as shown in FACS plots and cell numbers were calculated from total cell counts. Data are representative of three independent experiments. (C) RAG−/− and CD160/RAG−/− mice were inoculated subcutaneously with 5 × 10⁵ B16 melanoma cells. *, significant differences (P < 0.05) between groups at days 15 and 16. Each group contained 5 mice. Data are representative of three independent experiments. (D) For the RMA-S tumor model, RAG−/− and CD160/RAG−/− mice were inoculated subcutaneously with 5 × 10⁵ RMA-S. *, significant differences (P < 0.05) between RMA-S groups at days 16, 18, and 20 by tumor volume. (E) 5 × 10⁵ RMA-S or RMA lymphoma cells were inoculated subcutaneously as before, and weights of tumors resected at day 22 after inoculation were measured. *, significant difference (P < 0.05) between RMA-S groups at day 22 by tumor weight. (F) The expression of CD160 on NK cells from tumor-bearing mice was determined by flow cytometry. Shown are cells gated from the 7-AAD, CD3, NK1.1+ population. Mice were inoculated with 2 × 10⁶ RMA-S tumor cells, and tumors were allowed to grow until 500 mm3 before termination. Lymphocytes from the spleen were harvested into single-cell suspension, and labeled with NK1.1, TCRβ, and CD160 mAbs as previously described. Data are representative of three independent experiments.
Figure 3.
Figure 3.
NK cells require CD160 for IFN-γ production, but not killing. (A) The percent cytotoxicity from 51Cr release assay are shown for total splenocytes freshly isolated from naive RAG−/− or CD160/RAG−/− mice and cultured with radiolabeled YAC-1 target cells for 4 h at the indicated effector-to-target ratios. Data are representative of three independent experiments. (B) Splenocytes from naive WT and CD160−/− mice were cultured at 2 × 10⁵ cells per well in 96-well flat bottom plates with complete medium supplemented with rhIL-2 (100 U/ml) and plate-bound anti-NK1.1 at indicated concentrations. After 48 h, culture supernatants were harvested and IFN-γ concentration was determined. (C) Splenocytes from naive RAG−/− and CD160/RAG−/− mice were cultured as in B, with indicated concentrations of IL-2 and either plate-bound anti-NK1.1 or isotype control antibodies. After 48 h, culture supernatants were harvested and IFN-γ concentration was determined. (D) For intracellular cytokine staining, RAG−/− and CD160/RAG−/− mice were primed with intraperitoneal injections of poly(I:C) (100 µg) 18 h before splenocytes were harvested and cultured for 6 h in complete media containing Brefeldin-A. During this 6-h culture, cells received rhIL-2 (100 U/ml) and plate-bound anti-NK1.1 mAb (1 µg /ml). (left) Representative FACS plots; (right) quantification of the absolute numbers of IFN-γ–producing NK cells. Intracellular cytokine staining was performed using IFN-γ, NK1.1, and NKp46 mAbs. *, P < 0.05. Each group contained five mice. Data are representative of three independent experiments. *, P < 0.05; **, P < 0.01; ***, P < 0.001. Each group contained splenocytes pooled from 5 naive mice.
Figure 4.
Figure 4.
IFN-γ is essential for CD160-mediated tumor control in vivo. (A) Spleens were harvested from RAG−/− and CD160/RAG−/− mice from three conditions: naive, tumor-bearing (day 22 post-tumor inoculation), and poly(I:C) (24 h after 100 µg i.p.). RNA was isolated from splenocytes by TRIzol extraction, reverse transcribed into cDNA, and quantitated by real-time PCR for IFN-γ and HPRT. All data in this figure are representative of three independent experiments. (B) IFN-γ is required for early tumor control. Mice were inoculated with 5 × 10⁵ B16 melanoma cells subcutaneously. These mice were also intraperitoneally administered the anti–IFN-γ mAb (XMG1.2). Antibody treatments were continued on a weekly basis during tumor growth. Tumor volumes were measured every 2 d. (C) To assess control of tumor metastasis, tumor cells were intravenously delivered into recipient mice. Naive RAG−/− and CD160/RAG−/− were retro-orbitally injected with 3 × 10⁵ B16 melanoma cells. After 14 d, mice were sacrificed and lungs were harvested. Black spots in the lungs were counted and graphed. **, P < 0.005. All data presented here are representatives of three independent experiments.
Figure 5.
Figure 5.
CD160 defines the cytokine-producing subset of NK cells. (A) To obtain pure populations of CD160+ versus CD160 NK cells, splenocytes freshly isolated from naive RAG−/− mice were sorted by flow cytometry for NK1.1 and CD160 expression into two fractions: NK cells expressing or lacking CD160. The two NK fractions were stimulated with increasing dosages of IL-2 together with plate-bound anti-NK1.1 (1 µg /ml), and supernatants were measured for cytokines after 48 h in culture. (B) We determined the cytokine production capacity of these subsets by priming mice with poly(I:C) for 18 h before harvesting splenocytes and restimulating the NK with PMA/ionomycin. Splenocytes were surface stained for NK1.1 and CD160, and fixed/permeabilized to stain IFN-γ intracellularly. (C) Donor RAG−/− mice were primed with poly(I:C) (100 µg, i.p.) for 18 h before harvesting of splenocytes, which were then stained for NK1.1 and CD160 for sorting. Sorted fractions of CD160-expressing or CD160-non expressing NK cells were intratumorally injected into RMA-S tumors of CD160−/− mice at 5 × 10⁵ cells per 100 mm3-sized tumors. Tumor sizes were measured every 2 d. (D) To determine the stability of CD160 expression on CD160+ versus CD160 NK cells, WT and CD160−/− naive mice were sacrificed, and freshly isolated splenocytes sorted by FACS for CD3NK1.1+CD160 and CD3NK1.1+CD160+ populations. CD160+ and CD160 populations from both WT and CD160−/− donors were cultured with IL-2 (500 U/ml) for 2, 4, and 6 d. At each time point, cells were harvested, washed, and stained for CD160 expression. Representative FACS plots are shown to indicate CD160 expression levels over the 6 d of culture. Data are representative of three independent experiments.
Figure 6.
Figure 6.
CD160 functionally regulates the NK response to tumor. Groups of mice were inoculated with B16 and RMA-S tumors and received intratumoral injections of CD160-Ig or hIgG isotype control when tumor sizes reached ∼75-100 mm3 in volume, followed by a second injection 3 d later. The fusion proteins were prepared in matrigel suspension at 50 µg/ml for each injection per tumor. (A) B16 tumor sizes were monitored. Figures on the left indicate tumor volumes, while figures on the right indicate the IFN-γ production by splenocytes harvested from tumor-bearing mice corresponding to the end of the tumor curve (day 20 post-inoculation) and cultured with anti-NK1.1 with increasing concentrations of IL-2 for 48 h. *, P < 0.05; **, P < 0.01. (B) Here, the B16 tumor model was halted when the tumors were under 200 mm3 in volume, which was at day 10 post-inoculation, followed by harvesting of splenocytes for NK activation to measure the IFN-γ response. (C) The RMA-S lymphoma model was used instead of B16, and the experiment was performed analogously to Figure 6A. (D) Naive RAG−/− mice were administered CD160-Ig or hIgG isotype control (50 µg) together with poly(I:C) (50 µg) intraperitoneally. After 18 h, spleens were harvested and stimulated ex vivo by plate-bound anti-NK1.1 and IL-2 as described before. Splenocytes were also analyzed by RT-PCR as described before. All data shown are each representative of 3 independent experiments. ***, P < 0.01.
Figure 7.
Figure 7.
CD160 is required intrinsically by NK cells for IFN-γ production. (A) To determine whether CD160 regulates NK cells intrinsically or extrinsically, we generated mixed BM chimeric mice. We used the C57BL/6 strain of mice bearing the congenic marker CD45.1 to demarcate WT hematopoetic cells from the CD45.2 expressing CD160−/− cells. BM (2 × 10⁶ cells) from WT (CD45.1) and CD160−/− (CD45.2) donors were transferred at an equal ratio (1:1) into lethally irradiated (1,000 Rad) WT (CD45.1) recipients. Validation of chimerism was performed by staining peripheral blood lymphocytes. After 6 wk of reconstitution, mice were sacrificed and splenocytes were stimulated in vitro by PMA/ionomycin for intracellular cytokine staining. (A) The percentage of IFN-γ–producing cells are quantitated in the histograms, with representative FACS plots below, showing the IFN-γ staining gated on either CD45.1+ or CD45.2+ CD3NK1.1+ cells. The fraction of IFN-γ+ NK cells were further divided into low versus high, as quantitated in the histograms above. (B) In addition to chimeras with equal ratio of hematopoietic grafts, we generated chimeras in which the dominant hematopoietic source was deficient of CD160 (90% CD160−/−, 10% WT). As in A, histograms quantitating the percentage of IFN-γ–producing NK cells are above the representative FACS plots. *, P < 0.05; ***, P < 0.0005. Data are representative of three independent experiments.
Figure 8.
Figure 8.
HVEM is the functional partner for CD160-dependent IFN-γ by NK cells. (A) The 293-HEK cell line was transiently transfected with an HVEM-expression plasmid using the transfection reagent polyethylenimine (PEI). Surface expression of HVEM was verified by the anti-HVEM mAb (HMHV-1B18). CD160-Ig was biotinylated and tetramized with streptavidin conjugated with the APC fluorophore, and the fusion protein tetramers were used to stain HVEM-transfected 293-HEK cells. (B, top) schematic of ELISA. Plate-bound mHVEM-mIg was incubated with mCD160-hIg and detected with anti–human IgG. (bottom) Adsorbed mHVEM-mIg was incubated with titered, purified mCD160-hIg or control hIgG isotype control. (C) To determine whether HVEM was required on DCs to trigger CD160-dependent IFN-γ production on NK cells, we co-cultured purified NK cells together with BM-derived DCs at a ratio of 1:0.3 of NK-to-DCs. Co-cultures were stimulated with poly(I:C) (100 µg/ml) for 48 h in round-bottom wells, after which supernatants were harvested for detection of cytokines by cytokine bead array. (D) We increased the cell densities while maintaining the same NK/DC ratio as before. The stimulation and measurement proceeded as previously described. *, P < 0.05; **, P < 0.005; ***, P < 0.0005. Data are representative of three independent experiments.

Similar articles

Cited by

References

    1. Agrawal S., Marquet J., Freeman G.J., Tawab A., Bouteiller P.L., Roth P., Bolton W., Ogg G., Boumsell L., and Bensussan A.. 1999. Cutting edge: MHC class I triggering by a novel cell surface ligand costimulates proliferation of activated human T cells. J. Immunol. 162:1223–1226. - PubMed
    1. Altman J.D., and Davis M.M.. 2003. MHC-peptide tetramers to visualize antigen-specific T cells. Curr. Protoc. Immunol. Chapter 17:3. - PubMed
    1. Arase N., Arase H., Park S.Y., Ohno H., Ra C., and Saito T.. 1997. Association with FcRgamma is essential for activation signal through NKR-P1 (CD161) in natural killer (NK) cells and NK1.1+ T cells. J. Exp. Med. 186:1957–1963 10.1084/jem.186.12.1957 - DOI - PMC - PubMed
    1. Barakonyi A., Rabot M., Marie-Cardine A., Aguerre-Girr M., Polgar B., Schiavon V., Bensussan A., and Le Bouteiller P.. 2004. Cutting edge: engagement of CD160 by its HLA-C physiological ligand triggers a unique cytokine profile secretion in the cytotoxic peripheral blood NK cell subset. J. Immunol. 173:5349–5354 10.4049/jimmunol.173.9.5349 - DOI - PubMed
    1. Blasius A.L., Barchet W., Cella M., and Colonna M.. 2007. Development and function of murine B220+CD11c+NK1.1+ cells identify them as a subset of NK cells. J. Exp. Med. 204:2561–2568 10.1084/jem.20070991 - DOI - PMC - PubMed

Publication types

MeSH terms