. 2015 Mar 11;43(5):2927-45.
doi: 10.1093/nar/gkv143. Epub 2015 Feb 20.

Identification and characterization of intracellular proteins that bind oligonucleotides with phosphorothioate linkages

Affiliations

Identification and characterization of intracellular proteins that bind oligonucleotides with phosphorothioate linkages

Xue-hai Liang et al. Nucleic Acids Res. .

Abstract

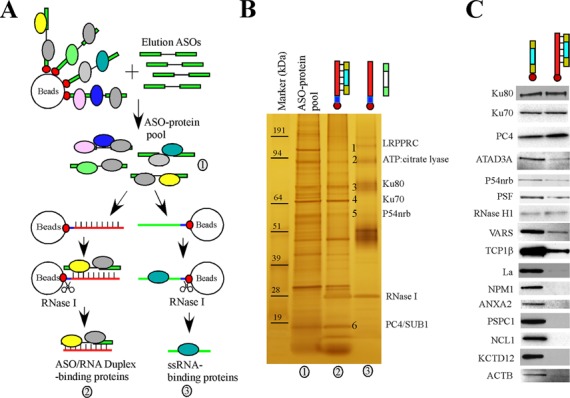
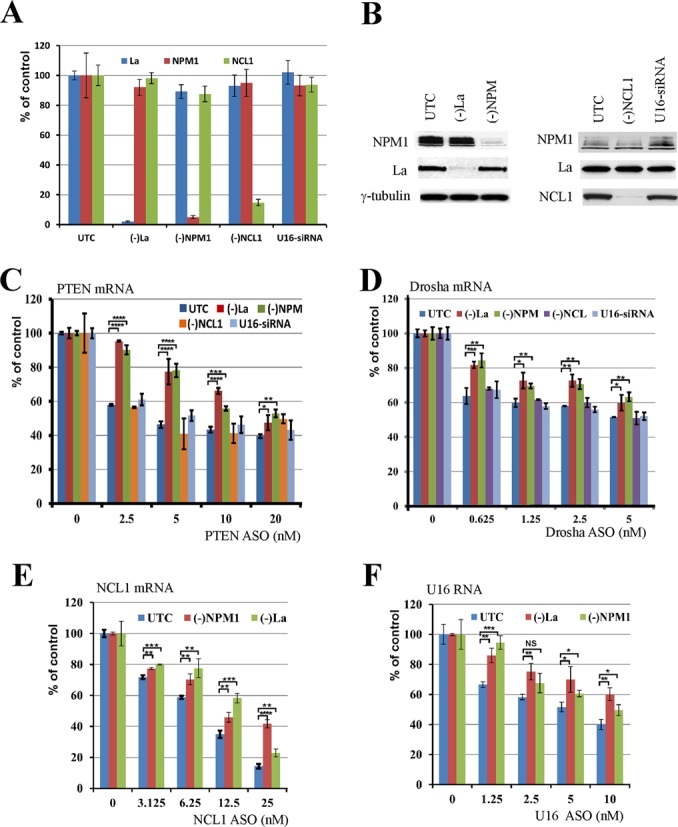
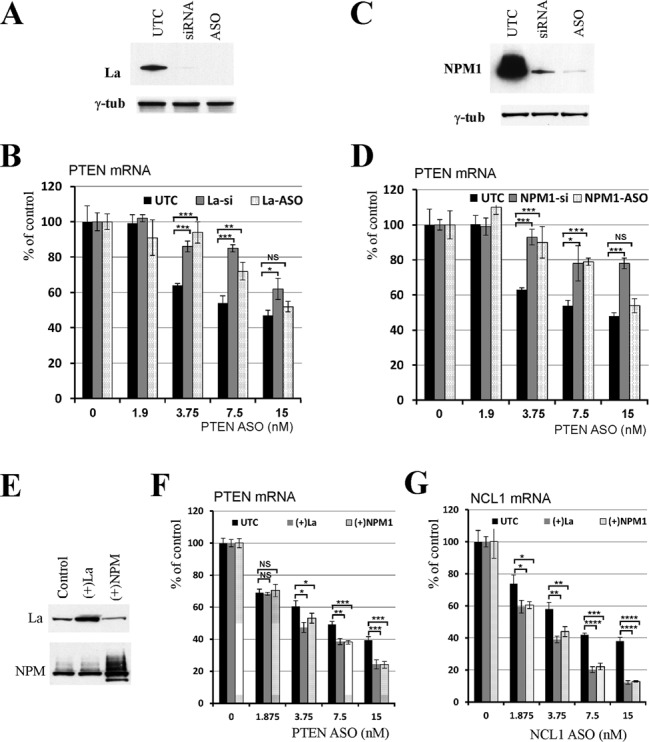
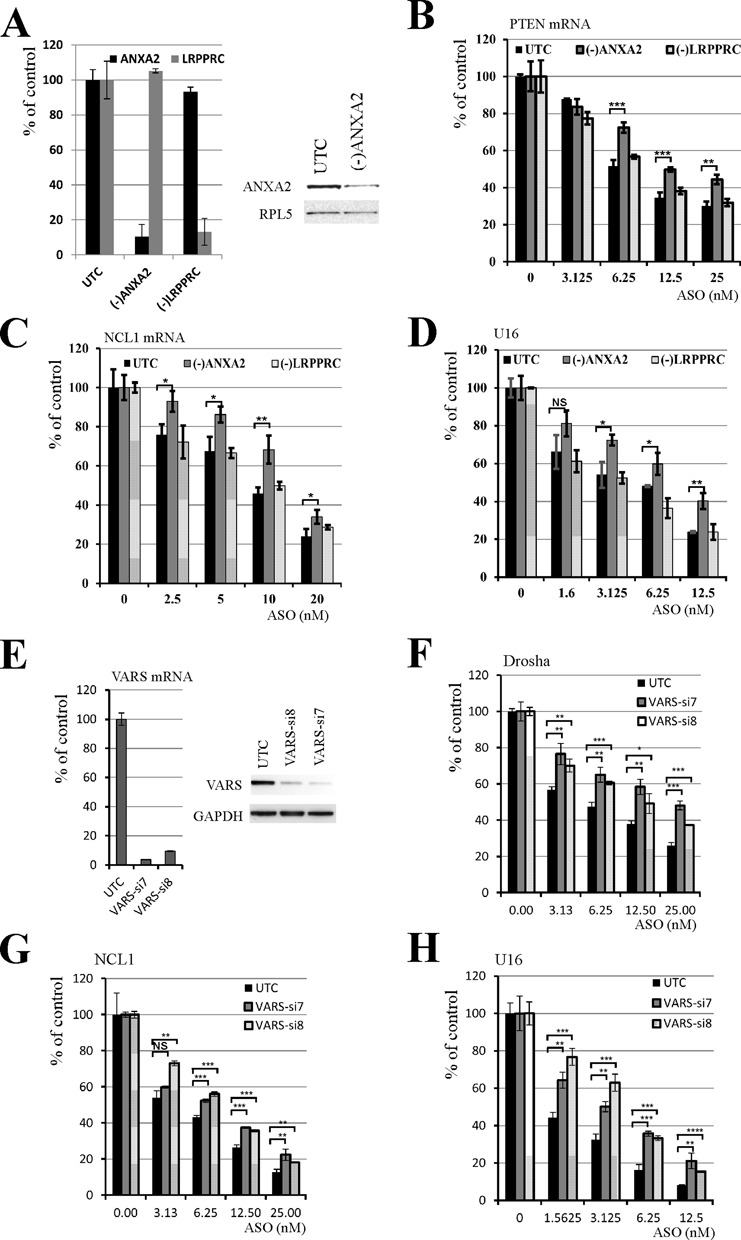
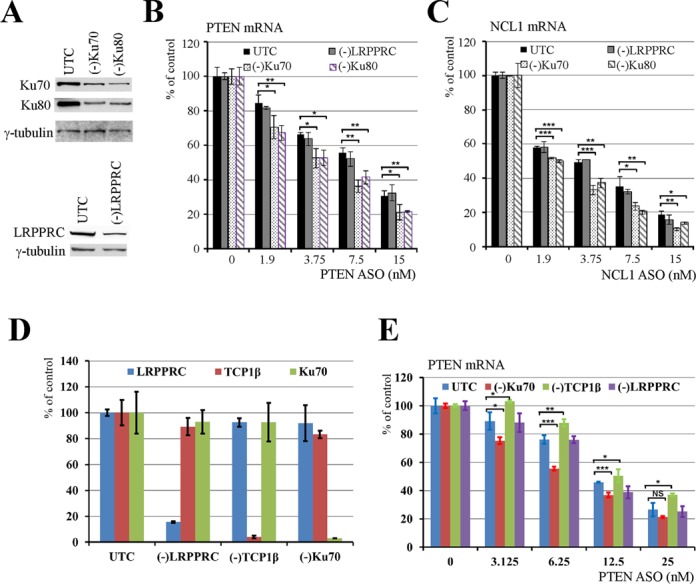
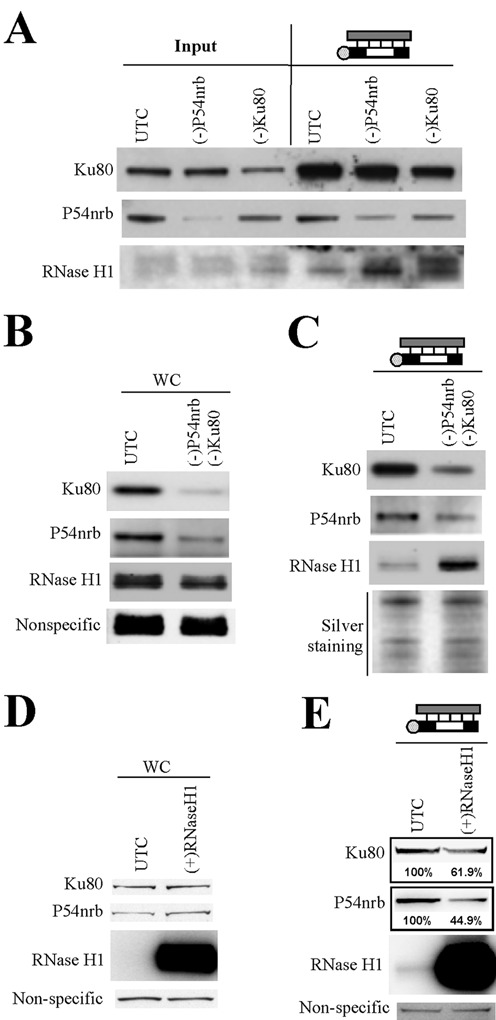
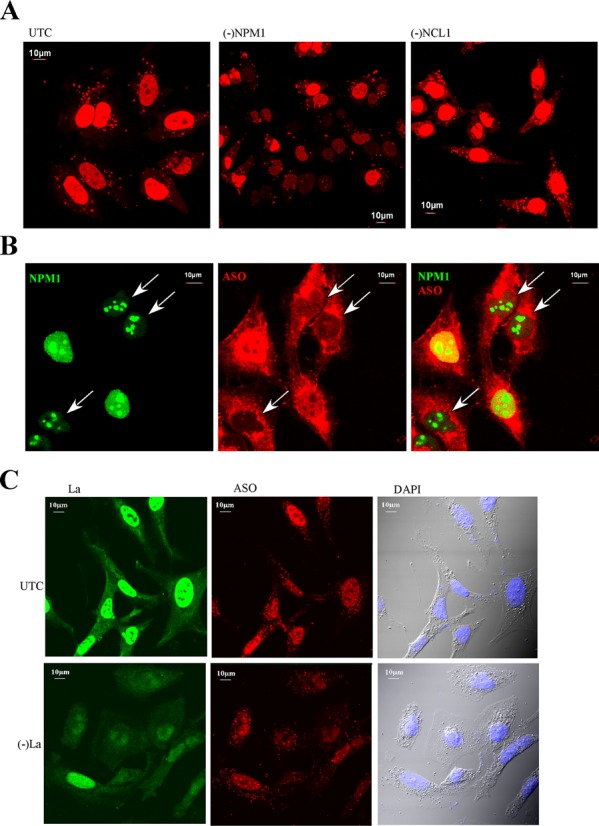
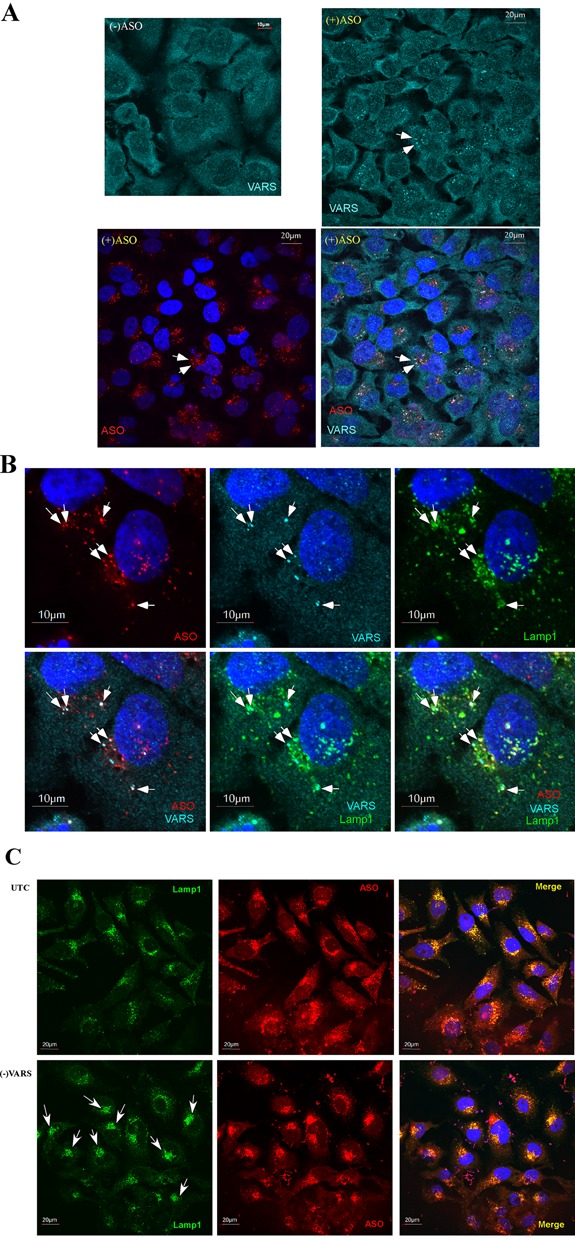
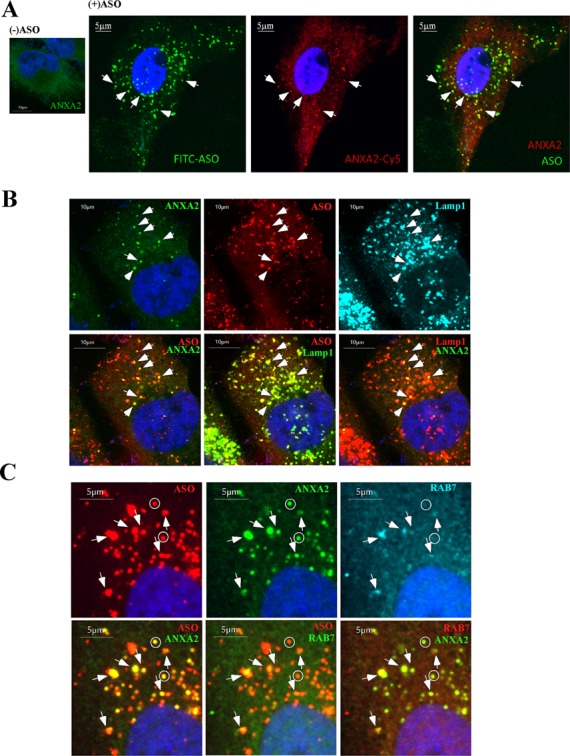
Although the RNase H-dependent mechanism of inhibition of gene expression by chemically modified antisense oligonucleotides (ASOs) has been well characterized, little is known about the interactions between ASOs and intracellular proteins that may alter cellular localization and/or potency of ASOs. Here, we report the identification of 56 intracellular ASO-binding proteins using multi-step affinity selection approaches. Many of the tested proteins had no significant effect on ASO activity; however, some proteins, including La/SSB, NPM1, ANXA2, VARS and PC4, appeared to enhance ASO activities, likely through mechanisms related to subcellular distribution. VARS and ANXA2 co-localized with ASOs in endocytic organelles, and reduction in the level of VARS altered lysosome/ASO localization patterns, implying that these proteins may facilitate ASO release from the endocytic pathway. Depletion of La and NPM1 reduced nuclear ASO levels, suggesting potential roles in ASO nuclear accumulation. On the other hand, Ku70 and Ku80 proteins inhibited ASO activity, most likely by competition with RNase H1 for ASO/RNA duplex binding. Our results demonstrate that phosphorothioate-modified ASOs bind a set of cellular proteins that affect ASO activity via different mechanisms.


Figures

Figure 1.
Figure 1.
Identification of ASO-binding proteins by affinity selection. (A) Schematic of the affinity selection approaches. The ASO-binding proteins are indicated using colored circles. The biotin tag is indicated by the red dots at the ends of the gapmer ASOs. (B) A representative silver-stained 4–12% SDS-PAGE gel used to resolve affinity-selected proteins. Certain protein bands identified by mass spectrometry are numbered and indicated. Proteins were isolated by competition with ASO (lane 1), ASO/RNA-like duplex (lane 2) or a non-complementary RNA-like 2′-O-methyl oligonucleotide (lane 3). The marker was pre-stained protein Benchmark (Life Technologies). (C) Western analyses of proteins isolated with either ssASO or ASO/RNA-like duplex. Isolated proteins were separated on a 4–12% SDS-PAGE, transferred to a membrane, and probed for indicated proteins by immunoblotting.
Figure 2.
Figure 2.
La and NPM1 enhance ASO activity. (A) Levels of mRNAs encoding La and NPM1 were reduced by siRNA treatment for 48 h, as determined by qRT-PCR analyses. Cells treated with NCL1 siRNA or a functionally inactive U16 siRNA were used as controls, and mRNA levels were determined by qRT-PCR. (B) Reduction of La and NPM1 protein levels was confirmed by western analysis. Whole cell lysates from mock-transfected (UTC) or siRNA-treated cells were subjected to western immunoblotting. γ-tubulin served as a loading control. (C–F) Depletion of La or NPM1 protein reduced the activity of ASOs targeting PTEN, drosha, NCL1 and U16 RNAs, respectively. Control cells or cells treated with siRNAs were transfected with indicated concentrations of ASOs for 4 h, and RNA was prepared and subjected to qRT-PCR analyses using primer probe sets specific to each ASO-targeted RNA. Where shown, error bars are standard deviations of three independent experiments. P-values were calculated based on unpaired t-test (n = 3), and the significance is indicated above the bars. ‘NS’: not significant. ‘*’: 0.01<P<0.05; ‘**’: 0.001<P<0.01; ‘***’: 0.0001<P<0.001; and ‘****’: 0.00001<P<0.0001.
Figure 3.
Figure 3.
The effects on ASO activity were specific to depletion of La or NPM1. (A) Western analysis for La protein in cells treated with either siRNA or an ASO targeting La mRNA. γ-tubulin served as a loading control. UTC indicates mock-transfected cells. (B) Reduction of La levels by either siRNA or ASO caused similar effects on the activity of an ASO targeting PTEN mRNA. ASO treatment and qRT-PCR analysis were performed as described in Figure 2. (C) NPM1 protein was reduced by either an siRNA or an ASO targeting NPM1 mRNA as determined by western. γ-tubulin was used as a loading control. (D) Reduction of NPM1 protein by either siRNA or ASO decreased the activity of an ASO targeting PTEN mRNA. (E) La or NPM1 was transiently over-expressed in HeLa cells. After 48 h, protein levels were detected by western. (F, G) Over-expression of La or NPM1 protein increased the activity of ASOs targeting PTEN or NCL1 mRNAs, respectively. Where shown, the error bars are standard deviations of three independent experiments. P-values were calculated based on unpaired t-test (n = 3), and the significance is indicated above the bars. ‘NS’: not significant. ‘*’: 0.01<P<0.05; ‘**’: 0.001<P<0.01; ‘***’: 0.0001<P<0.001; and ‘****’: 0.00001<P<0.0001.
Figure 4.
Figure 4.
ANXA2 and VARS enhance ASO activity. (A) HeLa cells were either mock transfected (UTC) or treated with ANXA2 siRNA or a control LRPPRC siRNA for 32 h, and total RNA was prepared from an aliquot of cells and subjected to qRT-PCR analysis for ANXA2 or LRPPRC mRNA (left panel). Whole cell lysates prepared from an aliquot of cells were subjected to western analysis for ANXA2 (right panel). RPL5 served as a loading control. (B–D) Reduction of ANXA2, but not LRPPRC, decreased the activity of ASOs targeting (B) PTEN, (C) NCL1 or (D) U16 RNAs. Control or siRNA-treated cells were transfected with ASOs targeting indicated mRNAs, and the antisense activity was determined by qRT-PCR. (E) VARS expression in HeLa cells was reduced by treatment with two different siRNAs. VARS mRNA (left) and protein (right) levels were detected by qRT-PCR or western analysis, respectively. GAPDH protein served as a loading control. (F–H) Reduction of VARS protein decreased the antisense activity of ASOs targeting (F) drosha, (G) NCL1 and (H) U16 RNAs, as determined by qRT-PCR analyses. Where shown, error bars are standard deviations of three independent experiments. P-values were calculated based on unpaired t-test (n = 3), and the significance is indicated above the bars. ‘NS’: not significant. ‘*’: 0.01<P<0.05; ‘**’: 0.001<P<0.01; ‘***’: 0.0001<P<0.001; and ‘****’: 0.00001<P<0.0001.
Figure 5.
Figure 5.
Ku70 and Ku80 inhibit ASO activity. (A) siRNA mediated reduction of Ku70 or Ku80 proteins. siRNA targeting LRPPRC was used as a negative control. Whole cell lysates from control cells or cells treated with siRNAs for 36 h were subjected to western analyses for Ku70 or Ku80 protein. γ-tubulin served as a loading control. (B, C) Reduction of Ku70 or Ku80 protein, but not LRPPRC, increased the activity of ASOs targeting (B) PTEN and (C) NCL1 mRNAs as detected by qRT-PCR. (D) Reduction of Ku70, TCP1β or LRPPRC mRNAs by siRNA treatment was demonstrated by qRT-PCR. (E) qRT-PCR analysis for ASO-directed PTEN mRNA reduction in different test cells. Where shown, the error bars are standard deviations of three independent experiments. P-values were calculated based on unpaired t-test (n = 3), and the significance is indicated above the bars. ‘NS’: not significant. ‘*’: 0.01<P<0.05; ‘**’: 0.001<P<0.01; ‘***’: 0.0001<P<0.001; and ‘****’: 0.00001<P<0.0001.
Figure 6.
Figure 6.
Ku80 and P54nrb compete with RNase H1 for binding to ASO/RNA duplex. (A) Reduction of P54nrb or Ku80 protein levels by siRNA treatment increased the binding of RNase H1 protein to the ASO/RNA-like duplex, as determined by affinity selection using an ASO/RNA-like duplex, followed by western analyses. (B) Simultaneous treatment with siRNAs targeting P54nrb and Ku80 reduced levels of both proteins, as shown by western analysis. (C) Simultaneous reduction of P54nrb and Ku80 led to a significant increase in the binding of RNase H1 to the ASO/RNA-like duplex. Silver staining of an aliquot of the affinity selected proteins analyzed on a separate SDS-PAGE is shown as a loading control. (D) The protein levels of RNase H1, Ku80 and P54nrb in control cells (UTC) or cells over-expressing RNase H1 were evaluated by western blot. (E) Over-expression of RNase H1 led to reduced binding of P54nrb and Ku80 proteins to the ASO/RNA-like duplex, as determined by affinity selection followed by western analyses. The numbers below the lanes indicate the estimated protein level relative to control.
Figure 7.
Figure 7.
Reduction of NPM1 or La can moderately reduce nuclear ASO levels. (A) Control cells or cells depleted of NPM1 or NCL1 were transfected with 50-nM cy3-labeled ASOs (red) for 5 h, and images of live cells were taken. In many NPM1-siRNA-treated cells nuclear ASO levels were reduced as compared with control cells or NCL1-siRNA-treated cells. (B) NPM1-siRNA-treated cells and control cells were mixed, reseeded and transfected with 50-nM cy3-labeled ASO. After 5 h, cells were fixed and stained for NPM1 protein. The arrows indicate cells in which NPM1 levels are reduced. (C) Reduction of La protein (green) by treatment with La-siRNA moderately reduced the nuclear ASO level, as compared with the levels in control cells. Scale bars: 10 μm.
Figure 8.
Figure 8.
VARS can co-localize with ASOs in Lamp1-stained structures upon free uptake and can affect lysosome pattern. (A) VARS staining (cyan) in control cells [(-)ASO] or cells incubated with 2-μM cy3-labeled ASOs (red) for 24 h. Upon ASO incubation, VARS appears in aggregated dot structures that co-localize with ASOs (exemplified by arrows). Scale bars: 20 μm. (B) VARS/ASO-containing structures co-localized with Lamp1, as indicated by arrows. HeLa cells incubated with 2-μM Cy3-labeled ASOs for 24 h were fixed and co-stained for VARS and Lamp1. Scale bars: 10 μm. (C) Reduction of VARS led to more condensed ASO/lysosome localization in perinuclear structures, as indicated by arrows. Control cells or cells treated with VARS-siRNA for 24 h were incubated with 2-μM ASO for an additional 24 h, then fixed and stained for Lamp1. Scale bars: 20 μm.
Figure 9.
Figure 9.
ANXA2 can co-localize with ASOs in late endosomes/lysosomes upon free uptake. (A) ANXA2 staining in control cells (left panel) or cells incubated with 2-μM FITC-labeled ASOs for 24 h (right panels). ANXA2-stained structures that co-localize with ASOs are exemplified by arrows. Scale bars: 5 μm. (B) Co-staining of ANXA2 and Lamp1 in cells incubated with 2-μM Cy3-labeled ASOs for 24 h. Arrows indicate the co-localization of ASO, ANXA2 and Lamp1. Scale bars: 10 μm. (C) Co-staining of ANXA2 and Rab7 in cells incubated with 2-μM Cy3-labeled ASOs for 24 h. Co-localization of ASO/ANXA2/Rab7 is exemplified by arrows; whereas some ANXA2/ASO containing structures that do not co-localize with Rab7 are indicated by circles. Scale bars: 5 μm.

References

    1. Lima W., Wu H., Crooke S.T. The RNase H Mechanism. In: Crooke ST, editor. Antisense Drug Technology—Principles, Strategies, and Applications. 2nd edn. Boca Raton, FL: CRC Press; 2008. pp. 47–74.
    1. Crooke S.T., Vickers T.A., Lima W.F., Wu H.-J. Mechanisms of Antisense Drug Action, an Introduction. In: Crooke ST, editor. Antisense Drug Technology—Principles, Strategies, and Applications. 2nd edn. Boca Raton, FL: CRC Press; 2008. pp. 3–46.
    1. Watts J.K., Corey D.R. Silencing disease genes in the laboratory and the clinic. J. Pathol. 2012;226:365–379. - PMC - PubMed
    1. Nowotny M., Gaidamakov S.A., Crouch R.J., Yang W. Crystal structures of RNase H bound to an RNA/DNA hybrid: substrate specificity and metal-dependent catalysis. Cell. 2005;121:1005–1016. - PubMed
    1. Wu H., Lima W.F., Zhang H., Fan A., Sun H., Crooke S.T. Determination of the role of the human RNase H1 in the pharmacology of DNA-like antisense drugs. J. Biol. Chem. 2004;279:17181–17189. - PubMed

Publication types

MeSH terms