. 2015 Apr 15;75(8):1760-9.
doi: 10.1158/0008-5472.CAN-14-3621. Epub 2015 Feb 20.

Hyperthermia Sensitizes Glioma Stem-like Cells to Radiation by Inhibiting AKT Signaling

Affiliations

Hyperthermia Sensitizes Glioma Stem-like Cells to Radiation by Inhibiting AKT Signaling

Jianghong Man et al. Cancer Res. .

Abstract

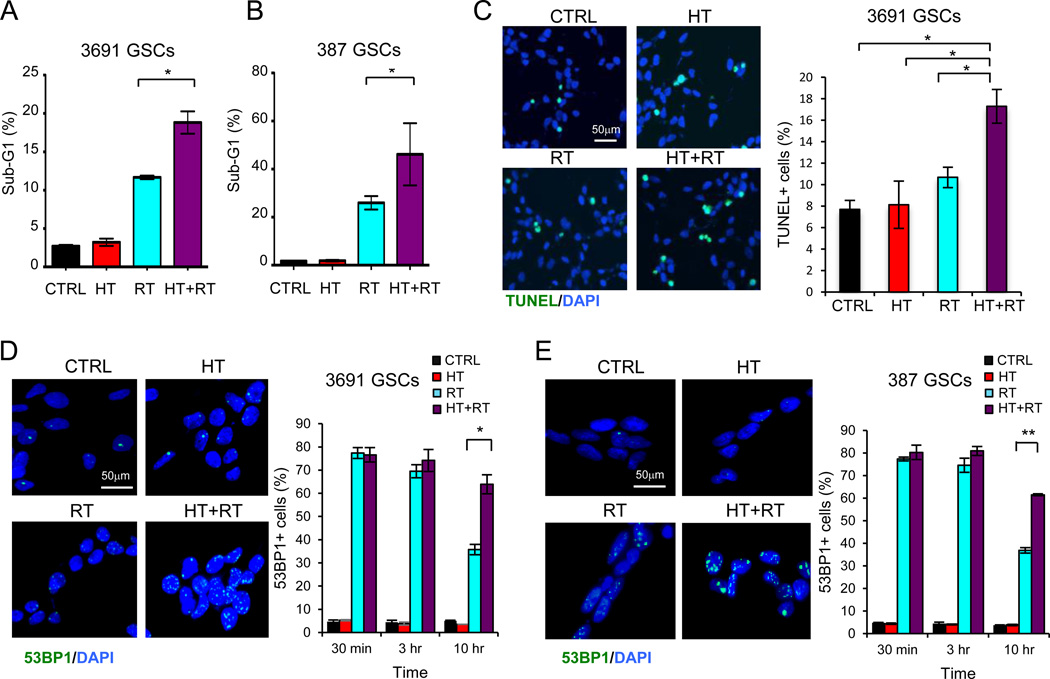
Glioma stem-like cells (GSC) are a subpopulation of cells in tumors that are believed to mediate self-renewal and relapse in glioblastoma (GBM), the most deadly form of primary brain cancer. In radiation oncology, hyperthermia is known to radiosensitize cells, and it is reemerging as a treatment option for patients with GBM. In this study, we investigated the mechanisms of hyperthermic radiosensitization in GSCs by a phospho-kinase array that revealed the survival kinase AKT as a critical sensitization determinant. GSCs treated with radiation alone exhibited increased AKT activation, but the addition of hyperthermia before radiotherapy reduced AKT activation and impaired GSC proliferation. Introduction of constitutively active AKT in GSCs compromised hyperthermic radiosensitization. Pharmacologic inhibition of PI3K further enhanced the radiosensitizing effects of hyperthermia. In a preclinical orthotopic transplant model of human GBM, thermoradiotherapy reduced pS6 levels, delayed tumor growth, and extended animal survival. Together, our results offer a preclinical proof-of-concept for further evaluation of combined hyperthermia and radiation for GBM treatment.


Conflict of interest statement

Authors report no conflict of interest.

Figures

Figure 1
Figure 1. Hyperthermia sensitizes GSCs to radiation and impairs self-renewal
(A-B) GSC specimens 3691 (A) and 387 (B) were treated with increasing doses of radiation (RT) or combined hyperthermia and radiation (HT+RT, 42.5°C for 1 hr followed by the indicated RT dose) and spheres were counted on day 7. (C-D) Representative images (left) of colony formation in GSC specimens 3691 (C) and 387 (D) treated with hyperthermia (HT, 42.5°C for 1 hr), radiation (RT, 2 Gy) or combined hyperthermia and radiation (HT+RT, 42.5°C for 1 hr followed by 2 Gy) and quantification of colonies (right). (E-F) Representative images of tumorspheres (left) of GSCs 3691 (E) and 387 (F) treated as indicated with quantification of tumorspheres (right). Graphed data are means ± SD (n=3). * denotes p < 0.05, ** denotes p < 0.01, *** denotes p < 0.001.
Figure 2
Figure 2. Thermoradiotherapy reduces GSC viability and proliferation
(A-B) GSCs were treated as described in Figure 1 and absolute cell counts are shown. Cell numbers were counted every 2 days. Data are means ± SD (n=3). (C-D) Quantification of relative fraction of Ki67+ cells on day 0 and day 3 post-treatment are shown. The fractions of Ki67+ cells were normalized to the control group. (E-F) Representative staining of Ki67 in GSCs is shown. Nuclei were counterstained with DAPI (blue). HT: hyperthermia, RT: radiation, HT+RT: hyperthermia and radiation. * denotes p < 0.05.
Figure 3
Figure 3. Thermoradiotherapy impairs DNA damage repair and induces cell death
(A-B) GSCs were treated as described in Figure 1. Quantification of the sub-G1 population of GSCs as assessed by flow cytometry. (C) Representative TUNEL (green) staining on 3691 GSCs 48 hours after indicated therapy (left) and quantification of fraction of TUNEL+ cells are shown (right). (D-E) Representative 53BP1 staining (green) in GSCs 10 hours after the indicated treatments is shown (left). Nuclei were counterstained with DAPI (blue). Quantification of the fraction of 53BP1+ cells at indicated times after treatment is shown (left). Nuclei with more than five 53BP1 foci staining were scored as positive. Graphs represent the fraction of 53BP1+ cells over total cell number. HT: hyperthermia, RT: radiation, HT+RT: hyperthermia and radiation. Graphed data are means ± SD (n=3). * denotes p < 0.05, ** denotes p < 0.01.
Figure 4
Figure 4. Hyperthermia inhibits radiation-induced AKT activation in GSCs
(A) GSCs were treated as described in Figure 1 and human phospho-kinase array was performed with GSCs lysates as indicated. Select phosphorylated proteins on the kinase array membrane are indicated. (B) Cells were treated as described in Figure 1. Western blot analysis on components of AKT signaling and phosphor-ERK in GSCs and non-stem tumor cells (NSTCs) are shown. Quantification of Western blot analysis was done by ImageJ, and the relative density is provided at the bottom of each Western blot, respectively. (C) Western blot of phosphorylated AKT in GSCs stably transduced with constitutively activated MYR-AKT or GFP is shown. (D) Representative images of colony formation (left) and quantification of colony number (right) is shown in GSCs expressing MYR-AKT or GFP. (E) Representative images of GSC colony formation after treatment with LY294002 or vehicle control as indicated. Graphed data are means ± SD (n=3). HT: hyperthermia, RT: radiation, HT+RT: hyperthermia and radiation. * denotes p < 0.05.
Figure 5
Figure 5. Thermoradiotherapy suppressed GBM growth and increased survival
(A) Representative images of cross-sections (hematoxylin and eosin [H&E] stained) of mouse brains harvested on day 5 post-treatment. (B-C) Immunohistochemical staining for phospho-S6 (B) and Ki67 (C) in GBM xenografts treated as indicated are shown. (D-E) Quantification of fraction of phospho-S6+ and Ki67+ tumor cells to total tumor cells in the indicated group is shown. (F) Kaplan-Meier analysis of neurologic-sign-free survival of mice (n=26) treated as indicated revealing improved survival in mice treated with thermoradiotherapy vs. radiation alone, p=0.0231. Mouse survival data was confirmed in an independent cohort of 38 mice. Graphed data are means ± SD (n=3). HT: hyperthermia, RT: radiation, HT+RT: hyperthermia and radiation. * denotes p < 0.05, ** denotes p< 0.01, *** denotes p< 0.001.

References

    1. Ostrom QT, Gittleman H, Liao P, Rouse C, Chen Y, Dowling J, et al. CBTRUS Statistical Report: Primary Brain and Central Nervous System Tumors Diagnosed in the United States in 2007–2011. Neuro-oncology. 2014;16(suppl 4):iv1–iv63. - PMC - PubMed
    1. Stupp R, Hegi ME, Mason WP, van den Bent MJ, Taphoorn MJ, Janzer RC, et al. Effects of radiotherapy with concomitant and adjuvant temozolomide versus radiotherapy alone on survival in glioblastoma in a randomised phase III study: 5-year analysis of the EORTC-NCIC trial. The lancet oncology. 2009;10(5):459–466. - PubMed
    1. Walker MD, Strike TA, Sheline GE. An analysis of dose-effect relationship in the radiotherapy of malignant gliomas. International journal of radiation oncology, biology, physics. 1979;5(10):1725–1731. - PubMed
    1. Singh SK, Hawkins C, Clarke ID, Squire JA, Bayani J, Hide T, et al. Identification of human brain tumour initiating cells. Nature. 2004;432(7015):396–401. - PubMed
    1. Bao S, Wu Q, McLendon RE, Hao Y, Shi Q, Hjelmeland AB, et al. Glioma stem cells promote radioresistance by preferential activation of the DNA damage response. Nature. 2006;444(7120):756–760. - PubMed

Publication types

MeSH terms

Substances