PDK1 and SGK3 Contribute to the Growth of BRAF-Mutant Melanomas and Are Potential Therapeutic Targets
- PMID: 25712345
- PMCID: PMC4383687
- DOI: 10.1158/0008-5472.CAN-14-2785
PDK1 and SGK3 Contribute to the Growth of BRAF-Mutant Melanomas and Are Potential Therapeutic Targets
Abstract
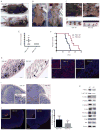
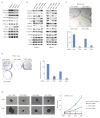
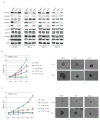
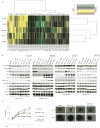
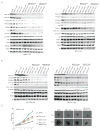
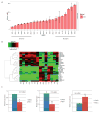
Melanoma development involves members of the AGC kinase family, including AKT, PKC, and, most recently, PDK1, as elucidated recently in studies of Braf::Pten mutant melanomas. Here, we report that PDK1 contributes functionally to skin pigmentation and to the development of melanomas harboring a wild-type PTEN genotype, which occurs in about 70% of human melanomas. The PDK1 substrate SGK3 was determined to be an important mediator of PDK1 activities in melanoma cells. Genetic or pharmacologic inhibition of PDK1 and SGK3 attenuated melanoma growth by inducing G1 phase cell-cycle arrest. In a synthetic lethal screen, pan-PI3K inhibition synergized with PDK1 inhibition to suppress melanoma growth, suggesting that focused blockade of PDK1/PI3K signaling might offer a new therapeutic modality for wild-type PTEN tumors. We also noted that responsiveness to PDK1 inhibition associated with decreased expression of pigmentation genes and increased expression of cytokines and inflammatory genes, suggesting a method to stratify patients with melanoma for PDK1-based therapies. Overall, our work highlights the potential significance of PDK1 as a therapeutic target to improve melanoma treatment.
©2015 American Association for Cancer Research.
Conflict of interest statement
Figures

Similar articles
-
Genetic inactivation or pharmacological inhibition of Pdk1 delays development and inhibits metastasis of Braf(V600E)::Pten(-/-) melanoma.Oncogene. 2014 Aug 21;33(34):4330-9. doi: 10.1038/onc.2013.383. Epub 2013 Sep 16. Oncogene. 2014. PMID: 24037523 Free PMC article.
-
Small molecule inhibition of polo-like kinase 1 by volasertib (BI 6727) causes significant melanoma growth delay and regression in vivo.Cancer Lett. 2017 Jan 28;385:179-187. doi: 10.1016/j.canlet.2016.10.025. Epub 2016 Oct 25. Cancer Lett. 2017. PMID: 27793694 Free PMC article.
-
Characterization of GSK2334470, a novel and highly specific inhibitor of PDK1.Biochem J. 2011 Jan 15;433(2):357-69. doi: 10.1042/BJ20101732. Biochem J. 2011. PMID: 21087210
-
Novel inhibitors in the treatment of metastatic melanoma.Expert Rev Anticancer Ther. 2007 May;7(5):715-24. doi: 10.1586/14737140.7.5.715. Expert Rev Anticancer Ther. 2007. PMID: 17492934 Review.
-
Therapeutic targets in melanoma: map kinase pathway.Curr Oncol Rep. 2006 Sep;8(5):400-5. doi: 10.1007/s11912-006-0065-x. Curr Oncol Rep. 2006. PMID: 16901402 Review.
Cited by
-
A Transcriptionally Inactive ATF2 Variant Drives Melanomagenesis.Cell Rep. 2016 May 31;15(9):1884-92. doi: 10.1016/j.celrep.2016.04.072. Epub 2016 May 19. Cell Rep. 2016. PMID: 27210757 Free PMC article.
-
Insulin augments serotonin-induced contraction via activation of the IR/PI3K/PDK1 pathway in the rat carotid artery.Pflugers Arch. 2016 Apr;468(4):667-77. doi: 10.1007/s00424-015-1759-4. Epub 2015 Nov 17. Pflugers Arch. 2016. PMID: 26577585
-
Serine/Threonine Kinase 3-Phosphoinositide-Dependent Protein Kinase-1 (PDK1) as a Key Regulator of Cell Migration and Cancer Dissemination.Cancers (Basel). 2017 Mar 11;9(3):25. doi: 10.3390/cancers9030025. Cancers (Basel). 2017. PMID: 28287465 Free PMC article. Review.
-
DNMT3b Modulates Melanoma Growth by Controlling Levels of mTORC2 Component RICTOR.Cell Rep. 2016 Mar 8;14(9):2180-2192. doi: 10.1016/j.celrep.2016.02.010. Epub 2016 Feb 25. Cell Rep. 2016. PMID: 26923591 Free PMC article.
-
AutoEncoder-Based Computational Framework for Tumor Microenvironment Decomposition and Biomarker Identification in Metastatic Melanoma.Front Genet. 2021 May 27;12:665065. doi: 10.3389/fgene.2021.665065. eCollection 2021. Front Genet. 2021. PMID: 34122516 Free PMC article.
References
-
- Mora A, Komander D, van Aalten DM, Alessi DR. PDK1, the master regulator of AGC kinase signal transduction. Seminars in cell & developmental biology. 2004;15(2):161–70. - PubMed
-
- Pearce LR, Komander D, Alessi DR. The nuts and bolts of AGC protein kinases. Nature reviews Molecular cell biology. 2010;11(1):9–22. - PubMed
Publication types
MeSH terms
Substances
Grants and funding
LinkOut - more resources
Full Text Sources
Medical
Molecular Biology Databases
Research Materials
Miscellaneous

