

Ambient air pollution and adult asthma incidence in six European cohorts (ESCAPE)
- PMID: 25712593
- PMCID: PMC4455584
- DOI: 10.1289/ehp.1408206
Ambient air pollution and adult asthma incidence in six European cohorts (ESCAPE)
Abstract
Background: Short-term exposure to air pollution has adverse effects among patients with asthma, but whether long-term exposure to air pollution is a cause of adult-onset asthma is unclear.
Objective: We aimed to investigate the association between air pollution and adult onset asthma.
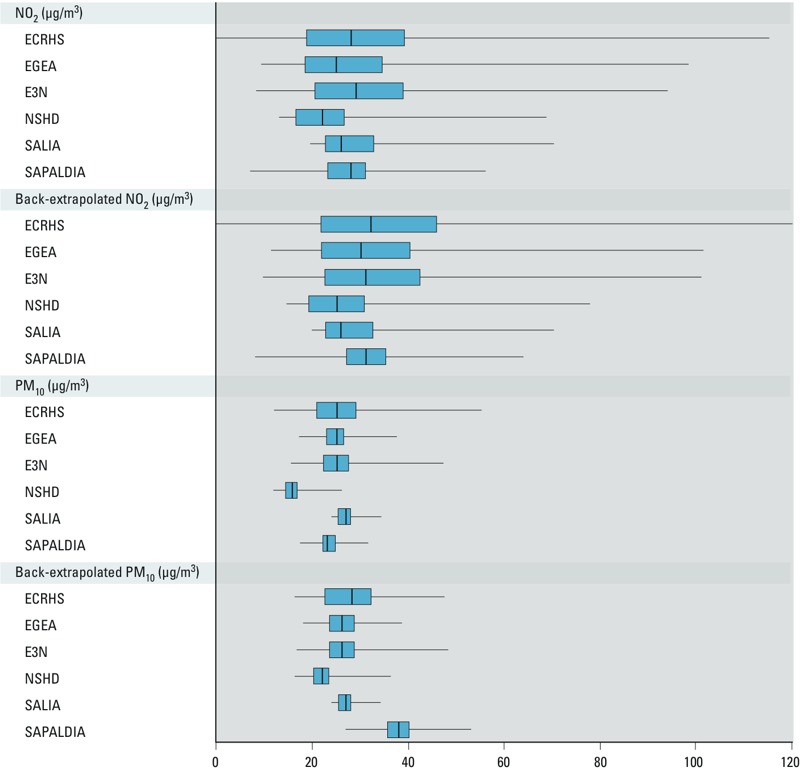
Methods: Asthma incidence was prospectively assessed in six European cohorts. Exposures studied were annual average concentrations at home addresses for nitrogen oxides assessed for 23,704 participants (including 1,257 incident cases) and particulate matter (PM) assessed for 17,909 participants through ESCAPE land-use regression models and traffic exposure indicators. Meta-analyses of cohort-specific logistic regression on asthma incidence were performed. Models were adjusted for age, sex, overweight, education, and smoking and included city/area within each cohort as a random effect.
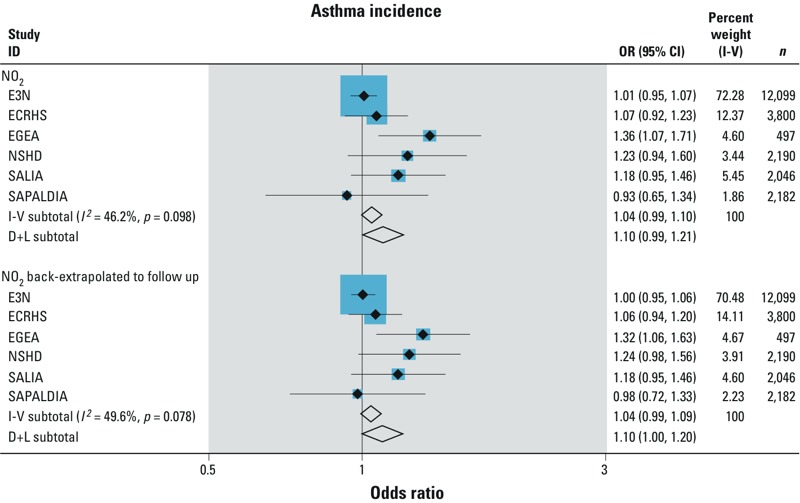
Results: In this longitudinal analysis, asthma incidence was positively, but not significantly, associated with all exposure metrics, except for PMcoarse. Positive associations of borderline significance were observed for nitrogen dioxide [adjusted odds ratio (OR) = 1.10; 95% CI: 0.99, 1.21 per 10 μg/m3; p = 0.10] and nitrogen oxides (adjusted OR = 1.04; 95% CI: 0.99, 1.08 per 20 μg/m3; p = 0.08). Nonsignificant positive associations were estimated for PM10 (adjusted OR = 1.04; 95% CI: 0.88, 1.23 per 10 μg/m3), PM2.5 (adjusted OR = 1.04; 95% CI: 0.88, 1.23 per 5 μg/m3), PM2.5absorbance (adjusted OR = 1.06; 95% CI: 0.95, 1.19 per 10-5/m), traffic load (adjusted OR = 1.10; 95% CI: 0.93, 1.30 per 4 million vehicles × meters/day on major roads in a 100-m buffer), and traffic intensity (adjusted OR = 1.10; 95% CI: 0.93, 1.30 per 5,000 vehicles/day on the nearest road). A nonsignificant negative association was estimated for PMcoarse (adjusted OR = 0.98; 95% CI: 0.87, 1.14 per 5 μg/m3).
Conclusions: Results suggest a deleterious effect of ambient air pollution on asthma incidence in adults. Further research with improved personal-level exposure assessment (vs. residential exposure assessment only) and phenotypic characterization is needed.
Conflict of interest statement
The authors declare they have no actual or potential competing financial interests.
Figures
References
-
- Ackermann-Liebrich U, Kuna-Dibbert B, Probst-Hensch NM, Schindler C, Felber Dietrich D, Stutz EZ, et al. Follow-up of the Swiss Cohort Study on Air Pollution and Lung Diseases in Adults (SAPALDIA 2) 1991–2003: methods and characterization of participants. Soz Praventivmed. 2005;50:245–263. - PubMed
-
- Anderson HR, Favarato G, Atkinson RW. Long-term exposure to air pollution and the incidence of asthma: meta-analysis of cohort studies. Air Qual Atmos Health. 2013;6:47–56.
-
- Antó JM, Sunyer J, Basagaña X, Garcia-Esteban R, Cerveri I, de Marco R, et al. Risk factors of new-onset asthma in adults: a population-based international cohort study. Allergy. 2010;65:1021–1030. - PubMed
-
- Basagaña X, Aguilera I, Rivera M, Agis D, Foraster M, Marrugat J, et al. Measurement error in epidemiologic studies of air pollution based on land-use regression models. Am J Epidemiol. 2013;178:1342–1346. - PubMed
-
- Beelen R, Hoek G, Vienneau D, Eeftens M, Dimakopoulou K, Pedeli X, et al. Development of NO2 and NOx land use regression models for estimating air pollution exposure in 36 study areas in Europe—the ESCAPE project. Atmos Environ. 2013;72:10–23.
