

Annexin A2 is required for the early steps of cytokinesis
- PMID: 25712672
- PMCID: PMC4388614
- DOI: 10.15252/embr.201440015
Annexin A2 is required for the early steps of cytokinesis
Abstract
Cytokinesis requires the formation of an actomyosin contractile ring between the two sets of sister chromatids. Annexin A2 is a calcium- and phospholipid-binding protein implicated in cortical actin remodeling. We report that annexin A2 accumulates at the equatorial cortex at the onset of cytokinesis and depletion of annexin A2 results in cytokinetic failure, due to a defective cleavage furrow assembly. In the absence of annexin A2, the small GTPase RhoA-which regulates cortical cytoskeletal rearrangement-fails to form a compact ring at the equatorial plane. Furthermore, annexin A2 is required for cortical localization of the RhoGEF Ect2 and to maintain the association between the equatorial cortex and the central spindle. Our results demonstrate that annexin A2 is necessary in the early phase of cytokinesis. We propose that annexin A2 participates in central spindle-equatorial plasma membrane communication.
Keywords: RhoA; annexin A2; cytokinesis; mitosis.
© 2015 The Authors.
Figures
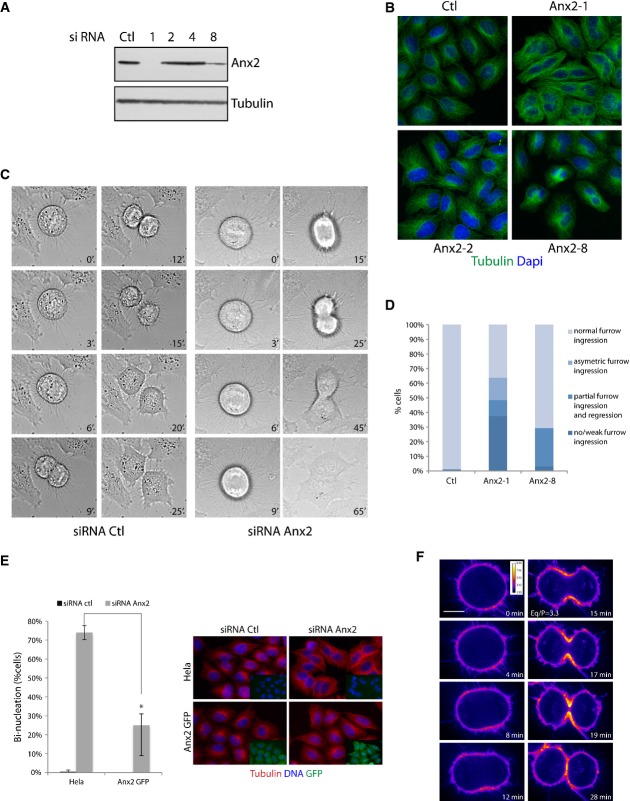
Immunoblot analysis of total cell extracts of HeLa cells transfected with control RNAi or four independent Anx2 siRNAs (1, 2, 4, 8). Extracts were probed with anti-annexin A2 and anti-tubulin antibodies.
Bi-nucleation of asynchronous HeLa cells 48 h after transfection with the indicated siRNA.
Phase contrast live cell imaging of HeLa cells transfected with control siRNA or Anx2-1 siRNA. Time point t = 0 was set at the metaphase–anaphase transition.
Quantification of the cytokinetic phenotypes observed in live cell imaging after transfection with control siRNA, Anx2-1 siRNA or Anx2-8 siRNA (n ≥ 167 dividing cells) P = 0.001 for three independent experiments, Student's t-test. The categories asymmetric furrow ingression, no/weak furrow ingression and partial furrow ingression and regression all resulted in the formation of binucleated cells. Phenotypes illustrated in Supplementary Movies S1, S2, S3 and S4.
Dividing HeLa and siRNA-resistant annexin A2-GFP HeLa cells were monitored by video microscopy 36 h post-transfection with control or Anx2-1 siRNA. Quantification of binucleation is presented in percentage of number of cells undergoing mitosis during the time lapse (graph). Error bars, SD of three experiments (n ≥ 100). *P = 0.005, Student's t-test. Cells were fixed and labeled for tubulin, DNA and GFP (right panel). Immunoblot characterizing the cells is shown in Supplementary Fig S2.
Spinning confocal images of annexin A2-GFP HeLa cells (LUT fire). Time point t = 0 was set at the metaphase–anaphase transition. Scale bar, 10 μm. Eq/P represents the ratio of equatorial over polar GFP intensity as described in Fig3D (SD = 0.77, n = 22). Full sequence presented in Supplementary Movie S5.
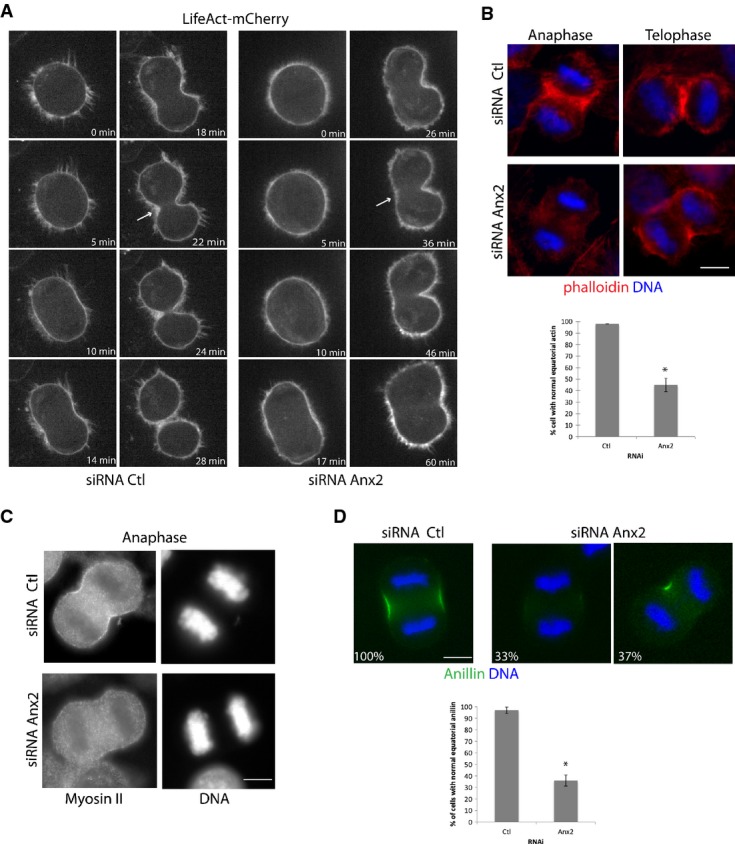
A Spinning confocal images of HeLa cells expressing the filamentous actin biosensor Life Act. Anx2 siRNA-transfected cells undergoing asymmetric furrow ingression display decreased actin accumulation on the non-invaginating side of the equatorial cortex (arrow) compared to the Ctl RNAi-treated cells. For full sequence, see Supplementary Movies S6 and S7.
B-D HeLa cells treated with Ctl or Anx2 siRNA were synchronized at G2–M transition, released to reach anaphase and early telophase and then analyzed by immunofluorescence for contractile ring elements. Cells were analyzed for F-actin with phalloidin (B) and antibody against myosin II (C). Percentage of cells displaying normal equatorial actin staining following transfection with Ctl or Anx2 siRNA (B, graph). Error bars, SD of three experiments (n ≥ 100). *P = 0.001, Student's t-test. Cells were analyzed for anillin (D). Percentages indicate the fraction of cells displaying the phenotype represented in the image among the cells scored in anaphase (n = 80). Quantification of the percentage of cells presenting normal equatorial anillin staining (D, graph). Error bars, SD of three experiments (n ≥ 60 each). *P = 0.001, Student's t-test. Scale bars, 10 μm.
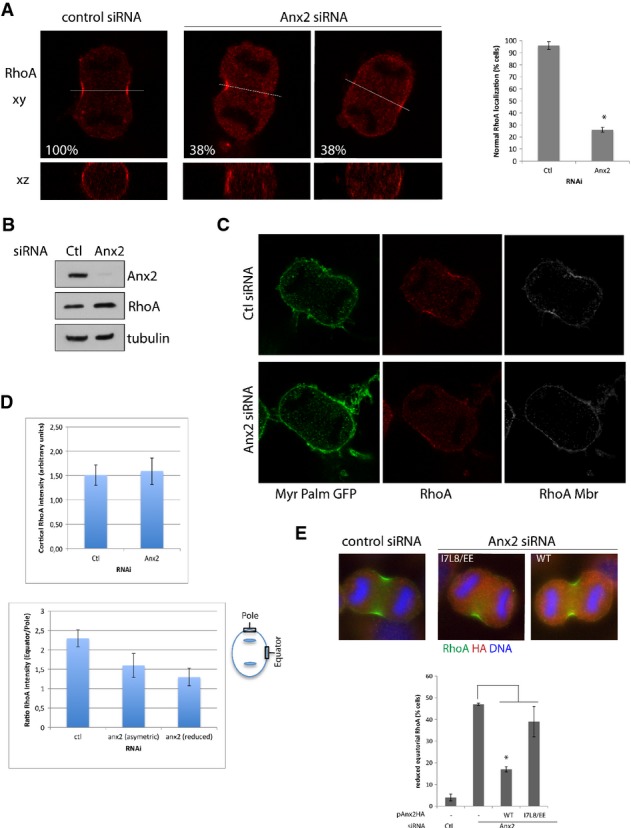
Confocal images of HeLa cells transfected with control or Anx2 RNAi and stained in anaphase with anti-RhoA antibody. x–y sections (top image) and x–z sections corresponding to the white line (bottom) are shown. Indicated percentages correspond to the ratio of cells in anaphase displaying the represented phenotype (n ≥ 50). Percentage of cells transfected with Ctl or Anx2 siRNA displaying normal equatorial cortex RhoA staining (graph). Error bars, SD of three experiments (n = 70). *P = 0.001, Student's t-test.
Immunoblotting of HeLa cells treated with control or Anx2 siRNA analyzed with anti-annexin A2, anti-tubulin and anti-RhoA antibodies.
HeLa cells stably expressing MyrPalm-GFP were transfected with Ctl RNAi or Anx2 RNAi and immunostained with anti-RhoA. Cortical RhoA staining (RhoA Mbr) corresponds to the RhoA staining defined by the MyrPalm-GFP mask.
Quantification of total cortical RhoA intensity in cells treated with control and Anx2 RNAi (top panel). Quantification of the accumulation of RhoA at the equatorial cortex expressed as the ratio of equatorial intensity over polar intensity (bottom panel). Error bars, SD of three experiments (n ≥ 20). Measured equatorial and polar regions are defined by the boxes on the diagram (bottom panel).
Immunofluorescence and quantification of RhoA localization in HeLa cells co-transfected with Ctl or Anx2 siRNA and pAnx2HA-WT or I7L8/EE mutant. Error bars, SD of three experiments (n ≥ 90). *P = 0.0001, Student's t-test.
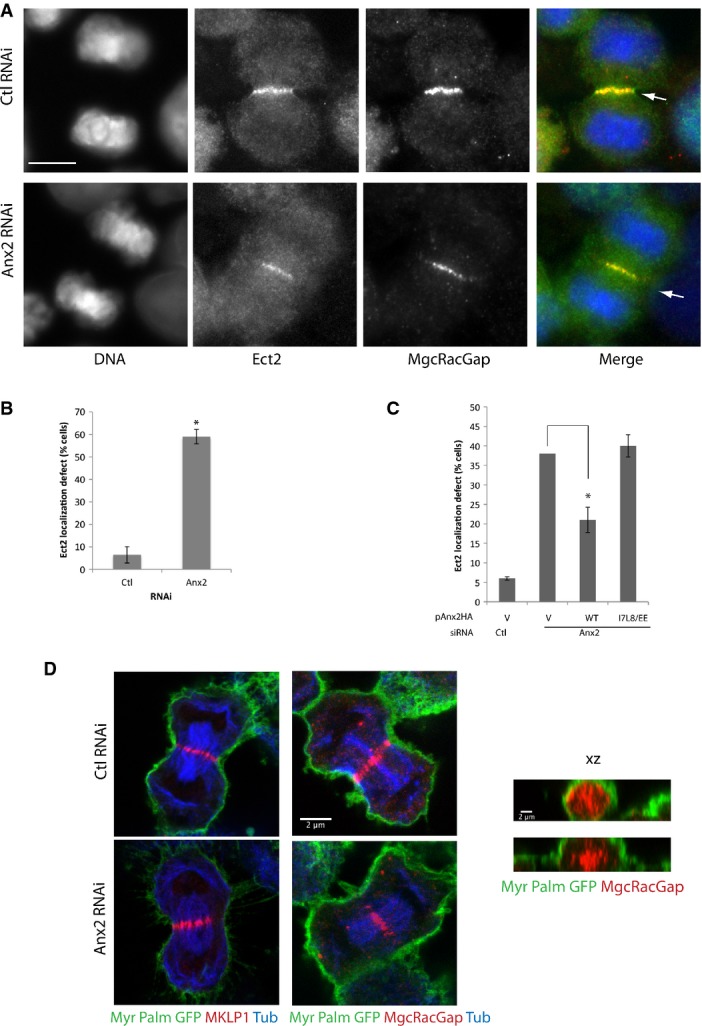
Immunofluorescence images of HeLa cells transfected with control or annexin A2 RNAi, fixed in anaphase and co-labeled for DNA, Ect2 and MgcRacGAP. Arrows indicate the equatorial plasma membrane. Scale bar, 10 μm.
Quantification of the percentage of cells displaying cortical Ect2 localization in anaphase. Error bars, SD of four experiments (n ≥ 60 each). *P = 0.0002, Student's t-test.
Quantification of the percentage of cells with defective Ect2 localization in HeLa cells co-transfected with Ctl or Anx2 siRNA and pAnx2HA-WT or I7L8/EE mutant. Error bars, SD of three experiments (n = 90). *P = 0.005, Student's t-test.
Confocal images of MyrPalm-GFP-expressing HeLa cells transfected with control or annexin A2 RNAi. Cells were co-immunostained either for GFP/MKLP1/tubulin or for GFP/MgcRacGAP/tubulin. x–y sections (left panel) or x–z sections through the equatorial plane (right panel).
References
-
- Fededa JP, Gerlich DW. Molecular control of animal cell cytokinesis. Nat Cell Biol. 2012;14:440–447. - PubMed
-
- Matsumura F. Regulation of myosin II during cytokinesis in higher eukaryotes. Trends Cell Biol. 2005;15:371–377. - PubMed
-
- Nishimura Y, Yonemura S. Centralspindlin regulates ECT2 and RhoA accumulation at the equatorial cortex during cytokinesis. J Cell Sci. 2006;119:104–114. - PubMed
Publication types
MeSH terms
Substances
LinkOut - more resources
Full Text Sources
Other Literature Sources
Miscellaneous
