. 2015 Sep;17(9):1220-30.
doi: 10.1093/neuonc/nou369. Epub 2015 Feb 23.

Ras-mediated modulation of pyruvate dehydrogenase activity regulates mitochondrial reserve capacity and contributes to glioblastoma tumorigenesis

Affiliations

Ras-mediated modulation of pyruvate dehydrogenase activity regulates mitochondrial reserve capacity and contributes to glioblastoma tumorigenesis

Antony Prabhu et al. Neuro Oncol. 2015 Sep.

Erratum in

Abstract

Background: Even though altered metabolism representing a hallmark of cancer was proposed nearly a century ago, recent technological advances have allowed investigators to continue uncovering a previously unrecognized complexity of metabolic programs that drive tumorigenesis beyond that of aerobic glycolysis.

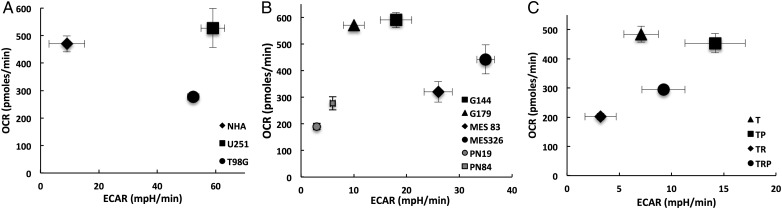
Methods: The bioenergetic state of a diverse panel of glioblastoma models, including isogenic lines derived from a genetically engineered adult astrocytic mouse model and patient-derived glioblastoma stem cells, was determined at baseline and in stressed conditions. Mechanisms contributing to the discovered metabolic phenotypes were determined through molecular and chemical perturbation, and their biological consequences were evaluated in vivo and in patient samples.

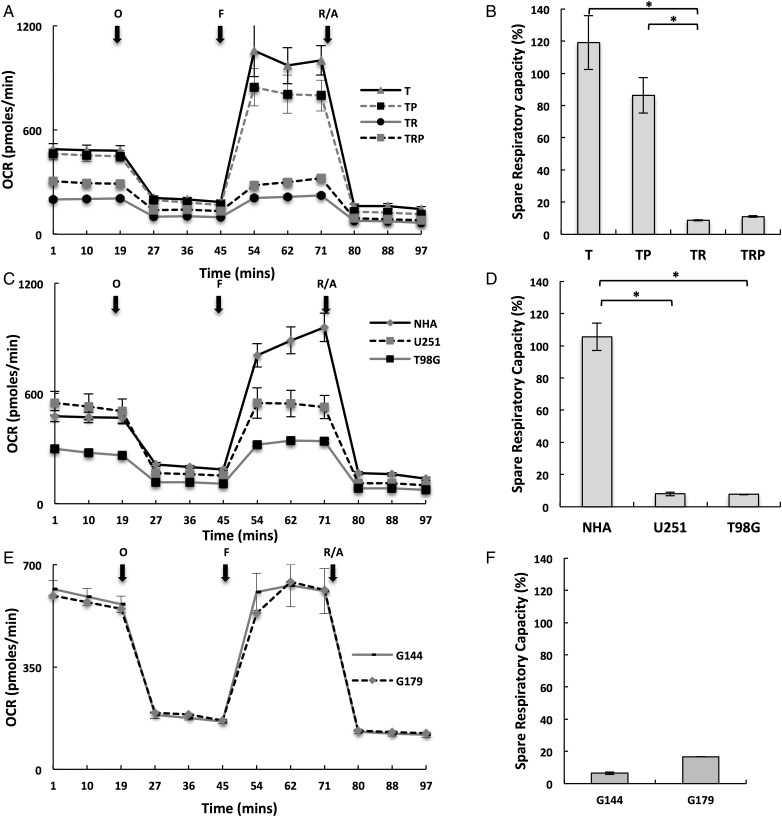
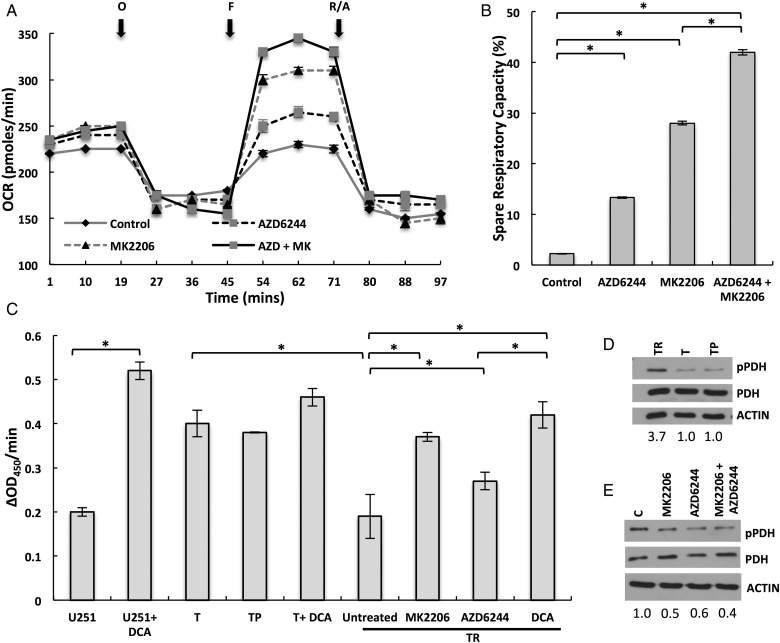
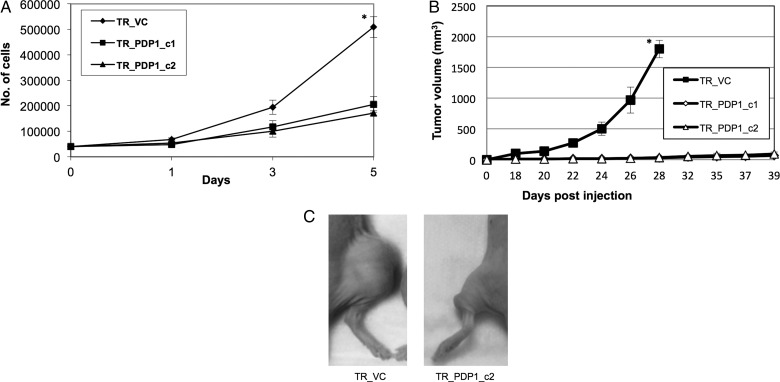
Results: Attenuated mitochondrial reserve capacity was identified as a common metabolic phenotype in glioblastoma lines. This phenotype was linked mechanistically with the capacity of Ras-mediated signaling to inhibit pyruvate dehydrogenase (PDH) activity through downregulation of PDH phosphatase (PDP) expression. PDP1 repression was validated clinically in patient-derived samples, suggesting that aberrant cellular signaling typical of glioblastoma actively modulates PDH activity. This phenotype was reversed through both chemical and molecular perturbation. Restoration of PDH activity through stable expression of PDP1-impaired tumorigenic potential.

Conclusions: These findings support the central role that PDH regulation plays as a downstream consequence of aberrant signaling associated with gliomagenesis and the scientific rationale to continue to develop and test clinical strategies designed to activate PDH as a form of anticancer therapy in glioblastoma.

Keywords: Ras; glioblastoma; pyruvate dehydrogenase; spare respiratory capacity; tumor metabolism.


Figures

Fig. 1.
Fig. 1.
Baseline metabolic profiles of glioblastoma cells. The oxygen consumption rate (OCR) and extracellular acidification rate (ECAR) were plotted against one another to define the bioenergetic state of the described cell lines.
Fig. 2.
Fig. 2.
Glioblastoma cells demonstrate an attenuated spare respiratory capacity. (A, C and E) The respiratory phenotype was defined in the described cell lines using established methods to study mitochondrial function that involved sequentially exposing cells to oligomycin (O), carbonyl cyanide-4-(trifluoromethoxy)phenylhydrazone (FCCP) (F), and rotenone/antimycin (R/A) in real-time on the Seahorse platform. (B, D and F) The relatively spare respiratory capacity (%) was calculated as (oxygen consumption rate [OCR] following FCCP – baseline OCR)/baseline OCR. * P < .01.
Fig. 3.
Fig. 3.
Ras-mediated signaling modulates oxygen consumption rate (OCR) and spare respiratory capacity through inhibition of pyruvate dehydrogenase (PDH) activity. (A and B) The respiratory phenotype was defined in TR cells exposed to either vehicle control or the described agents 24 hours prior to analysis. To study mitochondrial function, cells were sequentially exposed to oligomycin (O), carbonyl cyanide-4-(trifluoromethoxy)phenylhydrazone (FCCP) (F), and rotenone/antimycin (R/A) in real time. The relative spare respiratory capacity (%) was calculated as (OCR following FCCP – baseline OCR)/baseline OCR. (C) PDH enzyme activity in the described cell lines and treatment conditions using a microplate assay kit. (D) Western blot was performed to determine levels of phosphorylated PDH (pPDH) in the described cell lines. Levels were quantified by determining the pPDH/PDH ratio for each line and then normalized to the ratio of T cells. (E) Western blot was performed to determine levels of pPDH in TR cells exposed to vehicle control or the stated agents. Levels were quantified by determining the pPDH/PDH ratio for each treatment condition and then normalizing to the ratio of vehicle control cells. *P < .05.
Fig. 4.
Fig. 4.
Attenuated pyruvate dehydrogenase (PDH) activity and mitochondrial reserve capacity in glioblastoma are mediated through downregulation of pyruvate dehydrogenase phosphatase (PDP) expression. (A) The PDH regulatory proteins PDP1-2 and PDK1-4 were evaluated by reverse transcriptase PCR in the described cell lines and treatment conditions. Levels were quantified relative to actin and then normalized to the T cell line. (B) Western blot was performed to determine levels of PDP1 expression in TR cells treated in the described conditions. (C) Western blot was performed to determine levels of the stated proteins in T, TR, and the TR line overexpressing PDP1 (TR + PDP1). (D) The respiratory phenotype of the described cell lines was determined using the Seahorse platform. (E) PDP1 expression in normal brain and GBM was evaluated on the The Cancer Genome Atlas platform. *P < .01.
Fig. 5.
Fig. 5.
Modulation of pyruvate dehydrogenase (PDH) activity through PDP1 expression influences glioblastoma growth. (A) TR vector control cells (TR_VC) and clones overexpressing PDP1 (TR_PDP1_c1/2) were evaluated growth kinetics were evaluated in vitro. (B) Tumor growth curves were obtained in the described cell lines at stated times in an s.c. mouse xenograft model (n = 10/cell line) using perpendicular diameter measurements of each tumor with digital calipers; volumes were calculated using the formula (LxWxW)/2. (C) A representative image of described cell lines grown in an s.c. mouse xenograft model. *P < .01.

References

    1. Warburg O. On respiratory impairment in cancer cells. Science. 1956;124(3215):269–270. - PubMed
    1. Warburg O, Posener K, Negelein E. Uber den Stoffwechsel der Carcinomzelle. Biochem Zeitschr. 1924;152:309–344.
    1. Marin-Valencia I, Yang C, Mashimo T, et al. Analysis of tumor metabolism reveals mitochondrial glucose oxidation in genetically diverse human glioblastomas in the mouse brain in vivo. Cell Metab. 2012;15(6):827–837. - PMC - PubMed
    1. Moreno-Sanchez R, Rodriguez-Enriquez S, Marin-Hernandez A, Saavedra E. Energy metabolism in tumor cells. FEBS J. 2007;274(6):1393–1418. - PubMed
    1. Chinnaiyan P, Kensicki E, Bloom G, et al. The metabolomic signature of malignant glioma reflects accelerated anabolic metabolism. Cancer Res. 2012;72(22):5878–5888. - PMC - PubMed

Publication types

Substances