

15-Lipoxygenase-1 suppression of colitis-associated colon cancer through inhibition of the IL-6/STAT3 signaling pathway
- PMID: 25713055
- PMCID: PMC4447220
- DOI: 10.1096/fj.14-264515
15-Lipoxygenase-1 suppression of colitis-associated colon cancer through inhibition of the IL-6/STAT3 signaling pathway
Abstract
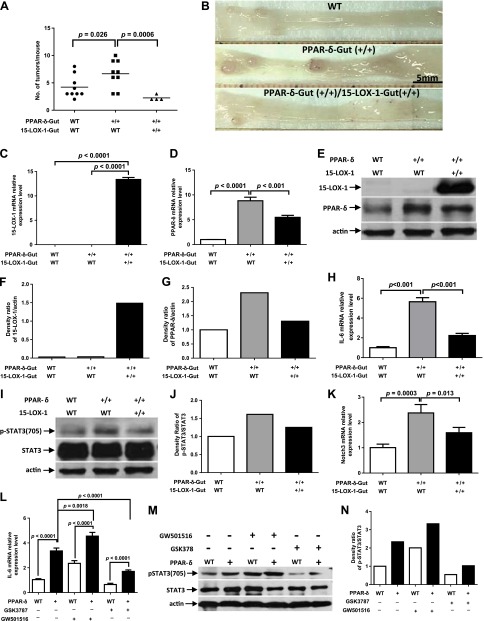
The IL-6/signal transducer and activator of transcription 3 (STAT3) pathway is a critical signaling pathway for colitis-associated colorectal cancer (CAC). Peroxisome proliferator-activated receptor (PPAR)-δ, a lipid nuclear receptor, up-regulates IL-6. 15-Lipoxygenase-1 (15-LOX-1), which is crucial to production of lipid signaling mediators to terminate inflammation, down-regulates PPAR-δ. 15-LOX-1 effects on IL-6/STAT3 signaling and CAC tumorigenesis have not been determined. We report that intestinally targeted transgenic 15-LOX-1 expression in mice inhibited azoxymethane- and dextran sodium sulfate-induced CAC, IL-6 expression, STAT3 phosphorylation, and IL-6/STAT3 downstream target (Notch3 and MUC1) expression. 15-LOX-1 down-regulation was associated with IL-6 up-regulation in human colon cancer mucosa. Reexpression of 15-LOX-1 in human colon cancer cells suppressed IL-6 mRNA expression, STAT3 phosphorylation, IL-6 promoter activity, and PPAR-δ mRNA and protein expression. PPAR-δ overexpression in colonic epithelial cells promoted CAC tumorigenesis in mice and increased IL-6 expression and STAT3 phosphorylation, whereas concomitant 15-LOX-1 expression in colonic epithelial cells (15-LOX-1-PPAR-δ-Gut mice) suppressed these effects: the number of tumors per mouse (mean ± sem) was 4.22 ± 0.68 in wild-type littermates, 6.67 ± 0.83 in PPAR-δ-Gut mice (P = 0.026), and 2.25 ± 0.25 in 15-LOX-1-PPAR-δ-Gut mice (P = 0.0006). Identification of 15-LOX-1 suppression of PPAR-δ to inhibit IL-6/STAT3 signaling-driven CAC tumorigenesis provides mechanistic insights that can be used to molecularly target CAC.
Keywords: 15-LOX-1; CAC; IL-6 expression; PPAR-δ; STAT3 phosphorylation.
© FASEB.
Figures


Similar articles
-
ALOX15 as a suppressor of inflammation and cancer: Lost in the link.Prostaglandins Other Lipid Mediat. 2017 Sep;132:77-83. doi: 10.1016/j.prostaglandins.2017.01.002. Epub 2017 Jan 13. Prostaglandins Other Lipid Mediat. 2017. PMID: 28089732 Free PMC article. Review.
-
Chemopreventive Effects of Silibinin on Colitis-Associated Tumorigenesis by Inhibiting IL-6/STAT3 Signaling Pathway.Mediators Inflamm. 2018 Oct 25;2018:1562010. doi: 10.1155/2018/1562010. eCollection 2018. Mediators Inflamm. 2018. PMID: 30498394 Free PMC article.
-
Oroxylin A inhibits colitis-associated carcinogenesis through modulating the IL-6/STAT3 signaling pathway.Inflamm Bowel Dis. 2013 Aug;19(9):1990-2000. doi: 10.1097/MIB.0b013e318293c5e0. Inflamm Bowel Dis. 2013. PMID: 23823704
-
Nicotine suppresses acute colitis and colonic tumorigenesis associated with chronic colitis in mice.Am J Physiol Gastrointest Liver Physiol. 2014 Nov 15;307(10):G968-78. doi: 10.1152/ajpgi.00346.2013. Epub 2014 Sep 25. Am J Physiol Gastrointest Liver Physiol. 2014. PMID: 25258409
-
15-lipoxygenase-1 in colorectal cancer: a review.Tumour Biol. 2009;30(4):185-99. doi: 10.1159/000236864. Epub 2009 Sep 10. Tumour Biol. 2009. PMID: 19752603 Review.
Cited by
-
ALOX15 as a suppressor of inflammation and cancer: Lost in the link.Prostaglandins Other Lipid Mediat. 2017 Sep;132:77-83. doi: 10.1016/j.prostaglandins.2017.01.002. Epub 2017 Jan 13. Prostaglandins Other Lipid Mediat. 2017. PMID: 28089732 Free PMC article. Review.
-
Molecular Targets in Precision Chemoprevention of Colorectal Cancer: An Update from Pre-Clinical to Clinical Trials.Int J Mol Sci. 2020 Dec 17;21(24):9609. doi: 10.3390/ijms21249609. Int J Mol Sci. 2020. PMID: 33348563 Free PMC article. Review.
-
Regulatory role of PPAR in colorectal cancer.Cell Death Discov. 2025 Jan 28;11(1):28. doi: 10.1038/s41420-025-02313-2. Cell Death Discov. 2025. PMID: 39875357 Free PMC article. Review.
-
The Role of Notch3 in Cancer.Oncologist. 2018 Aug;23(8):900-911. doi: 10.1634/theoncologist.2017-0677. Epub 2018 Apr 5. Oncologist. 2018. PMID: 29622701 Free PMC article. Review.
-
Influence of Lipoxygenase Inhibition on Glioblastoma Cell Biology.Int J Mol Sci. 2020 Nov 9;21(21):8395. doi: 10.3390/ijms21218395. Int J Mol Sci. 2020. PMID: 33182324 Free PMC article.
References
-
- Ekbom A., Helmick C., Zack M., Adami H. O. (1990) Ulcerative colitis and colorectal cancer. A population-based study. N. Engl. J. Med. 323, 1228–1233 - PubMed
-
- Itzkowitz S. H., Yio X. (2004) Inflammation and cancer IV. Colorectal cancer in inflammatory bowel disease: the role of inflammation. Am. J. Physiol. Gastrointest. Liver Physiol. 287, G7–G17 - PubMed
-
- Breynaert C., Vermeire S., Rutgeerts P., Van Assche G. (2008) Dysplasia and colorectal cancer in inflammatory bowel disease: a result of inflammation or an intrinsic risk? Acta Gastroenterol. Belg. 71, 367–372 - PubMed
-
- van Schaik F. D. M., Offerhaus G. J. A., Schipper M. E. I., Siersema P. D., Vleggaar F. P., Oldenburg B. (2009) Endoscopic and pathological aspects of colitis-associated dysplasia. Nat Rev Gastroenterol Hepatol 6, 671–678 - PubMed
Publication types
MeSH terms
Substances
Grants and funding
LinkOut - more resources
Full Text Sources
Other Literature Sources
Molecular Biology Databases
Research Materials
Miscellaneous
