. 2015 Apr 17;290(16):9959-73.
doi: 10.1074/jbc.M114.616888. Epub 2015 Feb 24.

Alcohol inhibits osteopontin-dependent transforming growth factor-β1 expression in human mesenchymal stem cells

Affiliations

Alcohol inhibits osteopontin-dependent transforming growth factor-β1 expression in human mesenchymal stem cells

Joseph Driver et al. J Biol Chem. .

Abstract

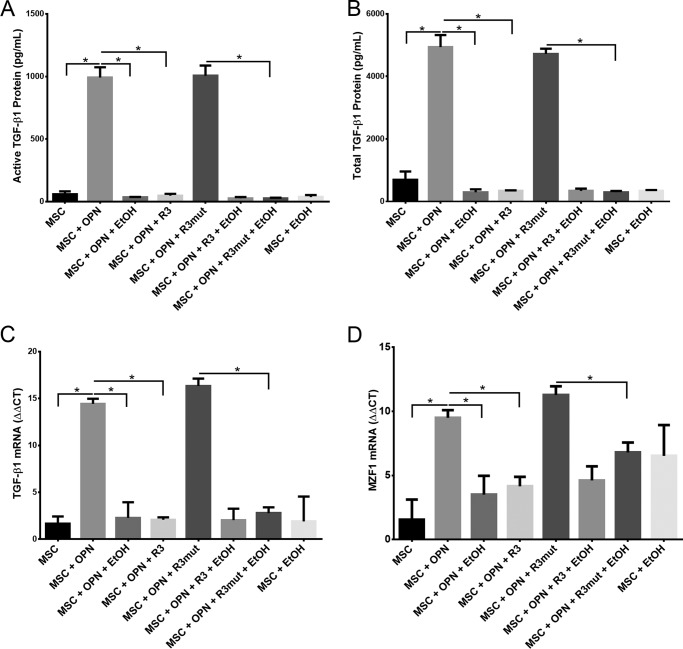
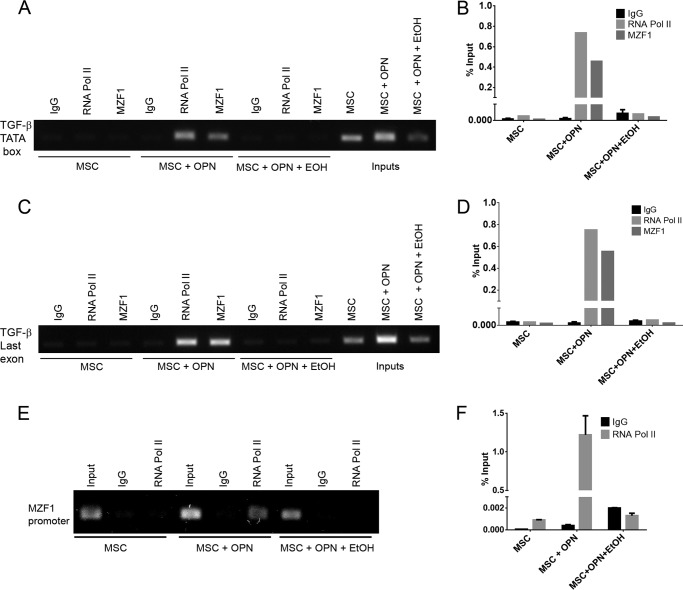
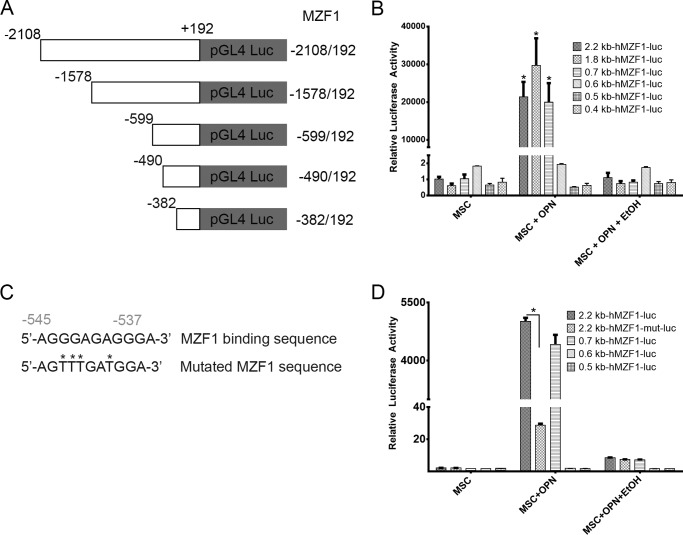
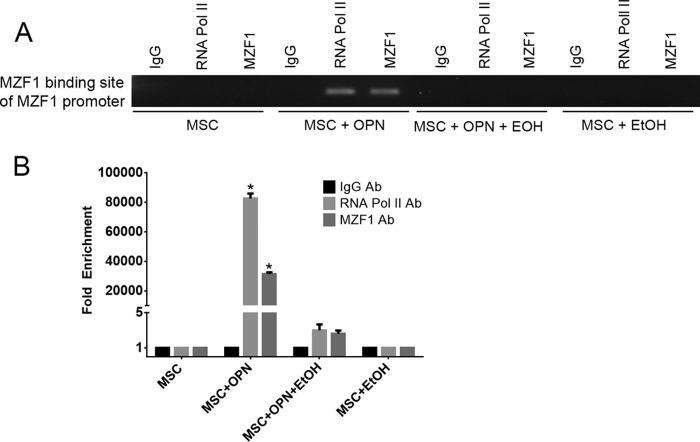
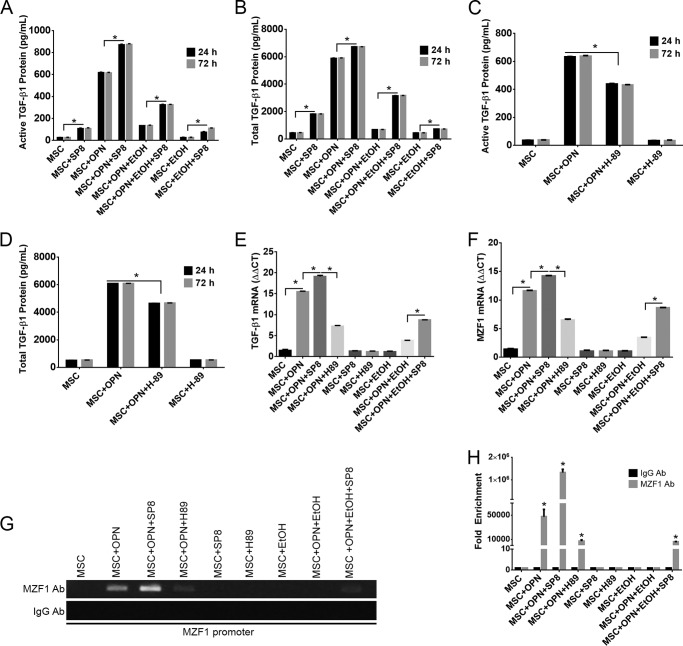
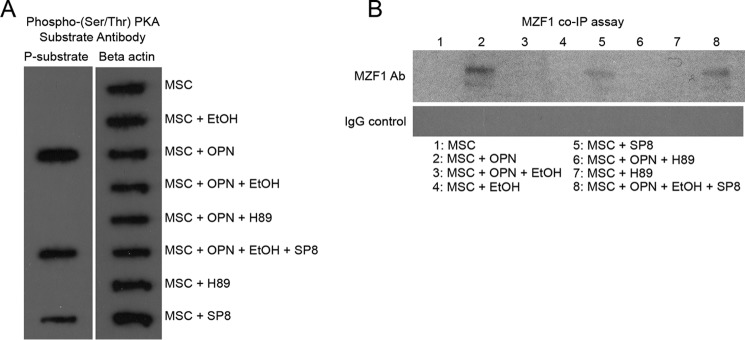
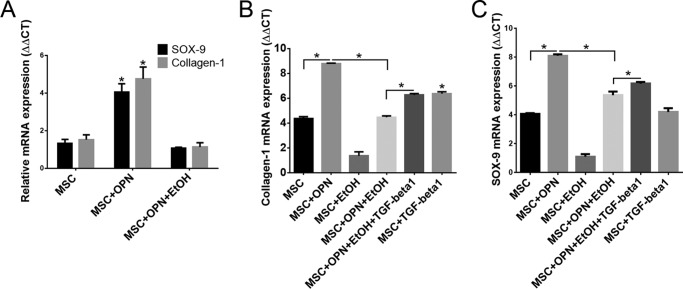
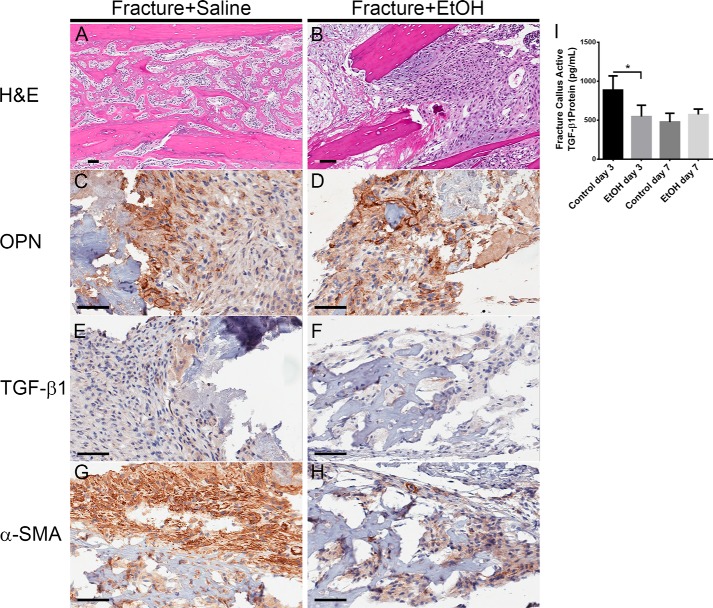
Alcohol (EtOH) intoxication is a risk factor for increased morbidity and mortality with traumatic injuries, in part through inhibition of bone fracture healing. Animal models have shown that EtOH decreases fracture callus volume, diameter, and biomechanical strength. Transforming growth factor β1 (TGF-β1) and osteopontin (OPN) play important roles in bone remodeling and fracture healing. Mesenchymal stem cells (MSC) reside in bone and are recruited to fracture sites for the healing process. Resident MSC are critical for fracture healing and function as a source of TGF-β1 induced by local OPN, which acts through the transcription factor myeloid zinc finger 1 (MZF1). The molecular mechanisms responsible for the effect of EtOH on fracture healing are still incompletely understood, and this study investigated the role of EtOH in affecting OPN-dependent TGF-β1 expression in MSC. We have demonstrated that EtOH inhibits OPN-induced TGF-β1 protein expression, decreases MZF1-dependent TGF-β1 transcription and MZF1 transcription, and blocks OPN-induced MZF1 phosphorylation. We also found that PKA signaling enhances OPN-induced TGF-β1 expression. Last, we showed that EtOH exposure reduces the TGF-β1 protein levels in mouse fracture callus. We conclude that EtOH acts in a novel mechanism by interfering directly with the OPN-MZF1-TGF-β1 signaling pathway in MSC.

Keywords: Alcohol (EtOH); Gene Expression; Gene Transcription; Mesenchymal Stem Cells (MSCs); Osteopontin; Promoter; Protein Kinase A (PKA); Transforming Growth Factor β (TGF-β); Zinc Finger.


Figures

FIGURE 1.
FIGURE 1.
EtOH inhibits OPN-mediated TGF-β1 protein and mRNA expression and OPN-mediated MZF1 mRNA expression. A, active TGF-β1 protein in MSC medium. MSC were exposed to OPN (180 ng/ml), EtOH (25 mm), APT (100 nm), and MuAPT (100 nm) for 24 h and secreted protein was measured with ELISA (*, p < 0.0001). B, total TGF-β1 protein in MSC medium. MSC were exposed to identical aforementioned treatments and secreted protein was measured with ELISA (*, p < 0.0001). C, expression of TGF-β1 mRNA. MSCs were exposed to OPN (180 ng/ml), EtOH (25 mm), APT (100 nm), and MuAPT (100 nm) for 24 h and TGF-β1 mRNA levels were measured using qRT-PCR (*, p < 0.0001). D, expression of MZF1 mRNA. MSCs were exposed to OPN, EtOH, APT, and MuAPT for 24 h and MZF1 mRNA levels were measured using qRT-PCR (*, p < 0.0001). Data are presented as mean ± S.E. of three experiments.
FIGURE 2.
FIGURE 2.
EtOH blocks RNA polymerase II and MZF1-mediated TGF-β1 promoter activation and RNA polymerase II-mediated MZF1 promoter activation. A, binding of RNA pol II and MZF1 to the TGF-β1 promoter. ChIP Real Time-PCR was performed using primers that included the TGF-β1 promoter TATA box to determine the role of OPN and EtOH in transcriptional regulation of TGF-β1 expression. B, graphical representation of RNA pol II and MZF1 binding to the TGF-β1 promoter. The percent input was calculated from ChIP Real Time-PCR CT values using input samples as internal controls for the amount of chromatin. C, binding of RNA pol II and MZF1 to the TGF-β1 third exon. ChIP Real Time-PCR was performed using primers that included the TGF-β1 third and final exon to determine the role of OPN and EtOH in transcriptional regulation of TGF-β1 expression. D, graphical representation of RNA pol II and MZF1 binding to the TGF-β1 third exon. The percent input was calculated from ChIP Real Time-PCR CT values using input samples as internal controls for the chromatin amount. E, binding of RNA pol II to the MZF1 promoter. ChIP Real Time-PCR was performed using primers that included the MZF1 TATA box. F, graphical representation of RNA pol II binding to the MZF1 promoter. The percent input was calculated from ChIP Real Time-PCR CT values using input samples as internal controls for the amount of chromatin. Data are presented as mean ± S.E. of three experiments. Gels are representative of three experiments.
FIGURE 3.
FIGURE 3.
EtOH inhibits OPN-mediated MZF1-luciferase construct activation. A, schematic depiction of MZF1 promoter-luciferase reporter constructs. B, luciferase activity of MZF1 promoter constructs in MSC (*, p < 0.0001). C, schematic representation of the wild type and mutated MZF1 binding site within the MZF1 promoter sequence. D, luciferase activity of the wild type and mutant MZF1 promoter constructs in MSC (*, p < 0.0001). Data are presented as mean ± S.E. of at least three experiments.
FIGURE 4.
FIGURE 4.
EtOH blocks MZF1 binding to the MZF1 promoter. A, binding of MZF1 to the MZF1 promoter. ChIP Real Time-PCR was done using primers that amplified the promoter region at −545 to −537 base pairs upstream of the MZF1 start codon that contains an MZF1 binding sequence. B, graphical representation of RNA pol II and MZF1 binding to the MZF1 promoter. Fold-enrichment was calculated using nonspecific IgG binding as an internal control (*, p < 0.0001). Data are presented as mean ± S.E. of three experiments. The gel is representative of three experiments.
FIGURE 5.
FIGURE 5.
Manipulation of the PKA signaling pathway alters OPN-mediated TGF-β1 protein and mRNA expression, and MZF1 mRNA expression and promoter activation. A–D, active and total secreted TGF-β1 protein following varying treatments of MSC with OPN, EtOH, the PKA activator, SP8, and the PKA inhibitor, H-89. SP8 partially rescues EtOH inhibition of OPN-mediated TGF-β1 expression. H-89 reduced the level of TGF-β1 protein expression following treatment with OPN. E, expression of TGF-β1 mRNA following varying treatments of OPN, EtOH, SP8, and H-89. F, MZF1 mRNA expression following varying treatments of OPN, EtOH, SP8, and H-89 (*, p < 0.0001). G, binding of MZF1 to the MZF1 promoter in the presence of OPN, EtOH, and PKA modulators SP8 and H-89. ChIP Real Time-PCR was performed using primers that amplified the MZF1 binding site within the MZF1 promoter. H, graphical representation of MZF1 binding the MZF1 promoter. Fold-enrichment values were calculated using IgG pulldown CT values as internal control (*, p < 0.0001). Data are presented as mean ± S.E. of three experiments. The gel is representative of three experiments.
FIGURE 6.
FIGURE 6.
OPN and EtOH influence phosphorylation of PKA downstream targets and MZF1. A, dot blot showing the effect of OPN, EtOH, SP8, and H-89 on the phosphorylation state of downstream PKA substrate proteins. PKA substrate-specific anti-phosphoserine/threonine Ab was utilized to show that OPN stimulates PKA substrate phosphorylation, an effect reversed by EtOH. B, Western blot of phosphorylated MZF1 protein following co-immunoprecipitation with anti-MZF1 Ab and anti-phosphoserine/threonine Ab. OPN and PKA activator SP8 stimulated phosphorylation of MZF1 protein, and the effect of OPN was blocked by both EtOH exposure as well as PKA inhibition with H-89 the gel is representative of three experiments.
FIGURE 7.
FIGURE 7.
Global transcription in MSC is not affected by EtOH exposure. A, ChIP showing binding of RNA pol II to the GATA4 promoter in MSC following treatment with OPN and EtOH. EtOH did not alter RNA pol II binding to GATA4 promoter and subsequent transcriptional activation. B, graphical representation of MZF1 binding to the MZF1 promoter. Fold-enrichment was calculated using nonspecific IgG binding as an internal control. C, expression of GATA4 mRNA in OPN- and EtOH-treated MSC. GATA4 mRNA levels were unaffected by exposure to EtOH. Data are presented as mean ± S.E. of three experiments. Teh gel is representative of three experiments.
FIGURE 8.
FIGURE 8.
EtOH does not interfere with OPN-receptor interactions or OPN receptor cell surface density. A, integrin CD44 and αvβ3 receptor density on MSC in the absence or presence of EtOH. A fluorescently tagged antibody binding to OPN receptors CD44 and αvβ3 was unaffected by OPN and EtOH exposure, indicating a constant receptor population among treatment groups. B, fluorescent signal of FITC-labeled OPN in the absence and presence of EtOH in MSC. OPN receptor interactions in the presence of EtOH were analyzed using OPN conjugated to FITC. EtOH did not alter OPN-receptor interactions. Data are presented as mean ± S.E. of three experiments.
FIGURE 9.
FIGURE 9.
OPN, EtOH, and TGF-β1 regulate SOX-9 and collagen-1 mRNA expression. A, expression of SOX-9 and collagen-1 mRNA. MSC were exposed to OPN and EtOH for 24 h, and SOX-9 and collagen-1 mRNA levels were measured using qRT-PCR (*, p < 0.0001). B, effect of TGF-β1 on collagen-1 mRNA expression in MSC grown in osteogenic inducing cell culture medium. Application of exogenous TGF-β1 to MSC partially reversed EtOH inhibition of OPN-induced collagen-1 expression (*, p < 0.0001). C, effect of TGF-β1 on SOX-9 mRNA expression in MSC grown in chondrogenic inducing cell culture medium. Exogenous TGF-β1 treatment also partially reversed EtOH inhibition of OPN-induced SOX-9 mRNA expression (*, p < 0.0001). Data are presented as mean ± S.E. of three experiments.
FIGURE 10.
FIGURE 10.
EtOH exposure affects mouse fracture callus protein composition. A–H, histological analysis of binge EtOH treatment on mouse fracture callus composition. Fracture callus sections were stained with hematoxylin and esosin, and antibodies against OPN, TGF-β1, and α-SMA. The black bar indicates the length of 60 μm. I, active TGF-β1 protein in mouse fracture callus. The concentration of active TGF-β1 protein in the tibial fracture callus from saline- and EtOH-treated mice 3 and 7 days post-fracture was measured using ELISA (*, p < 0.01).

Similar articles

Cited by

References

    1. Rivara F. P., Jurkovich G. J., Gurney J. G., Seguin D., Fligner C. L., Ries R., Raisys V. A., Copass M. (1993) The magnitude of acute and chronic alcohol abuse in trauma patients. Arch. Surg. 128, 907–912; discussion 912–903 - PubMed
    1. Demetriades D., Gkiokas G., Velmahos G. C., Brown C., Murray J., Noguchi T. (2004) Alcohol and illicit drugs in traumatic deaths: prevalence and association with type and severity of injuries. J. Am. Coll. Surg. 199, 687–692 - PubMed
    1. Nyquist F., Berglund M., Nilsson B. E., Obrant K. J. (1997) Nature and healing of tibial shaft fractures in alcohol abusers. Alcohol Alcohol. 32, 91–95 - PubMed
    1. Lauing K. L., Roper P. M., Nauer R. K., Callaci J. J. (2012) Acute alcohol exposure impairs fracture healing and deregulates β-catenin signaling in the fracture callus. Alcohol. Clin. Exp. Res. 36, 2095–2103 - PMC - PubMed
    1. Volkmer D. L., Sears B., Lauing K. L., Nauer R. K., Roper P. M., Yong S., Stover M., Callaci J. J. (2011) Antioxidant therapy attenuates deficient bone fracture repair associated with binge alcohol exposure. J. Orthop. Trauma 25, 516–521 - PMC - PubMed

MeSH terms