

Sarcolipin Is a Key Determinant of the Basal Metabolic Rate, and Its Overexpression Enhances Energy Expenditure and Resistance against Diet-induced Obesity
- PMID: 25713078
- PMCID: PMC4409248
- DOI: 10.1074/jbc.M115.636878
Sarcolipin Is a Key Determinant of the Basal Metabolic Rate, and Its Overexpression Enhances Energy Expenditure and Resistance against Diet-induced Obesity
Abstract
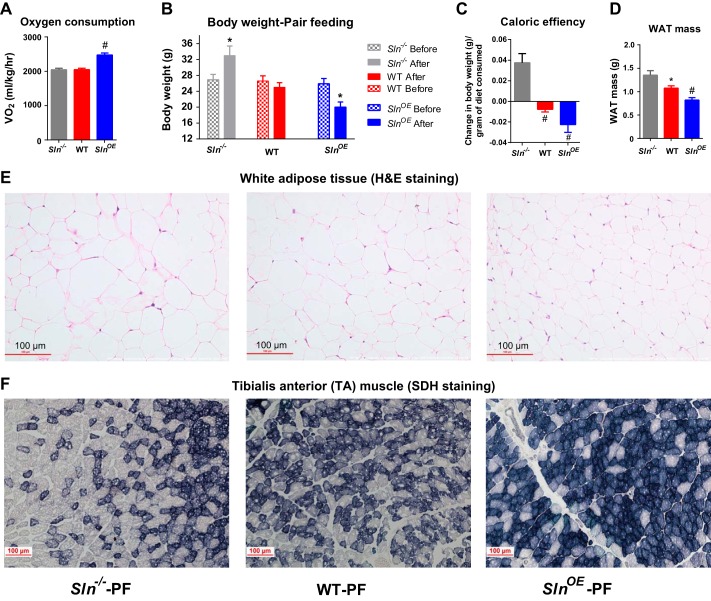
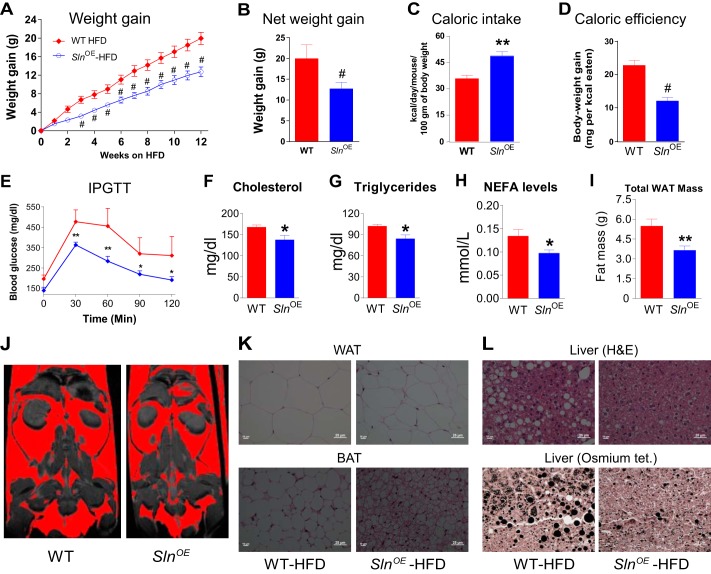
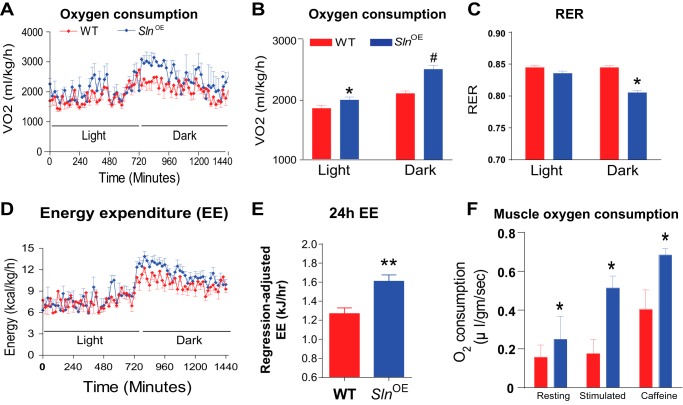
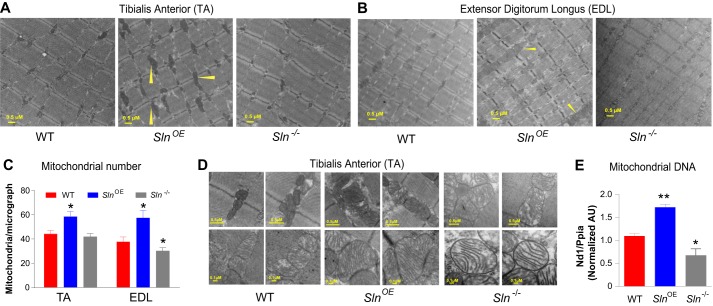
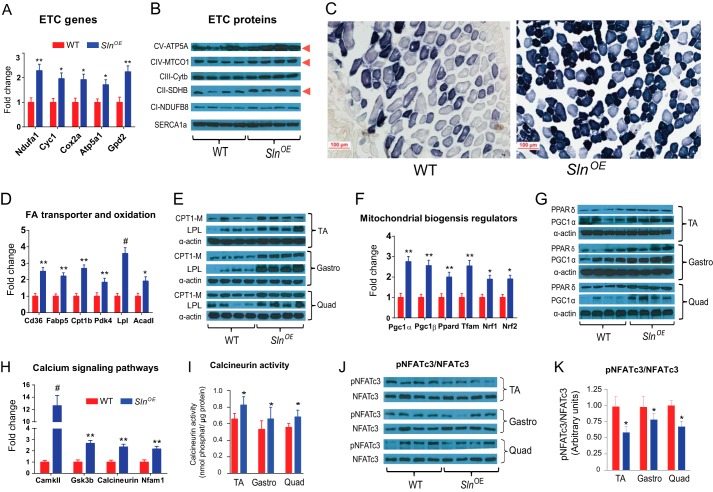
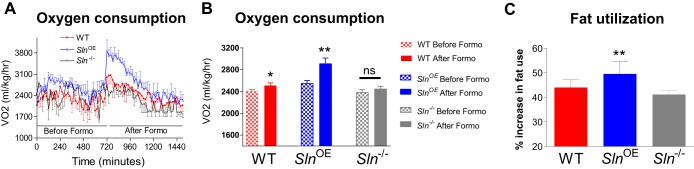
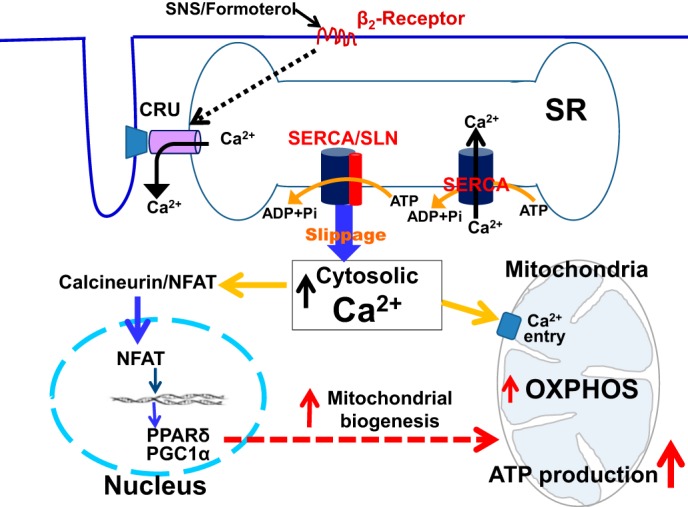
Sarcolipin (SLN) is a novel regulator of sarcoplasmic reticulum Ca(2+) ATPase (SERCA) in muscle. SLN binding to SERCA uncouples Ca(2+) transport from ATP hydrolysis. By this mechanism, SLN promotes the futile cycling of SERCA, contributing to muscle heat production. We recently showed that SLN plays an important role in cold- and diet-induced thermogenesis. However, the detailed mechanism of how SLN regulates muscle metabolism remains unclear. In this study, we used both SLN knockout (Sln(-/-)) and skeletal muscle-specific SLN overexpression (Sln(OE)) mice to explore energy metabolism by pair feeding (fixed calories) and high-fat diet feeding (ad libitum). Our results show that, upon pair feeding, Sln(OE) mice lost weight compared with the WT, but Sln(-/-) mice gained weight. Interestingly, when fed with a high-fat diet, Sln(OE) mice consumed more calories but gained less weight and maintained a normal metabolic profile in comparison with WT and Sln(-/-) mice. We found that oxygen consumption and fatty acid oxidation were increased markedly in Sln(OE) mice. There was also an increase in both mitochondrial number and size in Sln(OE) muscle, together with increased expression of peroxisome proliferator-activated receptor δ (PPARδ) and PPAR γ coactivator 1 α (PGC1α), key transcriptional activators of mitochondrial biogenesis and enzymes involved in oxidative metabolism. These results, taken together, establish an important role for SLN in muscle metabolism and energy expenditure. On the basis of these data we propose that SLN is a novel target for enhancing whole-body energy expenditure.
Keywords: Energy Expenditure; Mitochondria; Obesity; Oxidative Metabolism; SERCA; Sarcolipin; Sarcoplasmic Reticulum (SR); Skeletal Muscle; Skeletal Muscle Metabolism.
© 2015 by The American Society for Biochemistry and Molecular Biology, Inc.
Figures
Similar articles
-
Sarcolipin Signaling Promotes Mitochondrial Biogenesis and Oxidative Metabolism in Skeletal Muscle.Cell Rep. 2018 Sep 11;24(11):2919-2931. doi: 10.1016/j.celrep.2018.08.036. Cell Rep. 2018. PMID: 30208317 Free PMC article.
-
Sarcolipin is a newly identified regulator of muscle-based thermogenesis in mammals.Nat Med. 2012 Oct;18(10):1575-9. doi: 10.1038/nm.2897. Epub 2012 Sep 9. Nat Med. 2012. PMID: 22961106 Free PMC article.
-
Sarcolipin expression is not required for the mitochondrial enzymatic response to physical activity or diet.J Appl Physiol (1985). 2017 May 1;122(5):1276-1283. doi: 10.1152/japplphysiol.00833.2016. Epub 2017 Feb 9. J Appl Physiol (1985). 2017. PMID: 28183820
-
Sarcolipin: A Key Thermogenic and Metabolic Regulator in Skeletal Muscle.Trends Endocrinol Metab. 2016 Dec;27(12):881-892. doi: 10.1016/j.tem.2016.08.006. Epub 2016 Sep 13. Trends Endocrinol Metab. 2016. PMID: 27637585 Free PMC article. Review.
-
Sarcolipin is a novel regulator of muscle metabolism and obesity.Pharmacol Res. 2015 Dec;102:270-5. doi: 10.1016/j.phrs.2015.10.020. Epub 2015 Oct 30. Pharmacol Res. 2015. PMID: 26521759 Free PMC article. Review.
Cited by
-
Precision Nutrition to Activate Thermogenesis as a Complementary Approach to Target Obesity and Associated-Metabolic-Disorders.Cancers (Basel). 2021 Feb 18;13(4):866. doi: 10.3390/cancers13040866. Cancers (Basel). 2021. PMID: 33670730 Free PMC article. Review.
-
GDF15 promotes weight loss by enhancing energy expenditure in muscle.Nature. 2023 Jul;619(7968):143-150. doi: 10.1038/s41586-023-06249-4. Epub 2023 Jun 28. Nature. 2023. PMID: 37380764 Free PMC article.
-
Phospholamban and sarcolipin: Are they functionally redundant or distinct regulators of the Sarco(Endo)Plasmic Reticulum Calcium ATPase?J Mol Cell Cardiol. 2016 Feb;91:81-91. doi: 10.1016/j.yjmcc.2015.12.030. Epub 2015 Dec 29. J Mol Cell Cardiol. 2016. PMID: 26743715 Free PMC article. Review.
-
Salsalate Activates Skeletal Muscle Thermogenesis and Protects Mice from High-Fat Diet Induced Metabolic Dysfunction.EBioMedicine. 2017 Sep;23:136-145. doi: 10.1016/j.ebiom.2017.08.004. Epub 2017 Aug 4. EBioMedicine. 2017. PMID: 28801239 Free PMC article.
-
Altered skeletal muscle sarco-endoplasmic reticulum Ca2+-ATPase calcium transport efficiency after a thermogenic stimulus.Am J Physiol Regul Integr Comp Physiol. 2022 Nov 1;323(5):R628-R637. doi: 10.1152/ajpregu.00173.2022. Epub 2022 Sep 12. Am J Physiol Regul Integr Comp Physiol. 2022. PMID: 36094445 Free PMC article.
References
-
- Lowell B. B., Spiegelman B. M. (2000) Towards a molecular understanding of adaptive thermogenesis. Nature 404, 652–660 - PubMed
-
- Wijers S. L., Saris W. H., van Marken Lichtenbelt W. D. (2009) Recent advances in adaptive thermogenesis: potential implications for the treatment of obesity. Obes. Rev. 10, 218–226 - PubMed
-
- Weibel E. R., Hoppeler H. (2005) Exercise-induced maximal metabolic rate scales with muscle aerobic capacity. J. Exp. Biol. 208, 1635–1644 - PubMed
-
- Engeli S., Birkenfeld A. L., Badin P. M., Bourlier V., Louche K., Viguerie N., Thalamas C., Montastier E., Larrouy D., Harant I., de Glisezinski I., Lieske S., Reinke J., Beckmann B., Langin D., Jordan J., Moro C. (2012) Natriuretic peptides enhance the oxidative capacity of human skeletal muscle. J. Clin. Invest. 122, 4675–4679 - PMC - PubMed
Publication types
MeSH terms
Substances
Grants and funding
LinkOut - more resources
Full Text Sources
Medical
Molecular Biology Databases
Research Materials
Miscellaneous
