. 2015 May 1;290(18):11785-801.
doi: 10.1074/jbc.M115.637306. Epub 2015 Feb 24.

Golgi anti-apoptotic proteins are highly conserved ion channels that affect apoptosis and cell migration

Affiliations

Golgi anti-apoptotic proteins are highly conserved ion channels that affect apoptosis and cell migration

Guia Carrara et al. J Biol Chem. .

Abstract

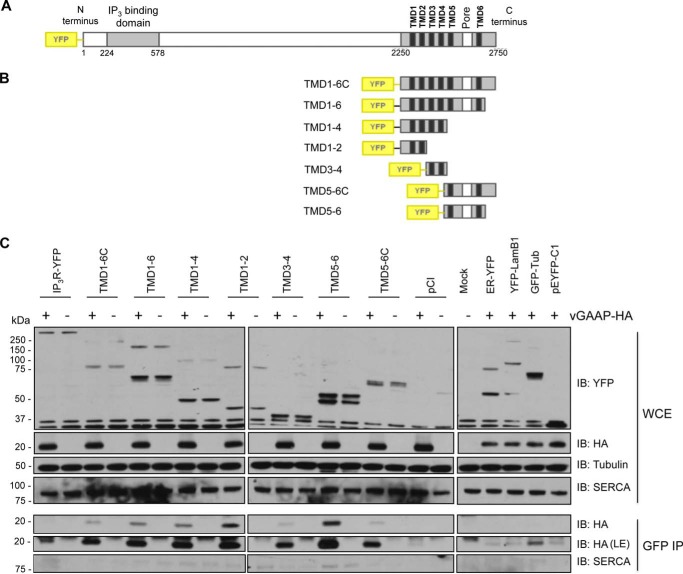
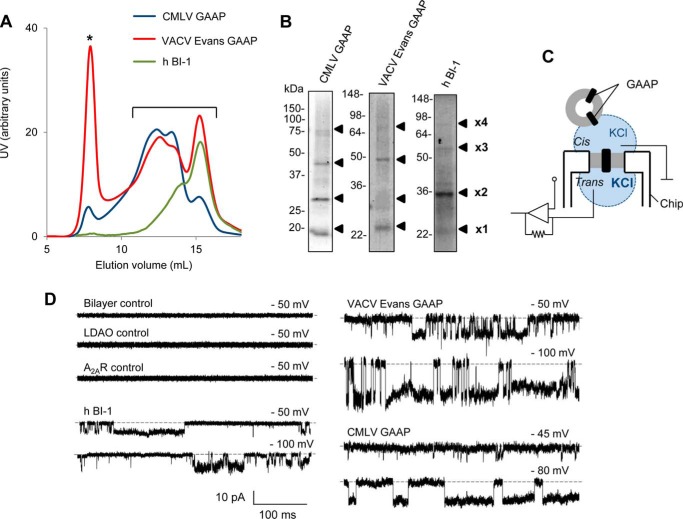
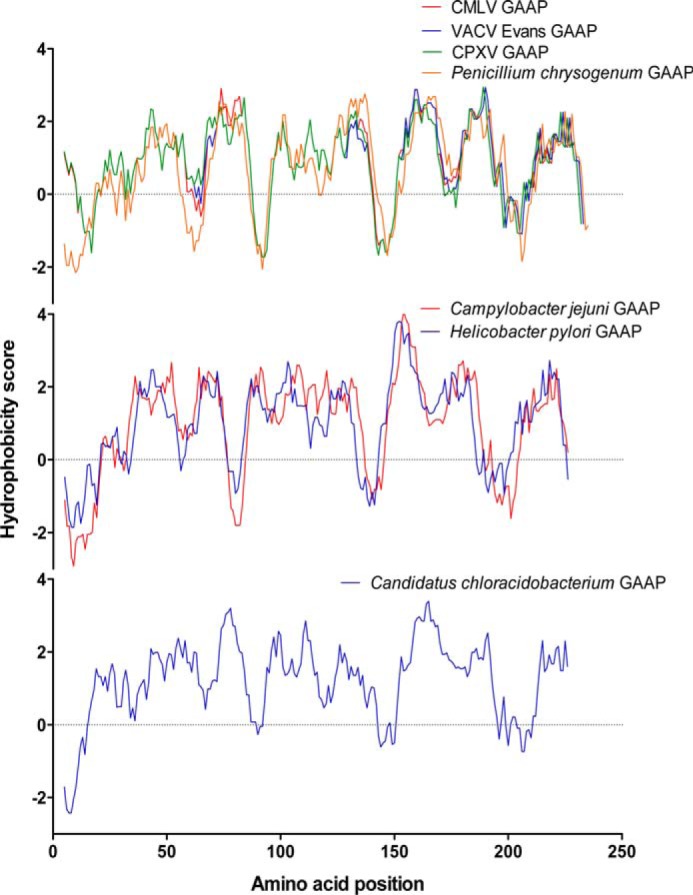
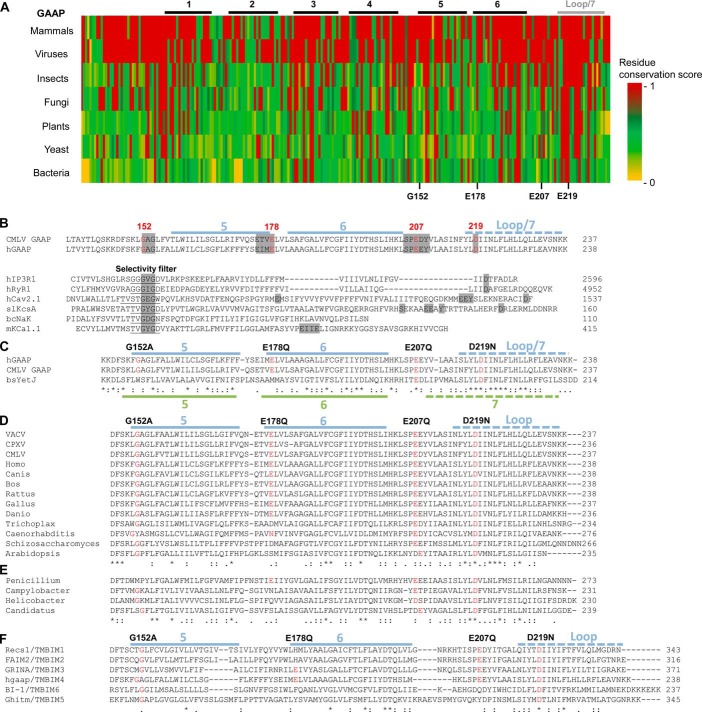
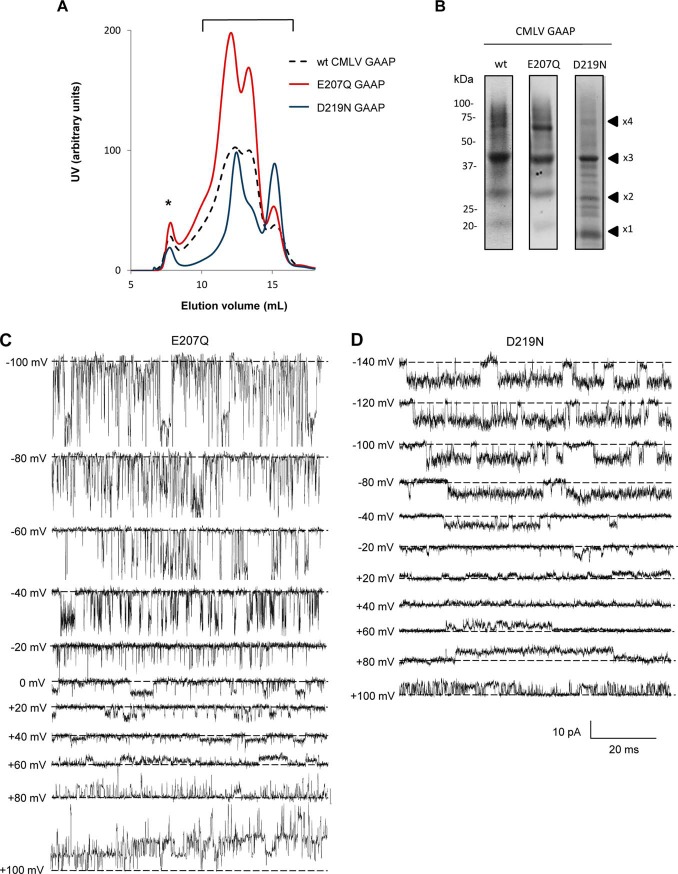
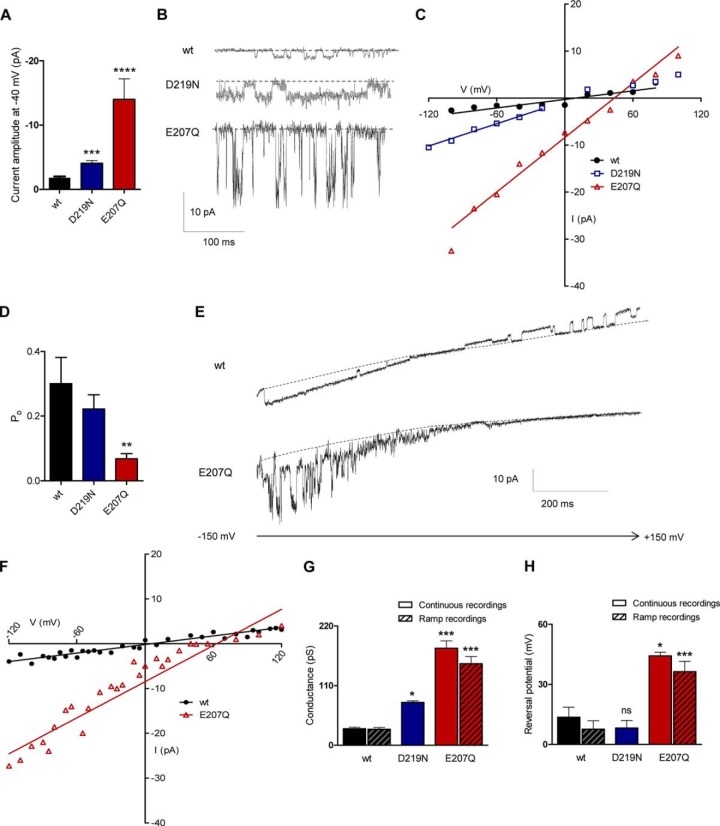
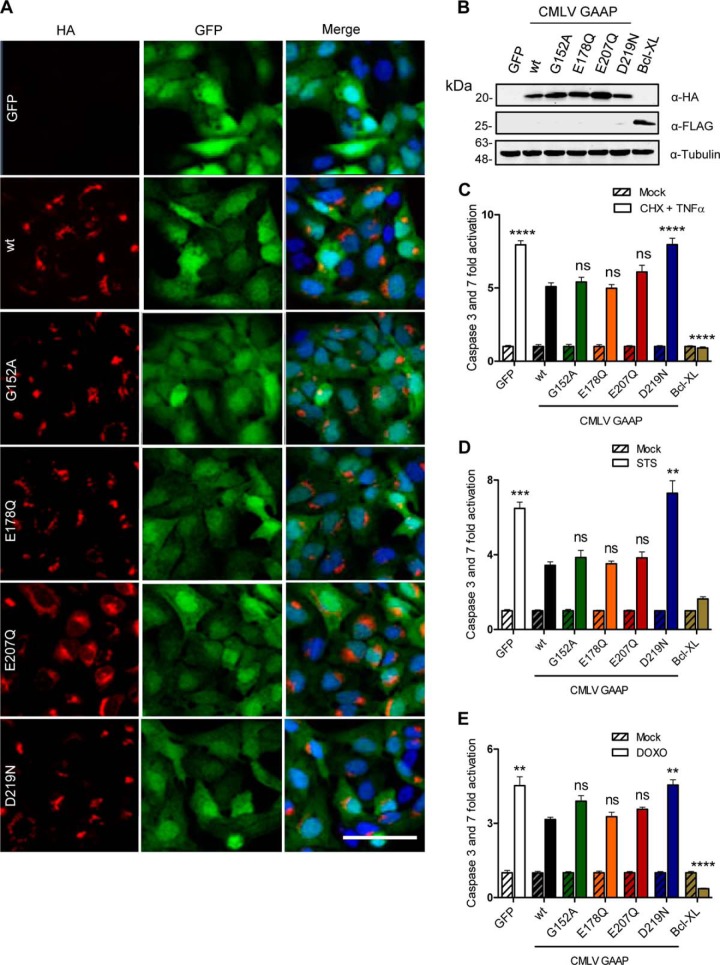
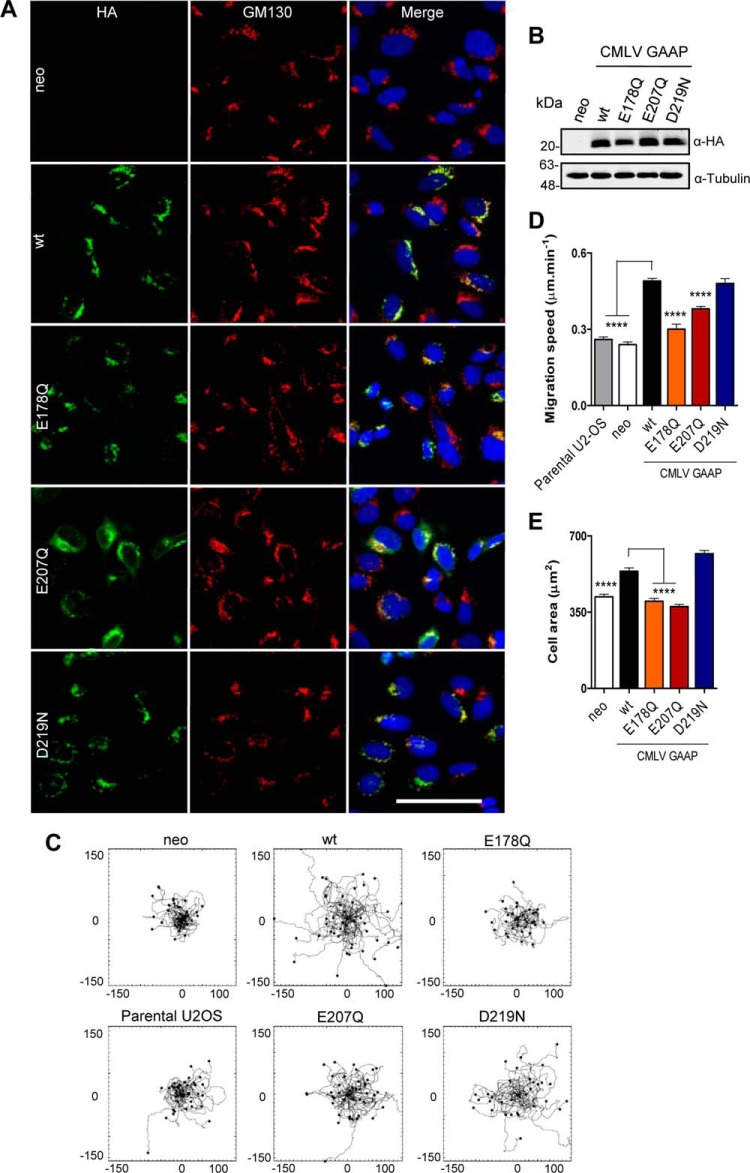
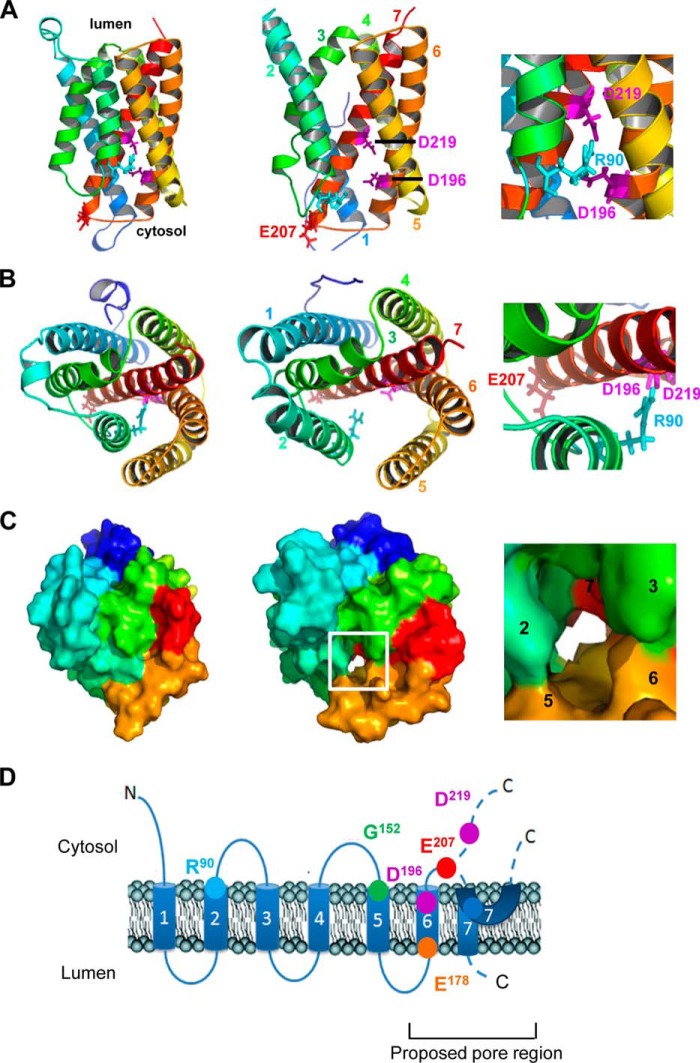
Golgi anti-apoptotic proteins (GAAPs) are multitransmembrane proteins that are expressed in the Golgi apparatus and are able to homo-oligomerize. They are highly conserved throughout eukaryotes and are present in some prokaryotes and orthopoxviruses. Within eukaryotes, GAAPs regulate the Ca(2+) content of intracellular stores, inhibit apoptosis, and promote cell adhesion and migration. Data presented here demonstrate that purified viral GAAPs (vGAAPs) and human Bax inhibitor 1 form ion channels and that vGAAP from camelpox virus is selective for cations. Mutagenesis of vGAAP, including some residues conserved in the recently solved structure of a related bacterial protein, BsYetJ, altered the conductance (E207Q and D219N) and ion selectivity (E207Q) of the channel. Mutation of residue Glu-207 or -178 reduced the effects of GAAP on cell migration and adhesion without affecting protection from apoptosis. In contrast, mutation of Asp-219 abrogated the anti-apoptotic activity of GAAP but not its effects on cell migration and adhesion. These results demonstrate that GAAPs are ion channels and define residues that contribute to the ion-conducting pore and affect apoptosis, cell adhesion, and migration independently.

Keywords: Electrophysiology; Ion Channel; Lipid Bilayer; Membrane Protein; Viral Protein.


Figures

FIGURE 1.
FIGURE 1.
vGAAP is co-immunoprecipitated with all pairs of TMDs from IP3R1. Shown is co-immunoprecipitation (IP) between vGAAP from VACV Evans and full-length and truncated versions of YFP-tagged type 1 IP3R. Shown are schematic representations of the full-length (A) and truncated forms of YFP-IP3R (B) used to map the interaction. C, COS-7 cells were transfected with plasmids encoding the YFP-IP3R proteins, and 18 h later, cells were infected with either v-ΔGAAP (−) or revertant vGAAP-HA (+) VACV and collected after 16 h. Following co-immunoprecipitation with anti-GFP, the immunoprecipitates and the whole cell extracts (WCE) were resolved by SDS-PAGE and immunoblotted (IB) with anti-YFP, anti-HA, anti-SERCA (as a control for contamination with ER and Golgi membrane proteins), and anti-tubulin (loading control) antibodies. Four additional vectors expressing YFP- or GFP-tagged proteins that localize to different organelles were used as negative controls: ER-YFP (ER), YFP-LamB1 (nucleus), GFP-Tub (cytoplasm), and pEYFP-C1 (free YFP). The results shown are typical of three independent experiments. LE, longer exposure.
FIGURE 2.
FIGURE 2.
Purified GAAPs and hBI-1 exhibit ion channel activity in planar lipid bilayers. A and B, biochemical analyses of purified CMLV GAAP, VACV Evans GAAP, and hBI-1. A, UV absorbance profile of purified vGAAPs and hBI-1 during SEC. *, protein aggregation peak. Fractions corresponding to monomeric and oligomeric populations of vGAAPs and hBI-1 were pooled (A, bracket) and concentrated, and their contents were analyzed by non-reducing SDS-PAGE and Coomassie staining (B). The expected positions of the monomeric (×1) and oligomeric proteins (×2, ×3, and ×4) are shown. C, bilayer chamber used. A planar lipid bilayer is formed across a micrometer-sized aperture within the chip. GUVs reconstituted with purified protein are added to the cis chamber (ground), allowing the incorporation of protein into the bilayer. The KCl concentration is greater in the trans relative to the cis chamber. D, electrophysiological recordings from artificial lipid bilayers reconstituted with purified hBI-1, VACV Evans GAAP, or CMLV GAAP show spontaneous channel openings. Representative current traces were recorded at the indicated holding potentials, which are expressed as the potential on the cis side relative to the trans side. Downward deflections of the current trace represent positive ions flowing from the trans to the cis side of the bilayer. The lipid bilayer alone (n = 35), after the addition of GUVs reconstituted in the presence of lauryldimethylamine N-oxide (n = 10), or reconstituted with A2AR (n = 6) was used as a negative control. Dotted line, closed state.
FIGURE 3.
FIGURE 3.
GAAP hydrophobicity profile is conserved among putative GAAP orthologues from viruses, fungi and bacteria. Hydrophobicity profiles for VACV GAAP and CMLV GAAP were aligned with those of newly identified putative GAAPs from CPXV, P. chrysogenum, C. jejuni, H. pylori, and Candidatus C. thermophilum. Complete amino acid sequences were used apart from the putative GAAP of P. chrysogenum origin in which the N-terminal 34-amino acid extension was deleted.
FIGURE 4.
FIGURE 4.
Comparison of conserved regions within GAAP orthologues and the pore motifs of cation channels reveals a region of greatest sequence conservation toward the C-terminal region of GAAP. A, amino acid sequence alignment of hGAAP against GAAP orthologues from 2–3 representative members from each taxon. The level of conservation for each residue was scored according to Scorecons and represented in a color gradient, with red and yellow indicating identity and no similarity, respectively. Sequences analyzed include H. sapiens, B. taurus, and G. gallus (vertebrates); VACV Evans, CMLV, and CPXV (viruses); C. biroi and T. castaneum (insects); P. chrysogenum and T. melanosporum (fungi); A. thaliana, G. aurea, and Z. mays (plants); S. pombe and S. cerevisiae (yeast); and C. jejuni, H. pylori, and Candidatus C. thermophilum (bacteria). B–F, CMLV GAAP and hGAAP from the start of TMD5 to the C terminus were used as queries in BLASTP searches and alignments. The location within CMLV GAAP of TMDs and the proposed re-entrant loop (25) are indicated in blue. Residues chosen for mutation in CMLV GAAP are shown in red. B, partial alignment of CMLV GAAP and hGAAP with the pore regions of other ion channels. These include the intracellular Ca2+ channels, human IP3R1 (hIP3R1), and human ryanodine receptor 1 (hRyR1); a human voltage-gated Ca2+ channel (hCav2.1); the K+ channel KcsA from S. lividans (SlKcsA) and the large conductance Ca2+-activated K+ channel from M. musculus (mKCa1.1); and the non-selective cation channel NaK from B. cereus (BcNaK). The selectivity filters of known ion channels are underlined, and similarities between GAAPs and regions of ion channels involved in ion selectivity or conductance are highlighted in gray. C, partial alignment of the putative pore region of GAAPs with YetJ from B. subtilis. The TMDs appearing in the crystal structure of YetJ (28) are mapped over the alignment in green. D, alignment of the C-terminal region of representative GAAP orthologues shows the degree of conservation of residues chosen for mutagenesis (red). VACV, VACV Evans; Homo, H. sapiens; Canis, C. lupus familiaris; Bos, B. taurus; Rattus, R. norvegicus; Gallus, G. gallus; Danio, D. rerio; Trichoplax, T. adhaerens; Caenorhabditis, C. elegans; Schizosaccharomyces, S. pombe; Arabidopsis, A. thaliana. E, BLASTP analysis using the sequence of VACV Evans GAAP as bait identified putative orthologues of GAAPs in viruses, fungi, and bacteria: cowpox virus (CPXV) strain CPXV_GER2002_MKY_211, P. chrysogenum (Penicillium) (fungi), C. jejuni (Campylobacter), H. pylori (Helicobacter), and Candidatus C. thermophilum (Candidatus) (bacteria). F, amino acid alignment of TMBIM family members shows the high degree of conservation of residues chosen for mutagenesis in CMLV GAAP (red). Fully conserved, strongly similar (scoring >0.5), and weakly similar (scoring <0.5) residues are indicated by asterisks, colons, and dots, respectively.
FIGURE 5.
FIGURE 5.
Mutant vGAAPs form functional channels. A, SEC profile of purified CMLV GAAPs. *, protein aggregation peak. Fractions corresponding to the UV peaks of the various monomeric and oligomeric forms of CMLV GAAP (bracket) were pooled and concentrated, and their contents were analyzed (B) by non-reducing SDS-PAGE and Imperial staining. The expected positions of the monomeric (×1) and oligomeric proteins (×2, ×3, and ×4) are shown. C and D, representative traces of spontaneous single-channel openings from vGAAPs with the indicated mutations recorded under asymmetric ionic conditions (see “Experimental Procedures”) at the indicated voltages. The closed state is indicated by the dotted lines.
FIGURE 6.
FIGURE 6.
Mutant vGAAPs have altered single-channel properties. Spontaneous single-channel currents produced by purified WT, E207Q, and D219N CMLV GAAPs in planar lipid bilayers were measured during stepwise changes in membrane potential (A–D) or, for WT and E207Q GAAPs, from repetitive voltage ramps from −150 mV to +150 mV over 1 s (E and F). A, comparison of single-channel currents produced by WT and mutant GAAPs at −40 mV (n > 4 independent bilayers). Representative traces are shown in B, with the closed state indicated by a dotted line. C, current-voltage (i-V) relationships for single-channel currents measured at different voltages (n = 4–6 independent bilayers). D, single-channel open probability (Po) measured at −40 mV from 4–7 bilayers for WT and mutant CMLV GAAP proteins. Results show means ± S.E. (error bars) (**, p < 0.01). E, representative recordings of WT CMLV GAAP and the E207Q mutant channel activity during voltage ramps. The closed state of the channel is indicated by a dotted line. F, the current-voltage relationships of single-channel currents produced by WT CMLV GAAP and mutant E207Q measured from voltage ramp recordings (n > 14 independent bilayer recordings). G, single-channel conductances calculated from continuous and voltage ramp recordings (n = 4–5 and n > 14 independent bilayers, respectively). Conductance measurements for the D219N mutant were restricted to negative voltages. H, reversal potentials, measured from single-channel currents recorded during stepwise changes in voltage or voltage ramps (n = 3–5 and n > 8 independent bilayers). A, D, G, and H, statistical analyses relative to WT GAAP were made using an unpaired Student's t test (A) or one-way analysis of variance (D, G, and H) followed by Dunnett's (D) or Newman-Keuls multiple comparison tests (G and H); data shown as means ± S.E. (*, p < 0.05; **, p < 0.01; ***, p < 0.001).
FIGURE 7.
FIGURE 7.
Residue Asp-219 of CMLV GAAP is required for GAAP-mediated protection from apoptosis. U2-OS cells were transduced with a bicistronic lentivirus encoding GFP alone or with WT or mutant CMLV GAAPs, each with a C-terminal HA tag. The Bcl-XL lentivirus encoded FLAG-tagged Bcl-XL and GFP. Cells were sorted using fluorescence-activated cell sorting, based on GFP expression. A, confocal microscopy of U2-OS lentivirus cell lines fixed and stained with anti-HA antibody. GFP is shown in green, and DAPI staining is shown in blue. Scale bar, 40 μm. B, cell lysates were immunoblotted with anti-HA, anti-FLAG, and anti-tubulin as a loading control. C–E, polyclonal U2-OS cell lines were mock-treated or treated with CHX (20 μg/ml) and TNF-α (10 ng/ml) for 16 h (C), STS (0.5 μm) for 6 h (D), or DOXO (3 μm) for 48 h (E), and the activities of caspase-3 and -7 were measured. Results are representative of 3–4 independent experiments. Statistical analyses relative to WT GAAP were made using one-way analysis of variance followed by Bonferroni's multiple comparison test (C–E); data are shown as means ± S.E. (error bars) (*, p < 0.05; **, p < 0.01; ***, p < 0.001; ****, p < 0.0001).
FIGURE 8.
FIGURE 8.
Residues Glu-178 and Glu-207 are important for the CMLV GAAP-mediated increase in cell migration and spreading. Polyclonal U2-OS cell lines expressing the empty vector control (neo) or WT or mutant CMLV GAAPs with a C-terminal HA tag were selected using neomycin. A, cells were imaged by confocal microscopy after fixation and antibody staining of HA and the Golgi marker, GM130. Scale bar, 40 μm. B, cell lines were immunoblotted using anti-HA and anti-tubulin antibodies. C and D, cells were allowed to settle for 4 h on fibronectin and then imaged at 5-min intervals for 8 h using wide field phase-contrast microscopy. Tracks of individual cells are shown in C, with the scale in micrometers. Cumulative migration speeds from multiple migration tracks (n > 40 cells) are shown in D. E, cells were left to adhere on fibronectin, and after 30 min, they were fixed, and cell areas in contact with the coverslip were measured for >100 cells in each condition. D–E, values are shown as mean ± S.E. (error bars); ****, p < 0.0001 (one-way analysis of variance followed by Bonferroni's multiple comparison test, relative to WT CMLV GAAP cells).
FIGURE 9.
FIGURE 9.
Structural and topological models of CMLV GAAP. Homology models of CMLV GAAP based on the crystal structures of BsYetJ were generated using I-TASSER. A–C, models of CMLV GAAP in the closed (left column) and open (middle column) states, viewed from the membrane (A) or from the lumen of the Golgi apparatus (B and C). A and B, the side chains of residues discussed under “Results” are colored magenta (Asp-196 and Asp-219), red (Glu-207), and cyan (Arg-90). Helices are colored for clarity: TMD1 (dark blue), TMD2 (light blue), TMD3 (green), TMD4 (yellow), TMD5 (light orange), TMD6 (dark orange), and TMD7 (red). The insets (right-hand column) show enlarged regions of the closed state models. Residues discussed under “Results” are labeled. C, surface model, with helices colored as in A and B. The boxed region of the open state model is enlarged in the inset (right-hand column), showing the location of a predicted continuous pore across the membrane. TMDs are numbered for clarity. D, the location of each CMLV GAAP residue is shown superimposed over its proposed topological structure (25). The locations of predicted TMD1 to -7 are indicated as shown from a GAAP topological model (25) and from the structure of BsYetJ (28). The biological importance of each residue inferred from data acquired is as follows. Residues Glu-207 and Asp-219 are important for the conductance of the channel and Glu-207 for ion selectivity; thus, both are thought to line the pore of the channel. Asp-219 is essential for protection against apoptosis, whereas Glu-207 is important for cell adhesion spread and migration. Arg-90, Asp-196, and Asp-219 correspond to residues shown to form the channel-closing latch in BsYetJ (28).

References

    1. Gubser C., Bergamaschi D., Hollinshead M., Lu X., van Kuppeveld F. J., Smith G. L. (2007) A new inhibitor of apoptosis from vaccinia virus and eukaryotes. PLoS Pathog. 3, e17. - PMC - PubMed
    1. Hu L., Smith T. F., Goldberger G. (2009) LFG: a candidate apoptosis regulatory gene family. Apoptosis 14, 1255–1265 - PubMed
    1. Mariotti M., Smith T. F., Sudmant P. H., Goldberger G. (2014) Pseudogenization of testis-specific Lfg5 predates human/Neanderthal divergence. J. Hum. Genet. 59, 288–291 - PubMed
    1. Lee S., Jo M., Lee J., Koh S. S., Kim S. (2007) Identification of novel universal housekeeping genes by statistical analysis of microarray data. J. Biochem. Mol. Biol. 40, 226–231 - PubMed
    1. Gubser C., Smith G. L. (2002) The sequence of camelpox virus shows it is most closely related to variola virus, the cause of smallpox. J. Gen. Virol. 83, 855–872 - PubMed

Publication types