. 2015 Apr 10;290(15):9906-18.
doi: 10.1074/jbc.M114.633479. Epub 2015 Feb 20.

Thermodynamic and kinetic characterization of the protein Z-dependent protease inhibitor (ZPI)-protein Z interaction reveals an unexpected role for ZPI Lys-239

Affiliations

Thermodynamic and kinetic characterization of the protein Z-dependent protease inhibitor (ZPI)-protein Z interaction reveals an unexpected role for ZPI Lys-239

Xin Huang et al. J Biol Chem. .

Abstract

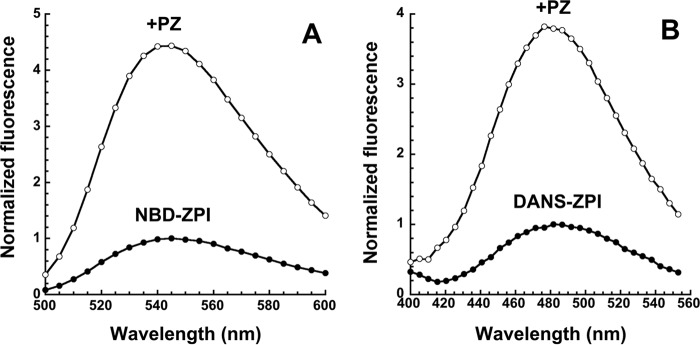
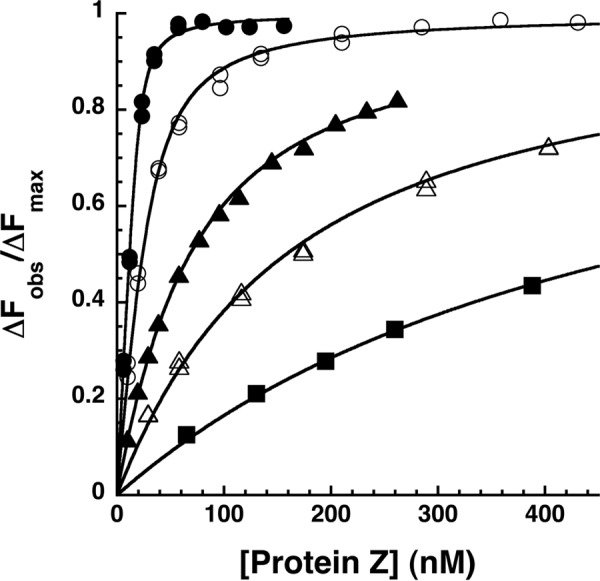
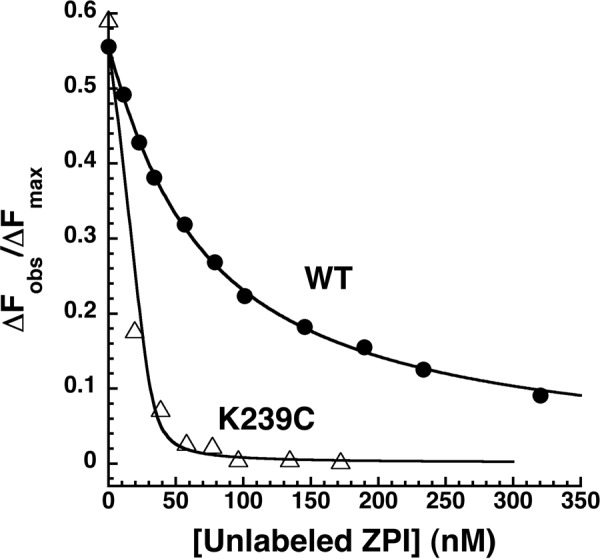
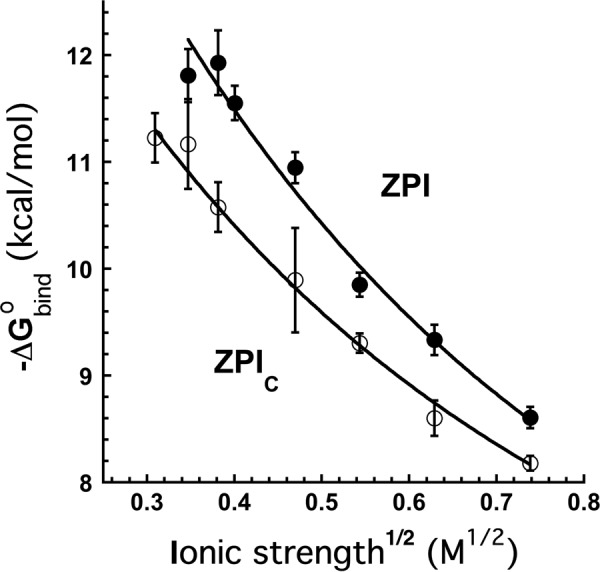
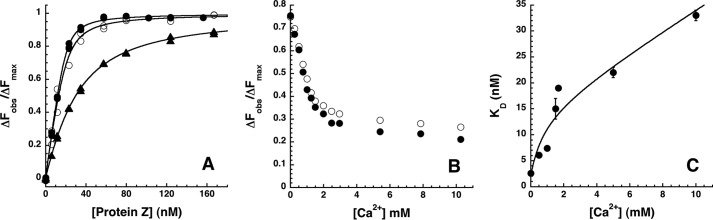
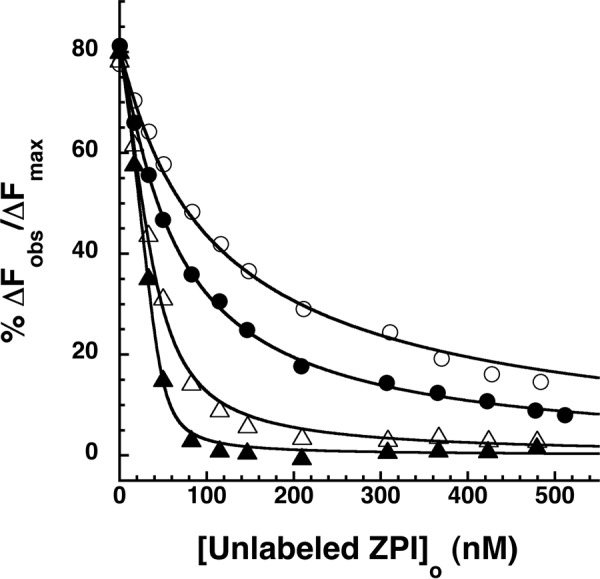
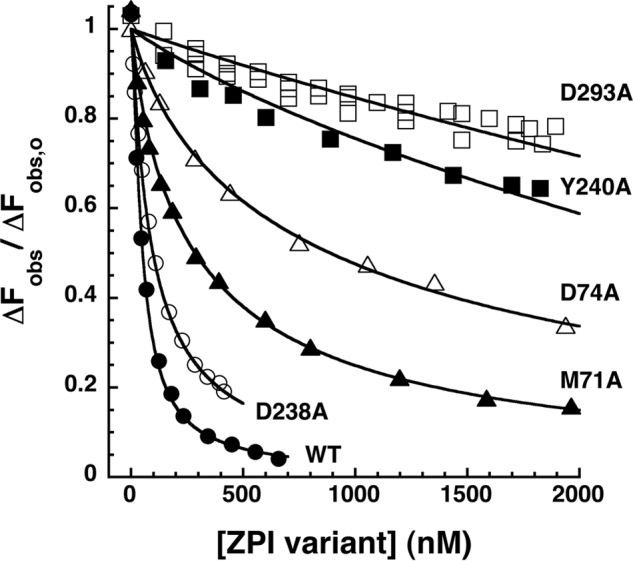
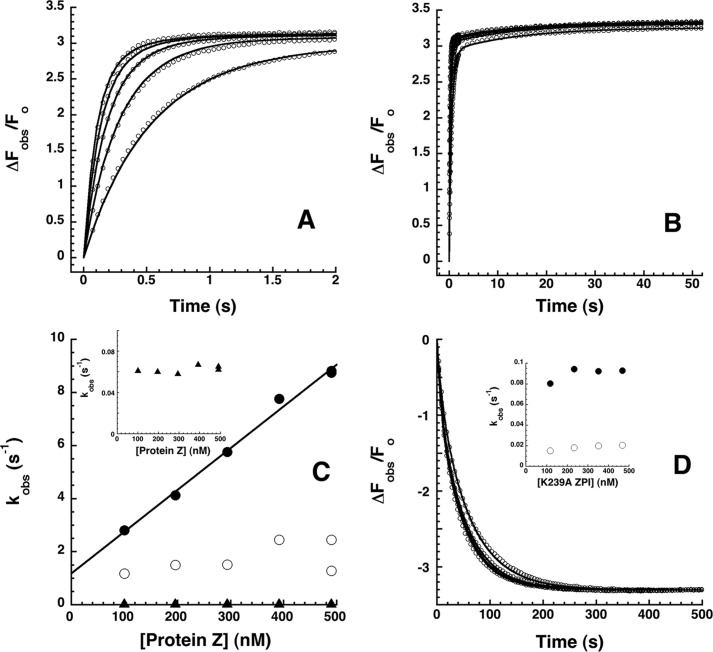
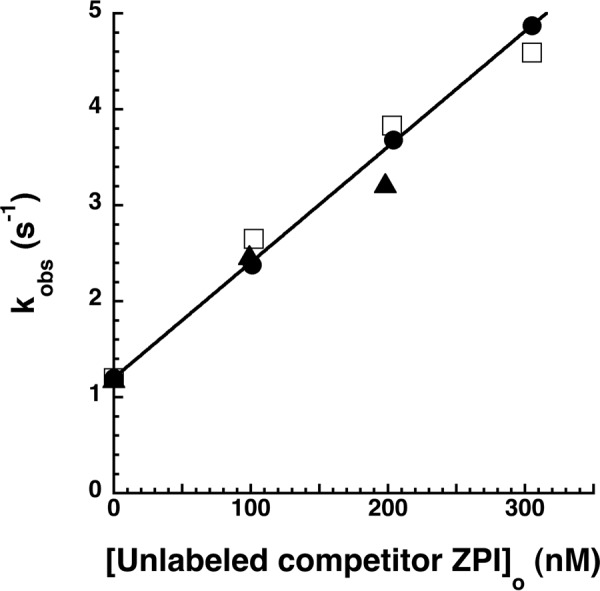
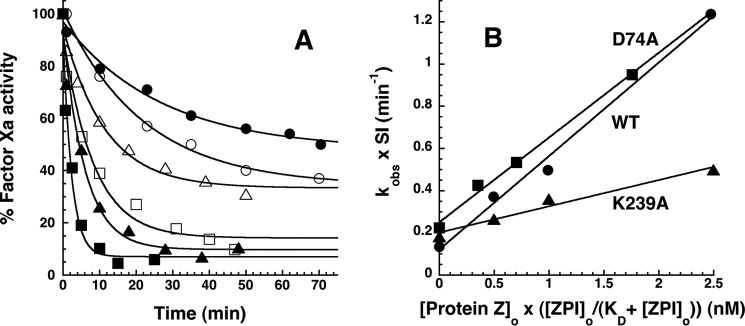
The anticoagulant serpin, protein Z-dependent protease inhibitor (ZPI), circulates in blood as a tight complex with its cofactor, protein Z (PZ), enabling it to function as a rapid inhibitor of membrane-associated factor Xa. Here, we show that N,N'-dimethyl-N-(acetyl)-N'-(7-nitrobenz-3-oxa-1,3-diazol-4-yl)ethylenediamine (NBD)-fluorophore-labeled K239C ZPI is a sensitive, moderately perturbing reporter of the ZPI-PZ interaction and utilize the labeled ZPI to characterize in-depth the thermodynamics and kinetics of wild-type and variant ZPI-PZ interactions. NBD-labeled K239C ZPI bound PZ with ∼3 nM KD and ∼400% fluorescence enhancement at physiologic pH and ionic strength. The NBD-ZPI-PZ interaction was markedly sensitive to ionic strength and pH but minimally affected by temperature, consistent with the importance of charged interactions. NBD-ZPI-PZ affinity was reduced ∼5-fold by physiologic calcium levels to resemble NBD-ZPI affinity for γ-carboxyglutamic acid/EGF1-domainless PZ. Competitive binding studies with ZPI variants revealed that in addition to previously identified Asp-293 and Tyr-240 hot spot residues, Met-71, Asp-74, and Asp-238 made significant contributions to PZ binding, whereas Lys-239 antagonized binding. Rapid kinetic studies indicated a multistep binding mechanism with diffusion-limited association and slow complex dissociation. ZPI complexation with factor Xa or cleavage decreased ZPI-PZ affinity 2-7-fold by increasing the rate of PZ dissociation. A catalytic role for PZ was supported by the correlation between a decreased rate of PZ dissociation from the K239A ZPI-PZ complex and an impaired ability of PZ to catalyze the K239A ZPI-factor Xa reaction. Together, these results reveal the energetic basis of the ZPI-PZ interaction and suggest an important role for ZPI Lys-239 in PZ catalytic action.

Keywords: Anticoagulant; Coagulation Factor; Factor Xa; Kinetics; Protease; Protease Inhibitor; Protein Z; Serpin; ZPI.


Figures

FIGURE 1.
FIGURE 1.
Emission spectra of fluorescently labeled ZPIs and their complexes with protein Z. A, emission spectra of 100 nm NBD-K239C ZPI in pH 7. 1, I 0.15 Tris buffer at 25 °C were taken with excitation at 480 nm in the absence and presence of 300 nm PZ. Corrections were made for background signal of buffer ±PZ and for PZ dilution, and then spectra were normalized to the maximum fluorescence of free labeled ZPI as described under “Experimental Procedures.” B, emission spectra of 100 nm DANS-K239C ZPI were taken in pH 7.1, I 0.15 buffer with excitation at 292 nm in the absence and presence of 230 nm PZ, corrected for buffer and PZ, and normalized as in A.
FIGURE 2.
FIGURE 2.
Equilibrium binding titrations of the NBD-ZPI-PZ interaction at varying ionic strengths. Fluorescence titrations of NBD-ZPI (25 nm) in pH 7. 1 Tris buffer containing 0.1 (●), 0.175 (○), 0.25 (▴), 0.35 (▵), and 0.5 (■) M NaCl at 25 °C were monitored at λex 480 nm and λem 545 nm as a function of increasing PZ concentration. Observed fluorescence values were corrected for buffer and dilution and then fit by the quadratic equilibrium binding equation (solid lines) with the binding stoichiometry fixed at values fitted from separate stoichiometric titrations as described under “Experimental Procedures.” The observed changes in fluorescence (ΔFobs) are expressed relative to the fitted maximal fluorescence change (ΔFmax), the latter showing no significant dependence on ionic strength within experimental error.
FIGURE 3.
FIGURE 3.
Competitive equilibrium binding titrations of the NBD-ZPI-PZ complex with wild-type and K239C ZPI. NBD-ZPI-PZ complex formed with 53 nm NBD-ZPI and 32 nm PZ was titrated with increasing concentrations of unlabeled wild-type and K239C ZPIs in pH 7. 1, I 0.15 Tris buffer at 25 °C, and the observed fluorescence was monitored at 545 nm as in Fig. 2. Fluorescence data corrected for buffer and dilution were fit by the cubic competitive binding equation with the binding stoichiometry and KD for the labeled ZPI interaction fixed at independently measured values and assuming a 1:1 binding stoichiometry for the unlabeled ZPIs as described under “Experimental Procedures.” Observed changes in fluorescence are expressed relative to the fitted maximal fluorescence change of the NBD-ZPI-PZ interaction (ΔFmax).
FIGURE 4.
FIGURE 4.
Ionic strength dependence of NBD-ZPI and NBD-cZPI interactions with PZ. The graph shows a Debye-Hückel analysis of the dependence of the binding free energy (−ΔG0bind) of NBD-labeled intact ZPI (●) and NBD-labeled cZPI (○) interactions with PZ on the square root of the ionic strength. −ΔG0bind was measured from equilibrium binding titrations of the interactions as a function of ionic strength as in Fig. 2. Solid lines are fits by Equation 2 under “Experimental Procedures.” Error bars represent ±S.E.
FIGURE 5.
FIGURE 5.
Calcium ion effects on the ZPI-PZ interaction. A, equilibrium binding titrations of 25 nm NBD-ZPI with PZ in pH 7. 1, I 0.15 Tris buffer at 25 °C (●) without or with the addition of 15 mm NaCl (○) or 5 mm CaCl2 (▴). Observed changes in fluorescence corrected for buffer and dilution are expressed relative to the fitted maximal fluorescence change. Solid lines are fits of data by the quadratic binding equation. B, titrations of NBD-ZPI-PZ complex formed with 26 nm labeled ZPI and 26 nm PZ with CaCl2 in pH 7.1, I 0.15 Tris buffer at 25 °C. Observed fluorescence changes were corrected for buffer and dilution as well as for minor scattering changes in control titrations with buffer lacking CaCl2 and expressed relative to the fitted maximal fluorescence change in separate titrations of NBD-ZPI with PZ under identical conditions. Closed and open circles represent replicate titrations. C, dependence of KD measured in equilibrium binding titrations of 25 nm NBD-ZPI with PZ in pH 7.1, I 0.15 buffer containing the indicated fixed concentrations of CaCl2. The solid line is a fit of data by Equation 3 under “Experimental Procedures” that relates specific calcium ion binding to NBD-ZPI and/or PZ and ionic strength effects of calcium to complex affinity. Error bars represent ±S.E.
FIGURE 6.
FIGURE 6.
Effect of wild-type and K239A ZPI complexation with factor Xa on ZPI-PZ affinity. Competitive equilibrium binding titrations of NBD-ZPI-PZ complex formed with 55 nm NBD-ZPI and 49 nm PZ with wild-type ZPI (circles) or K239A ZPI (triangles) before (closed symbols) and after reaction with 1 SI eq of factor Xa (open symbols) are shown. Titrations were performed in pH 7.1, I 0.15 Tris buffer at 25 °C, and the observed fluorescence changes were corrected for buffer and dilution. Data were fit by the cubic competitive binding equation as in Fig. 3 (solid lines), and ΔFobs was expressed relative to the fitted maximal fluorescence change.
FIGURE 7.
FIGURE 7.
Competitive equilibrium binding titrations of NBD-ZPI-PZ complex with unlabeled mutant ZPIs. NBD-ZPI-PZ complex formed with 54 nm NBD-ZPI and 52 nm PZ was titrated with increasing concentrations of unlabeled ZPI variants with mutations in PZ binding site residues as indicated in pH 7. 1, I 0.15 Tris buffer at 25 °C, and the observed fluorescence was monitored at 545 nm as in Fig. 3. Fluorescence data corrected for buffer and dilution were fit by the cubic competitive binding equation as in Fig. 3 (solid lines). Additional details are provided under “Experimental Procedures.”
FIGURE 8.
FIGURE 8.
Rapid kinetics of NBD-ZPI binding to PZ. A and B, NBD-ZPI (20 nm) was mixed with 100, 200, 300, 400, and 500 nm PZ, and the observed fluorescence changes (circles) were monitored over split time frames of 2 (A) and 50 s (B). Observed fluorescence changes from multiple averaged reaction traces were calculated by subtracting buffer background and fit by the three-exponential equation under “Experimental Procedures.” After correcting fluorescence amplitudes based on measured equilibrium KD values, ΔFobs was expressed relative to the fitted initial fluorescence. Every 10th data point is shown for clarity. Solid lines are global Kintek fits of complex association data together with dissociation data in D by a three-step sequential binding model. C, PZ concentration dependence of observed pseudo-first order rate constants for phase 1 (●), phase 2 (○), and phase 3 (▴) obtained from fits of data by the three-exponential function under “Experimental Procedures.” The solid line is a linear least squares fit of the phase 1 data, and the inset shows an expanded scale of the phase 3 data. D, kinetics of dissociation of the NBD-ZPI-PZ complex formed with 25 nm NBD-ZPI and 25 nm PZ after mixing with 200, 300, and 400 nm unlabeled K239A ZPI. Observed fluorescence changes were calculated as in A and B and fitted by the two-exponential equation under “Experimental Procedures.” After normalization based on the average fitted maximal fluorescence change, ΔFobs was expressed relative to the initial fluorescence of the complex. Solid lines are global Kintek fits of dissociation data together with the association data of A and B by the three-step binding model. The inset shows the K239A ZPI concentration dependence of kobs for phase 1 (●) and phase 2 (○).
FIGURE 9.
FIGURE 9.
Kinetics of competitive binding of unlabeled and NBD-labeled ZPIs to PZ. NBD-ZPI (100 nm) was mixed with 20 nm PZ in the absence and presence of increasing concentrations of unlabeled wild-type intact (●) or cleaved (□) ZPI or K239A ZPI (▴). Averaged reaction traces were fit by the three-exponential equation, and kobs for phase 1 was plotted as a function of unlabeled competitor ZPI concentration. The solid line is a linear least squares fit of the wild-type intact ZPI data.
FIGURE 10.
FIGURE 10.
Effect of catalytic PZ on the kinetics of wild-type and variant ZPI-factor Xa reactions. A, progress curves are shown for reactions of 200 nm wild-type (closed symbols) or K239A ZPI (open symbols) with 6 nm factor Xa in the absence (circles) and presence of 1 (triangles) and 2. 5 nm (squares) PZ at 25 °C in pH 7.4 Tris buffer, I 0.15 containing 5 mm calcium and 25 μm phospholipid. Solid lines are fits by a single exponential function with nonzero end point. The end points progressively decrease with increasing PZ concentration because acylation and deacylation rates for formation and dissociation of the ZPI-PZ complex are comparable in the absence of PZ, whereas acylation is favored in the presence of PZ (4). B, dependence of SI-corrected kobs values for reactions of 200 nm wild-type (●), K239A (▴), and D74A (■) ZPIs with 6 nm factor Xa on PZ concentration corrected for the fraction of PZ bound to ZPI based on KD values reported in Table 2. kobs was obtained from exponential fits of the reaction progress curves in A and others not shown for the indicated ZPI-factor Xa reactions. SI corrections of kobs were made by summing the products, kobs × SI, for uncatalyzed and PZ-catalyzed contributions to the measured kobs based on SIs reported in Table 1 and Ref. . Solid lines are linear regression fits from which second order association rate constants for PZ catalysis of the ZPI-factor Xa reactions were obtained.

Similar articles

Cited by

References

    1. Han X., Fiehler R., Broze G. J., Jr. (1998) Isolation of a protein Z-dependent plasma protease inhibitor. Proc. Natl. Acad. Sci. U.S.A. 95, 9250–9255 - PMC - PubMed
    1. Han X., Huang Z. F., Fiehler R., Broze G. J., Jr. (1999) The protein Z-dependent protease inhibitor is a serpin. Biochemistry 38, 11073–11078 - PubMed
    1. Han X., Fiehler R., Broze G. J., Jr. (2000) Characterization of the protein Z-dependent protease inhibitor. Blood 96, 3049–3055 - PubMed
    1. Huang X., Swanson R., Broze G. J., Jr., Olson S. T. (2008) Kinetic characterization of the protein Z-dependent protease inhibitor reaction with blood coagulation factor Xa. J. Biol. Chem. 283, 29770–29783 - PMC - PubMed
    1. Yin Z. F., Huang Z. F., Cui J., Fiehler R., Lasky N., Ginsburg D., Broze G. J., Jr. (2000) Prothrombotic phenotype of protein Z deficiency. Proc. Natl. Acad. Sci. U.S.A. 97, 6734–6738 - PMC - PubMed

Publication types

MeSH terms

LinkOut - more resources