

Metabolomics and diabetes: analytical and computational approaches
- PMID: 25713200
- PMCID: PMC4338589
- DOI: 10.2337/db14-0509
Metabolomics and diabetes: analytical and computational approaches
Abstract
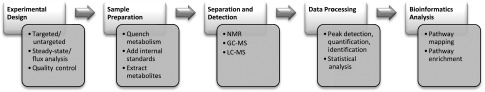
Diabetes is characterized by altered metabolism of key molecules and regulatory pathways. The phenotypic expression of diabetes and associated complications encompasses complex interactions between genetic, environmental, and tissue-specific factors that require an integrated understanding of perturbations in the network of genes, proteins, and metabolites. Metabolomics attempts to systematically identify and quantitate small molecule metabolites from biological systems. The recent rapid development of a variety of analytical platforms based on mass spectrometry and nuclear magnetic resonance have enabled identification of complex metabolic phenotypes. Continued development of bioinformatics and analytical strategies has facilitated the discovery of causal links in understanding the pathophysiology of diabetes and its complications. Here, we summarize the metabolomics workflow, including analytical, statistical, and computational tools, highlight recent applications of metabolomics in diabetes research, and discuss the challenges in the field.
© 2015 by the American Diabetes Association. Readers may use this article as long as the work is properly cited, the use is educational and not for profit, and the work is not altered.
Figures
References
-
- Centers for Disease Control and Prevention National Diabetes Fact Sheet: National Estimates and General Information on Diabetes and Prediabetes in the United States. Atlanta, GA, U.S. Department of Health and Human Services, Centers for Disease Control and Prevention, 2011
-
- Dunn WB, Wilson ID, Nicholls AW, Broadhurst D. The importance of experimental design and QC samples in large-scale and MS-driven untargeted metabolomic studies of humans. Bioanalysis 2012;4:2249–2264 - PubMed
-
- Want EJ, Masson P, Michopoulos F, et al. Global metabolic profiling of animal and human tissues via UPLC-MS. Nat Protoc 2013;8:17–32 - PubMed
Publication types
MeSH terms
Grants and funding
- UL1 TR000433/TR/NCATS NIH HHS/United States
- DP3 DK094292/DK/NIDDK NIH HHS/United States
- 2UL1-TR-000433/TR/NCATS NIH HHS/United States
- DK-081943/DK/NIDDK NIH HHS/United States
- DK-082841/DK/NIDDK NIH HHS/United States
- DK-089503/DK/NIDDK NIH HHS/United States
- R24 DK082841/DK/NIDDK NIH HHS/United States
- P30 DK089503/DK/NIDDK NIH HHS/United States
- P30 DK020572/DK/NIDDK NIH HHS/United States
- P30 DK081943/DK/NIDDK NIH HHS/United States
- DK-094292/DK/NIDDK NIH HHS/United States
- U24 DK097153/DK/NIDDK NIH HHS/United States
- DK-097153/DK/NIDDK NIH HHS/United States
LinkOut - more resources
Full Text Sources
Other Literature Sources
Medical
