. 2015 Feb 24;4(2):e001770.
doi: 10.1161/JAHA.115.001770.

Endothelial p53 deletion improves angiogenesis and prevents cardiac fibrosis and heart failure induced by pressure overload in mice

Affiliations

Endothelial p53 deletion improves angiogenesis and prevents cardiac fibrosis and heart failure induced by pressure overload in mice

Rajinikanth Gogiraju et al. J Am Heart Assoc. .

Abstract

Background: Cardiac dysfunction developing in response to chronic pressure overload is associated with apoptotic cell death and myocardial vessel rarefaction. We examined whether deletion of tumor suppressor p53 in endothelial cells may prevent the transition from cardiac hypertrophy to heart failure.

Methods and results: Mice with endothelial-specific deletion of p53 (End.p53-KO) were generated by crossing p53fl/fl mice with mice expressing Cre recombinase under control of an inducible Tie2 promoter. Cardiac hypertrophy was induced by transverse aortic constriction. Serial echocardiography measurements revealed improved cardiac function in End.p53-KO mice that also exhibited better survival. Cardiac hypertrophy was associated with increased p53 levels in End.p53-WT controls, whereas banded hearts of End.p53-KO mice exhibited lower numbers of apoptotic endothelial and non-endothelial cells and altered mRNA levels of genes regulating cell cycle progression (p21), apoptosis (Puma), or proliferation (Pcna). A higher cardiac capillary density and improved myocardial perfusion was observed, and pharmacological inhibition or genetic deletion of p53 also promoted endothelial sprouting in vitro and new vessel formation following hindlimb ischemia in vivo. Hearts of End.p53-KO mice exhibited markedly less fibrosis compared with End.p53-WT controls, and lower mRNA levels of p53-regulated genes involved in extracellular matrix production and turnover (eg, Bmp-7, Ctgf, or Pai-1), or of transcription factors involved in controlling mesenchymal differentiation were observed.

Conclusions: Our analyses reveal that accumulation of p53 in endothelial cells contributes to blood vessel rarefaction and fibrosis during chronic cardiac pressure overload and suggest that endothelial cells may be a therapeutic target for preserving cardiac function during hypertrophy.

Keywords: angiogenesis; endothelium; fibrosis; heart failure; p53.


Figures

Figure 1.
Figure 1.
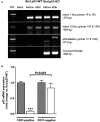
Genotyping of endothelial p53 knockout and wildtype mice. A, Genomic DNA was isolated from mouse tail biopsies obtained before and 6 weeks after feeding mice tamoxifen citrate‐containing chow and amplified by PCR. Floxed p53 alleles were identified using forward (F) and reverse (R) primer against intron 1 or intron 10. Excision of p53 exons was confirmed in Cre recombinase transgenic mice. B, qPCR analysis of p53 mRNA expression in CD31‐positive and CD31‐negative cells, isolated from hearts of End.p53‐WT (grey bars; n=6) and End.p53‐KO (white bars; n=6) mice. ***P<0.001 vs CD31‐positive cells isolated from End.p53‐WT mice. Significant differences between CD31‐positive and CD31‐negative cells of End.p53‐KO mice are indicated within the graph. MW indicates molecular weight marker; PCR, polymerase chain reaction.
Figure 2.
Figure 2.
Vascular function analysis in endothelial p53 wildtype and knockout mice. A, Representative fluorescence images after immunostaining for caveolin‐1 (Cav‐1), eNOS, VCAM‐1 or p53 in the aorta of End.p53‐WT and End.p53‐KO mice. CD31 was used to identify endothelial cells, DAPI to visualize cell nuclei. Size bars represent 100 μm. B through D, Contraction and relaxation curves of isolated rings of thoracic aortas from End.p53‐WT (n=8) or End.p53‐KO (n=6) mice in response to increasing concentrations of phenylephrine (B), acetylcholine (Ach; C) or glyceryl trinitrate (GTN; D). DAPI indicates 4′,6‐diamidino‐2‐phenylindole.
Figure 3.
Figure 3.
Effect of endothelial p53 deletion on survival and cardiac hypertrophy and function. A, Kaplan–Meier survival analysis of sham‐ (n=19; n=12 End.p53‐WT and n=7 End.p53‐KO) or TAC‐operated End.p53‐WT (n=41) and End.p53‐KO (n=34) mice. Mean values for fractional shortening (FS; B), enddiastolic inner LV diameters (EDD; C), posterior wall thickness (PWTh; D), LV weight, determined by echocardiography (E), and actual heart weight, determined at necropsy (F), at baseline and different time points after TAC or sham operation are shown. *P<0.05, **P<0.01 and ***P<0.001 vs sham, #P<0.05, ##P<0.01 and ###P<0.001 vs baseline. Significant differences between End.p53‐WT and End.p53‐KO mice at specific time points after TAC are indicated within the graphs. TAC indicates transverse aortic constriction.
Figure 4.
Figure 4.
Effect of endothelial p53 deletion on single cardiomyocyte hypertrophy. Representative pictures of WGA‐stained myocardial cross sections (A) and the results after quantification of the cardiomyocyte cross‐sectional area (CSA; n=7 to 16 mice per group; B) are shown. Size bars represent 100 μm. Grey bars: End.p53‐WT mice; white bars: End.p53‐KO mice; dotted bars: sham‐operated mice. ***P<0.001 vs sham. Significant differences between End.p53‐WT and End.p53‐KO mice are indicated within the graphs. WGA indicates wheat germ agglutinin.
Figure 5.
Figure 5.
Expression of p53 in sham and TAC‐operated mouse hearts. The relative cardiac mRNA and protein expression levels of p53 were analyzed using quantitative qPCR (A) or western blot (B, representative western blot findings are shown in C) in End.p53‐WT (grey bars) and End.p53‐KO mice (white bars) (n=8 to 19 mice per group). Results were normalized to Gapdh and expressed as ‐fold change vs sham‐operated littermates of the same genotype (set at 1; dotted bars). D through F, Cardiac cross sections were examined for the expression of p53. Intravitally isolectin B4 perfused capillaries are green, DAPI‐positive cell nuclei blue. Representative pictures of findings in End.p53‐WT and End.p53‐KO mice after sham or TAC surgery are shown in (D). Size bars represent 100 μm. The summary of findings in n=4 to 6 mice per group is shown in (E and F). **P<0.01 and ***P<0.001 vs sham. Significant differences between End.p53‐WT and End.p53‐KO mice are indicated within the graphs. PCR indicates polymerase chain reaction; DAPI,4′,6‐diamidino‐2‐phenylindole; TAC, transverse aortic constriction.
Figure 6.
Figure 6.
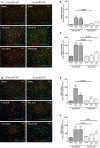
Analysis of apoptosis in sham and TAC‐operated mouse hearts. Cardiac cross sections were examined for activated caspase‐3 (A through C) or TUNEL (D through F). Intravitally isolectin B4 perfused capillaries are green, DAPI‐positive cell nuclei blue. Representative pictures of findings in End.p53‐WT and End.p53‐KO mice (n=3 to 8 per group) are shown in (A and D). Size bars represent 100 μm. *P<0.05, **P<0.01 and ***P<0.001 vs sham. Significant differences between End.p53‐WT and End.p53‐KO mice are indicated within the graphs. TAC indicates transverse aortic constriction; DAPI, 4′,6‐diamidino‐2‐phenylindole.
Figure 7.
Figure 7.
Expression of p53 target genes involved in cell cycle control, apoptosis and proliferation in sham and TAC‐operated mouse hearts. The relative cardiac mRNA expression levels of p21, p53 upregulated modulator of apoptosis (Puma) and proliferating cell nuclear antigen (Pcna) were analyzed using quantitative qPCR in End.p53‐WT (grey bars) and End.p53‐KO mice (white bars) (n=8 to 19 mice per group). Results were normalized to Gapdh and expressed as ‐fold change vs sham‐operated littermates of the same genotype (set at 1; not shown). *P<0.05 and **P<0.01 vs End.p53‐WT. PCR indicates polymerase chain reaction; TAC, transverse aortic constriction.
Figure 8.
Figure 8.
Cardiac vascularization in End.p53‐WT and End.p53‐KO mice. A, Representative pictures of CD31‐immunopositive, isolectin B4‐perfused capillaries in hearts of sham‐ or TAC‐operated End.p53‐WT and End.p53‐KO mice. B, Quantification of CD31‐positive cells per mm2. C, Quantification of the lectin‐positive area. D, Immunostaining for CAIX to visualize cardiac hypoxia. Size bars represent 100 μm. E, The summary of the quantitative analysis in n=4 to 9 mice per group. *P<0.05 and ***P<0.001 vs sham. Significant differences between End.p53‐WT and End.p53‐KO mice are indicated within the graphs. TAC indicates transverse aortic constriction.
Figure 9.
Figure 9.
Effect of endothelial p53 deletion on new vessel formation following hindlimb ischemia. A, Representative laser Doppler perfusion images before as well as on day 1 and 28 after unilateral hindlimb ischemia in End.p53‐WT and End.p53‐KO mice. B, Summarized findings in End.p53‐WT (n=16) and End.p53‐KO mice (n=14). **P<0.01 and ***P<0.001 vs baseline; ###P<0.001 vs End.p53‐WT mice. C, Representative pictures of CD31‐immunopositive endothelial cells in cryosections through the gastrocnemic muscle. Cell nuclei were counterstained with DAPI. Size bars represent 100 μm. D, Quantitative analysis of the capillary density 28 days after ischemia (n=8 to 10 mice per group). **P<0.01 vs the contralateral, uninjured leg. Significant differences between End.p53‐WT and End.p53‐KO mice are indicated within the graph; DAPI indicates 4′, 6‐diamidino‐2‐phenylindole.
Figure 10.
Figure 10.
Effect of p53 modulation on the angiogenic properties of endothelial cells in vitro. A, Representative western blot membranes showing the expression of p53 or its downstream effector p21 after incubation of human cardiac microvascular endothelial cells (HCMECs) with either PBS (1), vehicle (DMSO; 2), nutlin‐3a (10 μmol/L; 3) or pifithrin‐α (20 μmol/L; 4). Gapdh was used as internal control for equal protein loading. B, Representative pictures of HCMECs treated with either DMSO, nutlin‐3a or pifithrin‐α, followed by immunodetection of p53. C, Representative pictures of HCMEC spheroids after treatment with either DMSO, nutlin‐3a or pifithrin‐α. Magnification, ×200. D and E, Summary of the quantitative and statistical analysis. The number of sprouts (D) or the total sprout length (E) per spheroid were calculated using ImagePro Plus image analysis software. *P<0.05 and **P<0.01 vs DMSO; ###P<0.001 vs nutlin‐3a, as determined using ANOVA. ANOVA indicates analysis of variance; DMSO, dimethyl sulfoxide.
Figure 11.
Figure 11.
Effect of endothelial p53 deletion on Hif1α and Vegf levels. A through F, Western blot analysis of cardiac Hif1α and Vegf protein levels in End.p53‐WT and End.p53‐KO mice at different time points after transverse aortic constriction (TAC) or sham operation (S). Representative membranes are shown in A (8 and 20 weeks after TAC) and D (7 days after TAC). *P<0.05 and **P<0.01 vs sham. Significant differences between End.p53‐WT and End.p53‐KO mice are indicated within the graphs. G and H, Analysis of Hif1α protein levels in HCMECs after stable transfection with lentiviral p53 shRNA or negative control vector (scr shRNA) and exposure to chemical hypoxia (1 mmol/L CoCl2 for 4 h). Representative findings are shown in G, the results of the quantitative analysis of n=3 independent experiments in H. ***P<0.001.
Figure 12.
Figure 12.
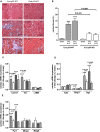
Effect of endothelial p53 deletion on cardiac fibrosis. A, Representative images after MTC staining of hearts from End.p53‐WT and End.p53‐KO mice. Size bars represent 200 μm. B, Summary of the quantitative analysis in n=7 to 15 mice per group. Quantitative qPCR analysis of the mRNA levels of ECM proteins and mesenchymal markers (C), or factors involved in ECM production (D) and degradation (E). Grey bars: End.p53‐WT mice; white bars: End.p53‐KO mice; open bars: 8 W after TAC; cross‐hatched bars: 20 W after TAC. Results were normalized to Gapdh and are expressed as ‐fold increase vs sham‐operated mice (set at 1; not shown). *P<0.05, **P<0.01 and ***P<0.001 vs sham. Significant differences between End.p53‐WT and End.p53‐KO mice are indicated within the graphs. PCR indicates polymerase chain reaction; TAC, transverse aortic constriction.
Figure 13.
Figure 13.
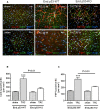
Co‐localization of endothelial and mesenchymal markers in hearts of sham and TAC‐operated mice. A through C, Representative images (A) and summarized findings after quantification of Col1A1+/CD31+ (B) and Fsp‐1+/CD31+ cells (C) in hearts of sham‐ or TAC‐operated End.p53‐WT and End.p53‐KO mice (n=3 to 6). Size bars represent 100 μm. ***P<0.001 vs sham. Significant differences between End.p53‐WT and End.p53‐KO mice are indicated within the graph. TAC indicates transverse aortic constriction.
Figure 14.
Figure 14.
Effect of endothelial p53 deletion on transcription factors involved in mesenchymal differentiation. A through C, qPCR analysis of whole mouse hearts (n=9 per group) from End.p53‐KO (white bars) and End.p53‐WT mice (grey bars) 8 weeks after TAC for Snail (A), Slug (B) and Twist (C) mRNA. ***P<0.001 vs sham. D through F, HCMECs were stable transfected with lentiviral p53‐shRNA or negative control (scr) shRNA vector, treated with PBS or TGFβ1 (10 ng/mL) for 6 or 12 days and the expression of transcription factors regulating mesenchymal differentiation examined by qPCR analysis. *P<0.05, **P<0.01 and ***P<0.001 vs PBS‐treated cells (n=3 to 6 separate experiments). Significant differences between p53 shRNA and scr shRNA transfected cells are indicated within the graphs. HCMEC indicates human cardiac microvascular endothelial cells; PCR, polymerase chain reaction; TAC, transverse aortic constriction; TGFβ, transforming growth factor‐beta.
Figure 15.
Figure 15.
Effect of p53 activation or inhibition on the TGFβ‐induced expression of the transcription factors Snail, Slug, and Twist. A through C, Quantitative real‐time PCR analysis of the transcription factors and EndMT surrogate markers Snail (A), Slug (B) and Twist (C) mRNA expression in human cardiac microvascular endothelial cells (HCMECs) after treatment with TGFβ1, alone or in combination with nutlin‐3a (to stabilize p53) or pifithrin‐α (to inhibit p53 activity) for 6 days. Similar findings were observed after treatment for 12 days (not shown). *P<0.05, **P<0.01 and ***P<0.001 vs untreated cells; #P<0.05, ##P<0.01 and ##P<0.001 vs TGFβ1‐treated cells. PCR indicates polymerase chain reaction; TGFβ, transforming growth factor‐beta.

References

    1. Hein S, Arnon E, Kostin S, Schonburg M, Elsässer A, Polyakova V, Bauer EP, Klovekorn WP, Schaper J. Progression from compensated hypertrophy to failure in the pressure‐overloaded human heart: structural deterioration and compensatory mechanisms. Circulation. 2003; 107:984-991. - PubMed
    1. Shiojima I, Sato K, Izumiya Y, Schiekofer S, Ito M, Liao R, Colucci WS, Walsh K. Disruption of coordinated cardiac hypertrophy and angiogenesis contributes to the transition to heart failure. J Clin Invest. 2005; 115:2108-2118. - PMC - PubMed
    1. Oka T, Akazawa H, Naito AT, Komuro I. Angiogenesis and cardiac hypertrophy. Maintenance of cardiac function and causative roles in heart failure. Circ Res. 2014; 114:1565-1571. - PubMed
    1. Giordano FJ, Gerber HP, Williams SP, VanBruggen N, Bunting S, Ruiz‐Lozano P, Gu Y, Nath AK, Huang Y, Hickey R, Dalton N, Peterson KL, Ross J, Chien KR, Ferrara N. A cardiac myocyte vascular endothelial growth factor paracrine pathway is required to maintain cardiac function. Proc Natl Acad Sci USA. 2001; 98:5780-5785. - PMC - PubMed
    1. Izumiya Y, Shiojima I, Sato K, Sawyer DB, Colucci WS, Walsh K. Vascular endothelial growth factor blockade promotes the transition from compensatory cardiac hypertrophy to failure in response to pressure overload. Hypertension. 2006; 47:887-893. - PMC - PubMed

Publication types

MeSH terms