. 2015 May 1;308(9):H1155-70.
doi: 10.1152/ajpheart.00768.2014. Epub 2015 Feb 20.

β-Adrenergic stimulation and rapid pacing mutually promote heterogeneous electrical failure and ventricular fibrillation in the globally ischemic heart

Affiliations

β-Adrenergic stimulation and rapid pacing mutually promote heterogeneous electrical failure and ventricular fibrillation in the globally ischemic heart

Vivek Garg et al. Am J Physiol Heart Circ Physiol. .

Abstract

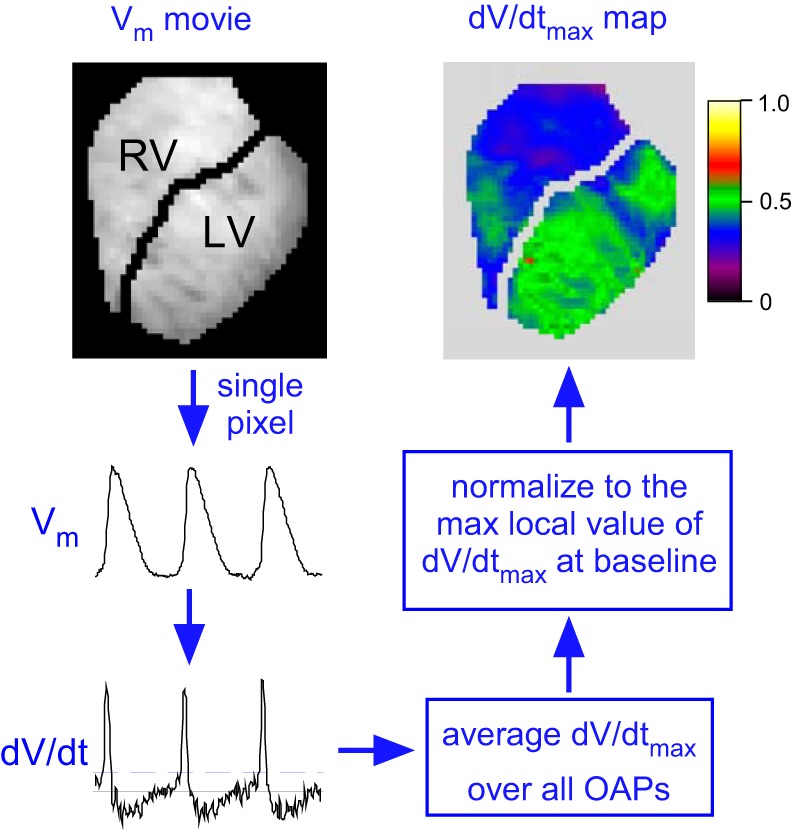
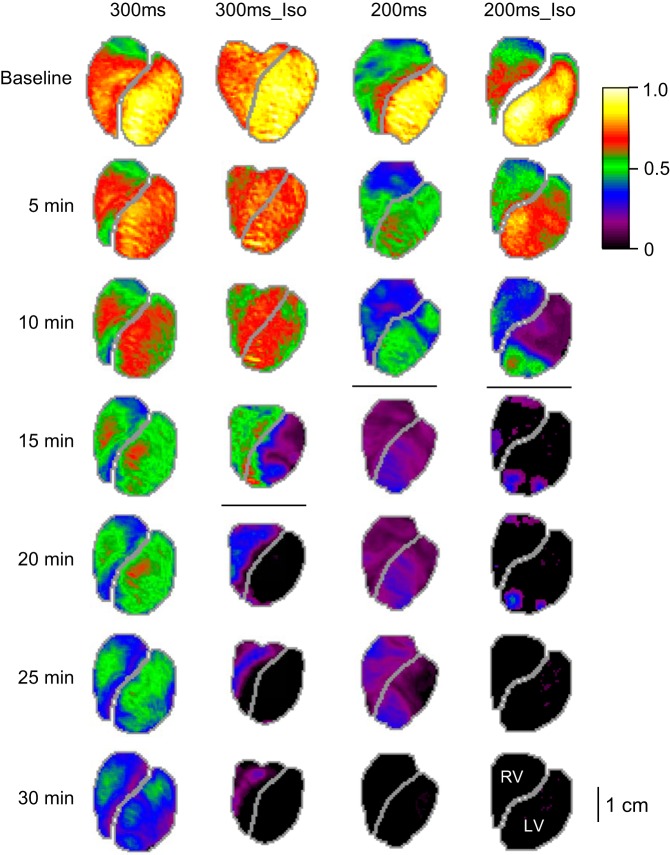
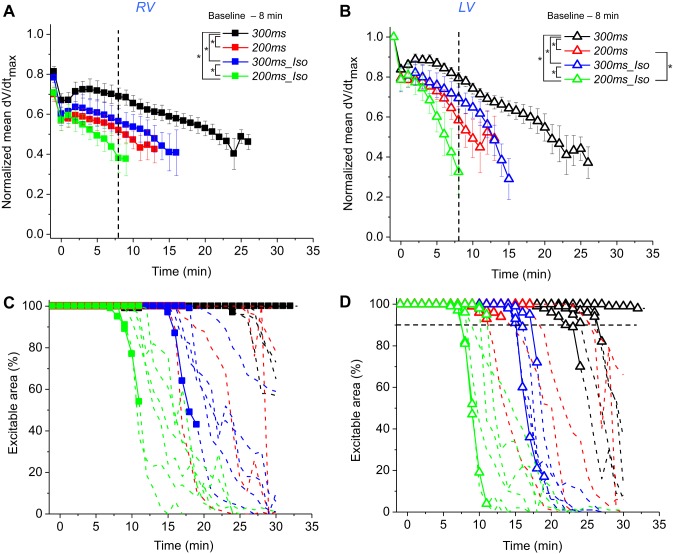
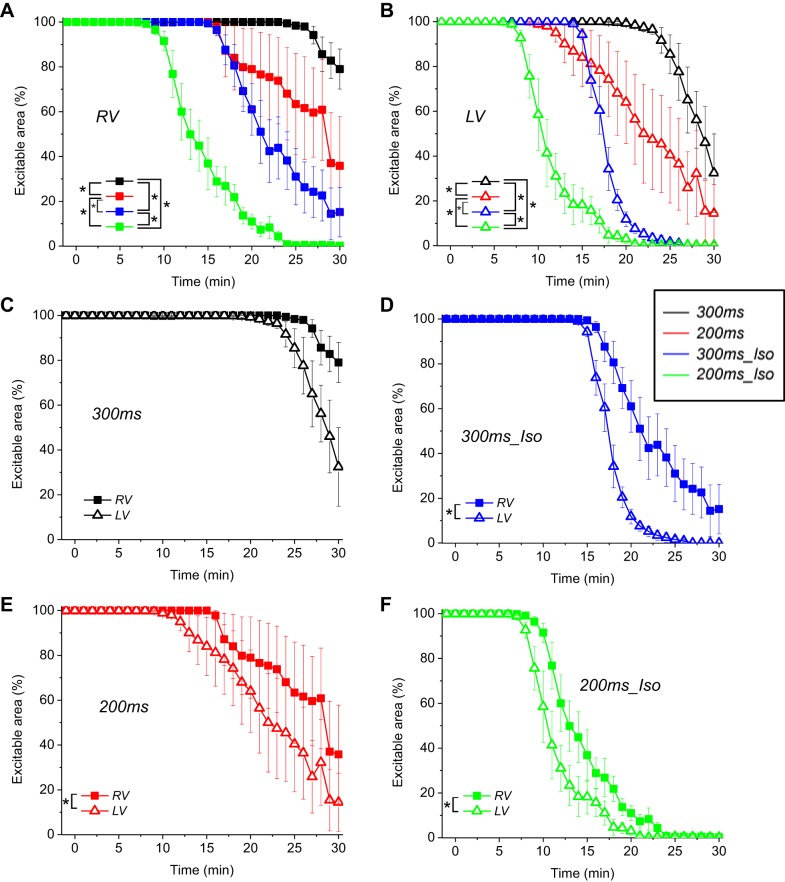
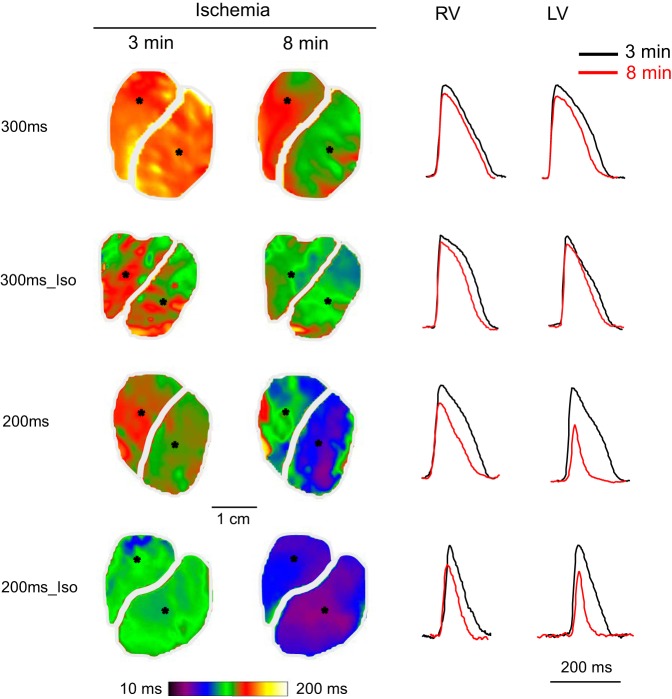
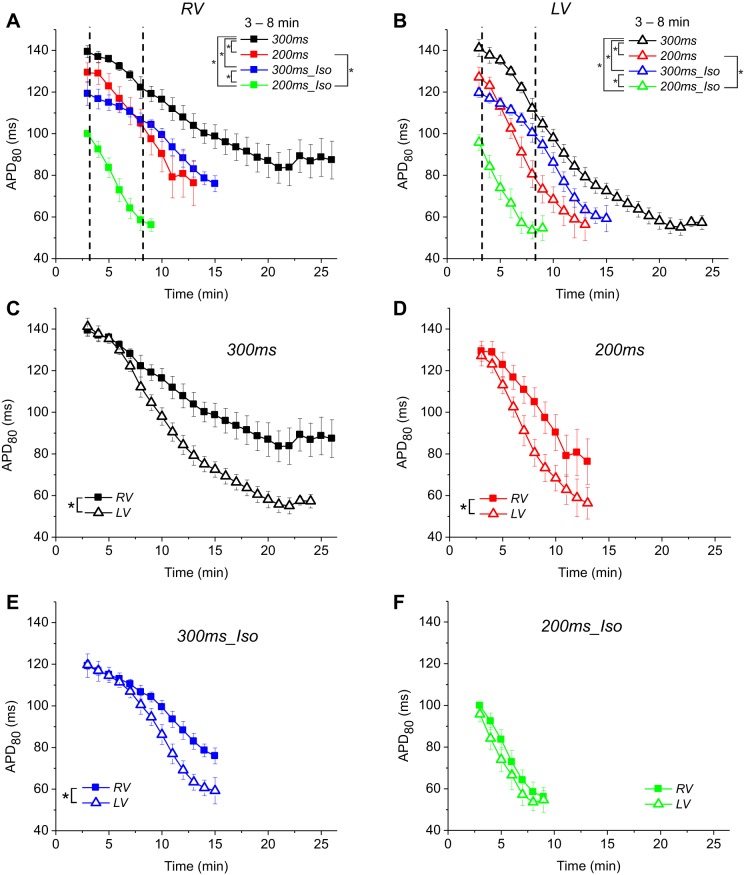
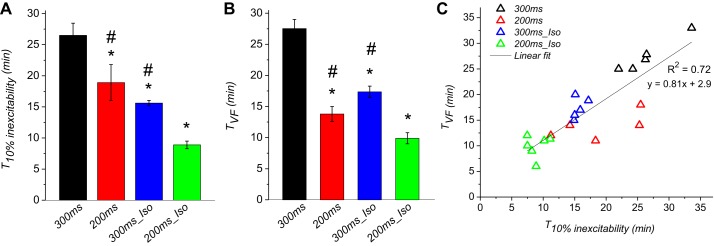
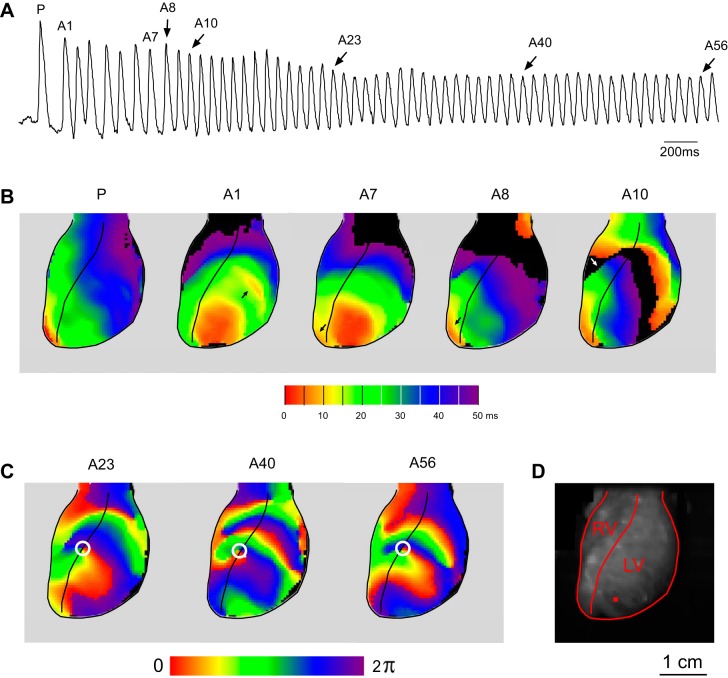
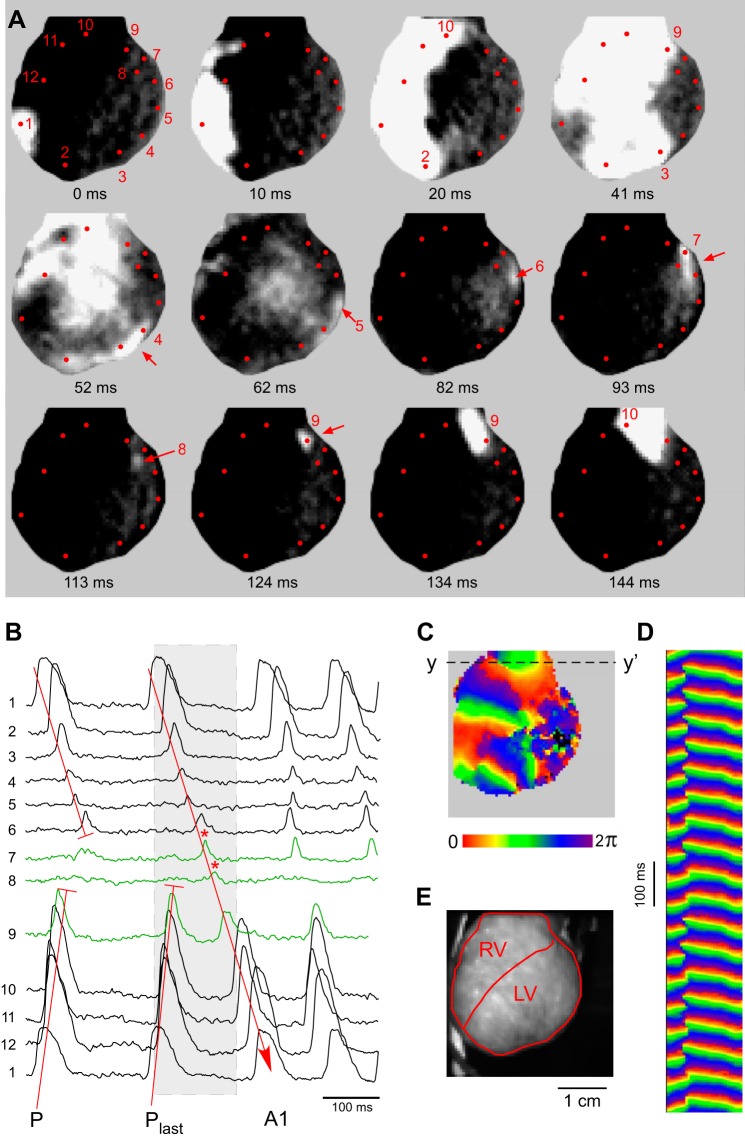
Global ischemia, catecholamine surge, and rapid heart rhythm (RHR) due to ventricular tachycardia or ventricular fibrillation (VF) are the three major factors of sudden cardiac arrest (SCA). Loss of excitability culminating in global electrical failure (asystole) is the major adverse outcome of SCA with increasing prevalence worldwide. The roles of catecholamines and RHR in the electrical failure during SCA remain unclear. We hypothesized that both β-adrenergic stimulation (βAS) and RHR accelerate electrical failure in the globally ischemic heart. We performed optical mapping of the action potential (OAP) in the right ventricular (RV) and left (LV) ventricular epicardium of isolated rabbit hearts subjected to 30-min global ischemia. Hearts were paced at a cycle length of either 300 or 200 ms, and either in the presence or in the absence of β-agonist isoproterenol (30 nM). 2,3-Butanedione monoxime (20 mM) was used to reduce motion artifact. We found that RHR and βAS synergistically accelerated the decline of the OAP upstroke velocity and the progressive expansion of inexcitable regions. Under all conditions, inexcitability developed faster in the LV than in the RV. At the same time, both RHR and βAS shortened the time to VF (TVF) during ischemia. Moreover, the time at which 10% of the mapped LV area became inexcitable strongly correlated with TVF (R(2) = 0 .72, P < 0.0001). We conclude that both βAS and RHR are major factors of electrical depression and failure in the globally ischemic heart and may contribute to adverse outcomes of SCA such as asystole and recurrent/persistent VF.

Keywords: inexcitability; myocardial ischemia; optical mapping; ventricular fibrillation; β-adrenergic stimulation.


Figures

Fig. 1.
Fig. 1.
An overview of the dV/dtmax analysis. The voltage-sensitive fluorescence of di-4-ANEPPS was filtered and inverted yielding representation of the transmembrane potential (Vm). In each pixel, the maximum time derivative of Vm (dV/dtmax) was computed in each action potential. The average value of dV/dtmax over all action potentials was computed for each pixel in 6-s movies. The dV/dtmax values thus obtained were corrected for the background fluorescence (see methods), normalized to the maximum local dV/dtmax in the pre-ischemic movie, and superimposed on the images of the right ventricle (RV) and the left ventricle (LV). Pixels in which the average dV/dtmax values fell below the predefined threshold of detection (twice the level of dV/dt noise in the end-ischemic movies showing no activity) were assigned zero values and were counted as inexcitable. OAP, the optical action potential.
Fig. 2.
Fig. 2.
Representative examples of the progressive decline in dV/dtmax over time of ischemia in 4 tested groups: 300ms, 300ms_Iso, 200ms, and 200ms_Iso (see methods for definitions). Each column represents an experimental group; each row represents a time point in ischemia. The values of dV/dtmax in each pixel are corrected for the background fluorescence and normalized to the maximal value in the baseline map. The horizontal lines in each column indicate the 5-min interval in which ventricular fibrillation (VF) initiation took place. In the 300ms experiment (the leftmost column) VF started at 33 min of ischemia. Note that both the higher pacing frequency (the shorter pacing cycle) and β-adrenergic stimulation with isoproterenol tended to accelerate electrical depression and the onset of VF.
Fig. 3.
Fig. 3.
The effects of increased excitation rate and β-adrenergic stimulation (βAS) on the progressive decline in dV/dtmax and the loss of excitability during ischemia. The data is from 4 groups: 300ms (black), 200ms (red), 300ms_Iso (blue), and 200ms_Iso (green). A and B: the time course of the average dV/dtmax in the RV and the LV, respectively. The data in each experiment are normalized to the maximum local value at the baseline (pre-ischemia). Only those data point are shown at which at least 3 hearts from each group remained in paced rhythm and maintained excitability in at least 80% of the mapped area (see methods). Note that the dV/dtmax decline during ischemia is synergistically promoted by shorter pacing interval and βAS with isoproterenol (30 nM). The vertical dashed line indicates the upper limit of the time window in which statistical comparisons between groups were performed. C and D: percentage of excitable area vs. the duration of ischemia in the RV and LV, respectively. The data from each individual experiments are shown. Solid lines with symbols indicate the time points at which the hearts were in paced rhythm. Dashed lines without symbols indicate the time points at which the hearts were in VF or irregular rhythm. Horizontal dashed line in D indicates 10% inexcitability level in the LV. Note that in the majority of experiments VF initiation coincided with the onset of rapid decline in the percent of the excitable LV area. See text for more detail. *P < 0.05.
Fig. 4.
Fig. 4.
The time course of excitability loss during ischemia. Averaged data from 300ms, 200ms, 300ms_Iso, and 200ms_Iso groups (the same as in Fig. 3, C and D) are shown disregarding the presence or absence of VF. A and B: percentage of the excitable area in the RV and the LV, respectively, is plotted for each group as a function of ischemia time. Note that rapid pacing and βAS - independently and in combination - promote electrical failure during ischemia. CF: RV and the LV curves of excitability loss in individual experimental groups (as indicated) are superimposed to highlight the inter-chamber differences. (The curves are the same as shown in A and B, grouped differently). Note that under all experimental conditions the LV started losing excitability earlier than the RV. *P < 0.05.
Fig. 5.
Fig. 5.
Representative examples of action potential duration at the level of 80% of repolarization (APD80) maps and individual OAPs in 4 groups (300ms, 300ms_Iso, 200ms, and 200ms_Iso) at 3 and 8 min of ischemia. Left: APD80 maps. Right: individual OAPs recorded from the pixels indicated in the respective APD maps. Rows represent experimental groups; columns represent the RV and the LV, respectively; black and red color represent 3 and 8 min of ischemia, respectively. See article for more detail.
Fig. 6.
Fig. 6.
The time course of the progressive APD80 shortening during ischemia. The data are from 4 groups: 300ms (black), 200ms (red), 300ms_Iso (blue), and 200ms_Iso (green). In each experiment, the APD80 values for the RV and the LV were obtained by averaging over all pixels in the respective mapped regions. Note that APD80 measurements were not performed fort the time points before 3 min of ischemia, due to the presence of motion artifact in the optical signals in isoproterenol-treated groups, despite the use of the electromechanical uncoupler BDM. Starting from 3 min of ischemia, the motion artifact was minimal in all groups due to ischemic suppression of contractility. For all time points after 3 min of ischemia, the APD80 data are shown only if at least 3 hearts in a given experimental group remained in regular paced rhythm and maintained excitability in at least 80% of mapped regions in both the RV and the LV. A and B: time course of APD80 decline during ischemia in the RV and the LV, respectively. The comparison between groups in each chamber was performed for the time interval between 3 and 8 min of ischemia. CF: RV and the LV curves of APD80 decline in individual experimental groups (as indicated) are superimposed to highlight the inter-chamber differences. (The curves are the same as shown in A and B, just grouped differently). In each group, the inter-chamber difference in APD80 was analyzed for all time points satisfying the criteria stated above. Note that a prominent right-to-left APD80 gradient developed in all groups except 200ms_Iso. *P < 0.05. See article for more detail.
Fig. 7.
Fig. 7.
VF initiation during ischemia correlates with the emergence of inexcitable regions in the LV. Data are from 4 groups (300ms, 200ms, 300ms_Iso, and 200ms_Iso). A: average time at which 10% of the mapped region in the LV lost excitability (T10% inexcitability). B: average VF initiation time (TVF). C: TVF plotted vs. T10% inexcitability. (the same data as in A and B). *P < 0.05 vs. 300ms; #P < 0.05 vs. 200ms_Iso.
Fig. 8.
Fig. 8.
A typical case of VF initiation during ischemia with the first beat of VF appearing as an epicardial breakthrough (see Supplemental Movie S1). A: a recording from a single pixel whose position is marked with a red square in D. The last paced beat (P) and selected arrhythmic beats (A1, A7, A8, A10, A23, A40, A56) are labeled above the recording. B: activation maps for selected beats indicated in A. Red indicates the earliest activation; magenta, the latest. All activation maps are limited to the first 50 ms in the optically mapped region. C: phase maps obtained using Hilbert Transform for selected beats indicated in A. A stable spiral wave with the center of rotation (white circle) anchored on the RV/LV junction was first seen during beat A23 and maintained its position for at least next 23 cycles. D: image of the heart showing the mapped RV and LV regions and the position of the pixel used to generate optical signal shown in A. See article for more detail.
Fig. 9.
Fig. 9.
A case of VF initiation during ischemia by epicardial reentry involving inexcitable and poorly excitable regions (see Supplemental Movie S6). A: selected single frame snapshots taken during the formation of the first reentrant circuit. The contrast in the snapshots is greatly increased to highlight OAPs with low amplitude. Red dots with numbers indicate the locations of selected pixels. B: single pixel recordings from the numbered pixels shown in A. Gray rectangle indicates the time window encompassing the snapshots shown in A. P, a regular paced beat, represents the relatively constant activation pattern before VF initiation. Plast, the last paced wavefront giving rise to reentry; A1, the first nonpaced beat. Recordings from the sites critical for the formation of unidirectional block (pixels nos. 7–9) are shown in green. T-shaped red lines indicate the sites of conduction block. Red line with arrowhead indicates the full reentrant circuit initiating VF. C: a phase map during the stable phase of VF. D: time-space plot along the line y-y′ shows the characteristic “Christmas tree” pattern, indicating a stable spiral wave source in the basal RV. E: image of the heart demarcating the mapped regions in the RV and the LV. See article for more detail.

Comment in

References

    1. Akar FG, Aon MA, Tomaselli GF, O′Rourke B. The mitochondrial origin of postischemic arrhythmias. J Clin Invest 115: 3527–3535, 2005. - PMC - PubMed
    1. Aupetit JF, Frassati D, Bui-Xuan B, Freysz M, Faucon G, Timour Q. Efficacy of a β-adrenergic receptor antagonist, propranolol, in preventing ischaemic ventricular fibrillation: dependence on heart rate and ischaemia duration. Cardiovasc Res 37: 646–655, 1998. - PubMed
    1. Aupetit JF, Timour Q, Freysz M, Loufoua-Moundanga J, Omar S, Chevrel G, Faucon G. Vulnerability to ventricular fibrillation related to ischaemia: comparison of the acute effects of beta-blockers and calcium antagonists. Arch Int Pharmacodyn Ther 327: 25–39, 1994. - PubMed
    1. Bayes de Luna A, Elosua R. Sudden death. Rev Esp Cardiol 65: 1039–1052, 2012. - PubMed
    1. Blake K, Clusin WT, Franz MR, Smith NA. Mechanism of depolarization in the ischaemic dog heart: discrepancy between T-Q potentials and potassium accumulation. J Physiol 397: 307–330, 1988. - PMC - PubMed

Publication types

MeSH terms

LinkOut - more resources