. 2015 Mar 10;112(10):3050-5.
doi: 10.1073/pnas.1500475112. Epub 2015 Feb 23.

Initial viral load determines the magnitude of the human CD8 T cell response to yellow fever vaccination

Affiliations

Initial viral load determines the magnitude of the human CD8 T cell response to yellow fever vaccination

Rama S Akondy et al. Proc Natl Acad Sci U S A. .

Abstract

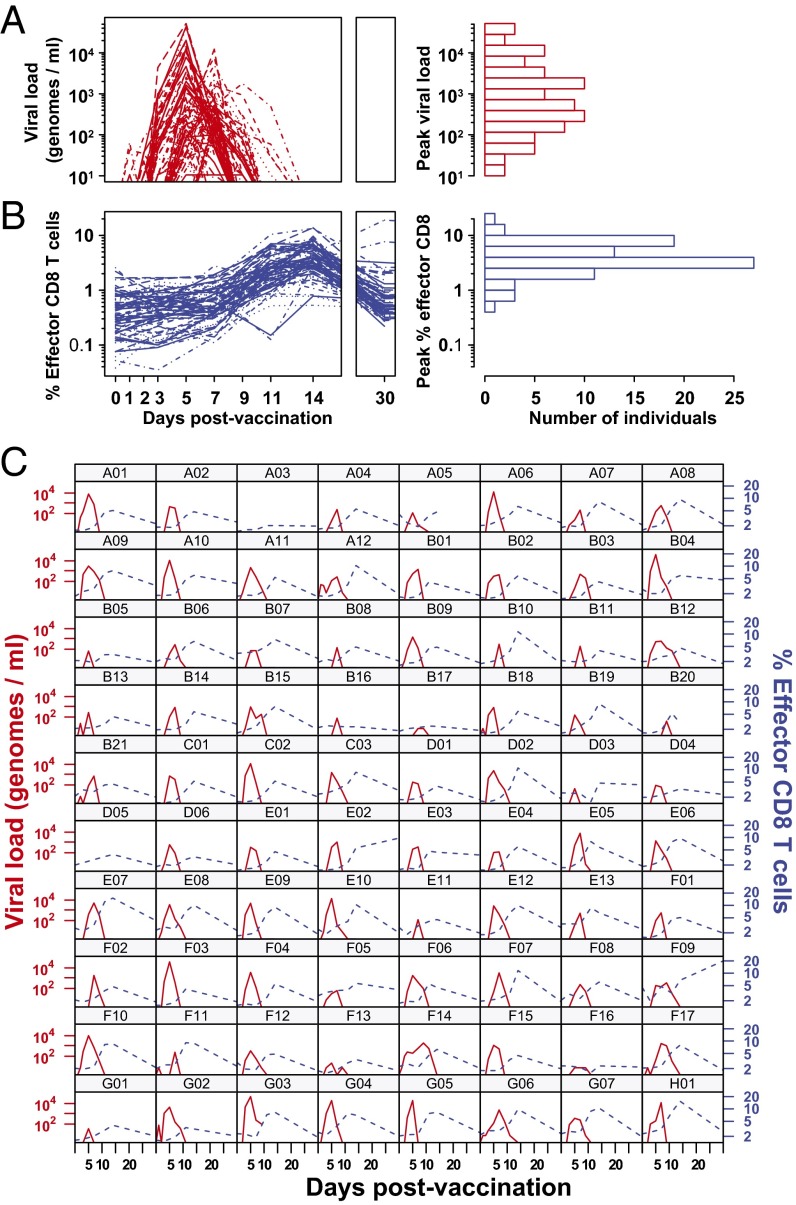
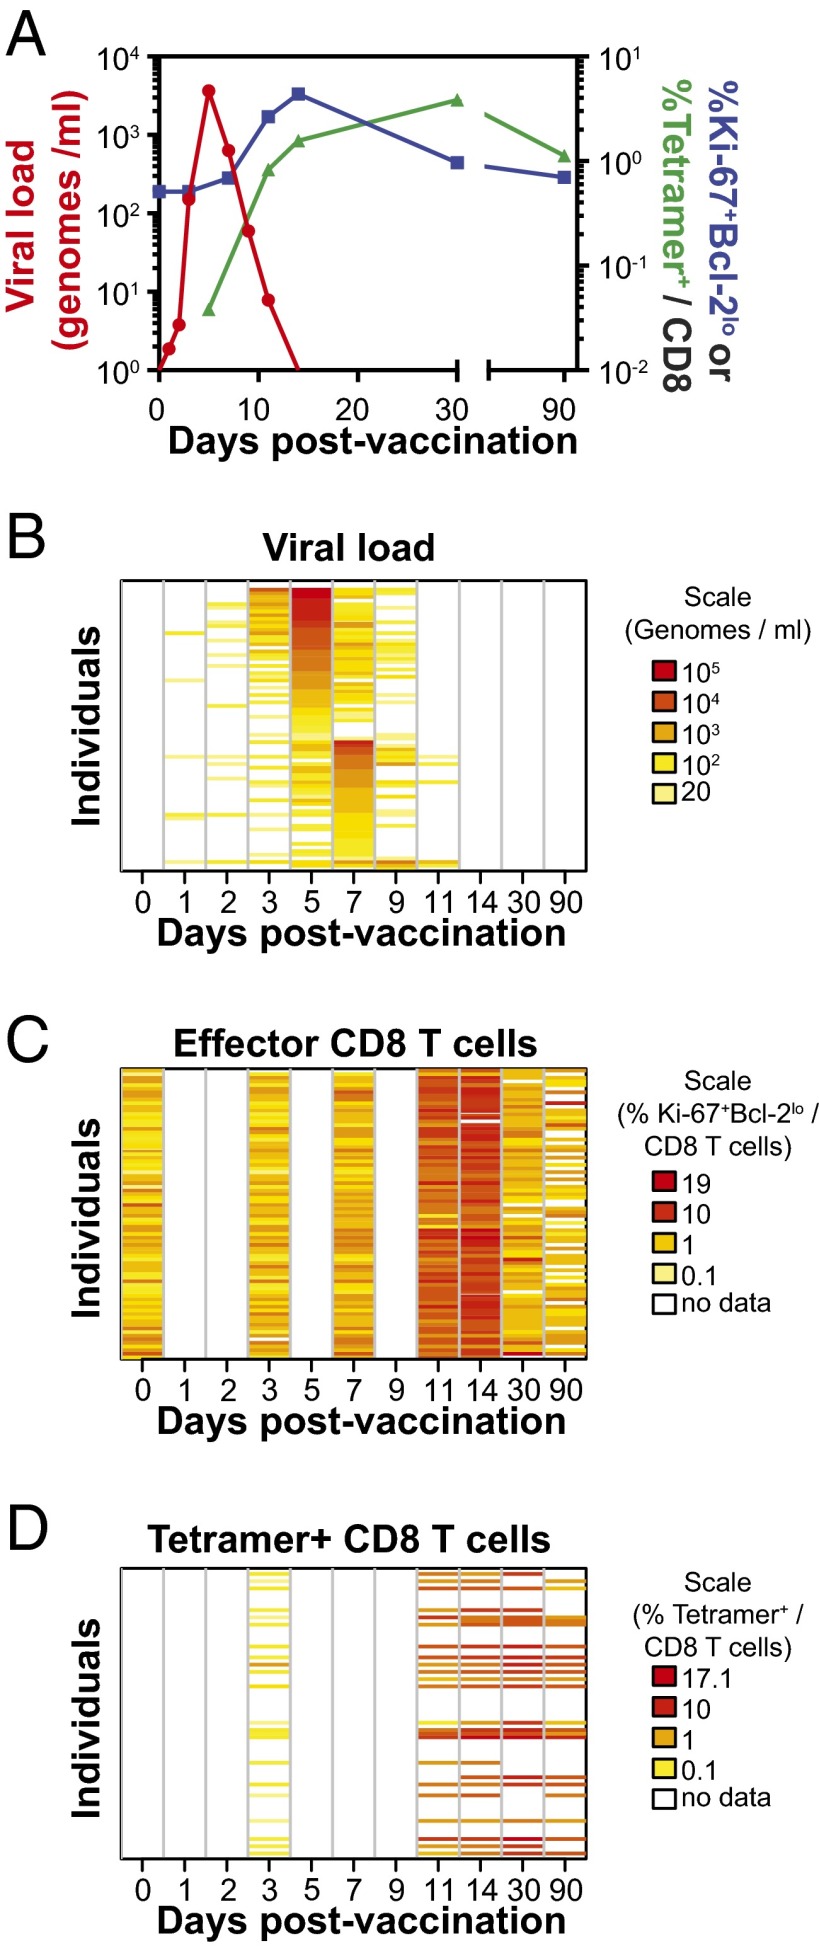
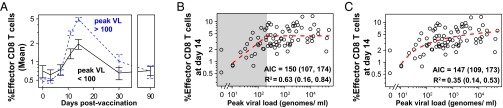
CD8 T cells are a potent tool for eliminating intracellular pathogens and tumor cells. Thus, eliciting robust CD8 T-cell immunity is the basis for many vaccines under development. However, the relationship between antigen load and the magnitude of the CD8 T-cell response is not well-described in a human immune response. Here we address this issue by quantifying viral load and the CD8 T-cell response in a cohort of 80 individuals immunized with the live attenuated yellow fever vaccine (YFV-17D) by sampling peripheral blood at days 0, 1, 2, 3, 5, 7, 9, 11, 14, 30, and 90. When the virus load was below a threshold (peak virus load < 225 genomes per mL, or integrated virus load < 400 genome days per mL), the magnitude of the CD8 T-cell response correlated strongly with the virus load (R(2) ∼ 0.63). As the virus load increased above this threshold, the magnitude of the CD8 T-cell responses saturated. Recent advances in CD8 T-cell-based vaccines have focused on replication-incompetent or single-cycle vectors. However, these approaches deliver relatively limited amounts of antigen after immunization. Our results highlight the requirement that T-cell-based vaccines should deliver sufficient antigen during the initial period of the immune response to elicit a large number of CD8 T cells that may be needed for protection.

Keywords: effector T cells; human CD8 T cells; immune memory; vaccines; viral load.


Conflict of interest statement

The authors declare no conflict of interest.

Figures

Fig. 1.
Fig. 1.
Dynamics of viral load and CD8 T-cell response after vaccination with YFV-17D. (A) YFV-17D viral genomes measured by qRT-PCR and (B) YFV-specific effector CD8 T cells as measured by Ki-67+Bcl-2lo for each of 80 vaccinees. Blood samples were drawn on days 0, 1, 2, 3, 5, 7, 9, 11, 14, and 30. (Right) The distribution of peak magnitudes of virus and responding CD8 cells among the vaccinees. We see that there is approximately a four-log spread in the peak viral load and a two-log spread in the peak CD8+ T-cell response between different individuals. (C) Individual kinetics of the viral load (red lines, left axis) and CD8 effector cells (blue lines, right axis) for each vaccinee. In all cases, the CD8 response peaks after virus.
Fig. 2.
Fig. 2.
Summary dynamics of viral load and CD8 T-cell response. (A) Mean kinetics of virus (red) and YFV-specific CD8 cells measured by Ki-67+Bcl-2lo (blue) and by the NS4B214 tetramer (green). Virus peaks first, followed by Ki-67+ CD8 T cells, and finally tetramer+ CD8 T cells. (BD) Individual-level kinetics of virus, Ki-67+ responses, and tetramer+ responses shown as heat maps. Each row corresponds to kinetics in one of the 80 individuals. Individuals were ordered first by day at which virus peaked and then by magnitude of that peak. As can been seen in B, individuals in the top half of the plot had peak virus on day 5, and in the bottom half, most individuals had peak virus on day 7. The Ki-67 kinetics in C and tetramer kinetics in D show no link between timing of peak virus and the CD8 T-cell response (see also Fig. S2).
Fig. 3.
Fig. 3.
Transcriptional profiling of PBMCs is sensitive and reveals enrichment of effector T-cell genes. (A) We performed transcriptional profiling of PBMCs obtained from vaccinees before and days 3 and 7 after vaccination. Genes whose absolute level of expression correlates positively (red) or negatively (blue) with viral load on the day of PBMC sampling are shown as a heat map. The viral load corresponding to each transcriptional profile is shown as a bar graph above the heat map. (B) The transcriptional profiles of YFV-specific effector CD8 T cells or prevaccination naive CD8 T cells were tested for enrichment among the genes that were associated with viral load from A. The GSEA plots are shown. (C) Expression profiles of various published immune cell subsets were tested for enrichment among the viral load associated genes. Normalized enrichment score for most significantly associated gene sets is shown.
Fig. 4.
Fig. 4.
The magnitude of the YFV-effector CD8 T-cell correlates with viral burden. (A) The kinetics for the mean % Ki-67+Bcl-2lo CD8 T cells are dramatically different between vaccinees grouped by high (>100 genomes per mL, dashed blue line) or low (<100 genomes per mL, solid black line) viral load. The former shows significantly more responding T cells than the latter. Error bars show SEM. (B and C) The effector CD8 T-cell response (% Ki-67+Bcl-2lo of CD8 T cells) at day 14 correlates with the peak viral load. (B) We plot (dashed red line) the best fit of a piecewise-linear function (linear up to a threshold, constant above the threshold; Methods) relating the viral load and CD8 T-cell response. When viral load is below a threshold value of ∼225 genome/mL (shaded in gray), viral load strongly predicts the magnitude of the CD8 T-cell response (R2 = 0.68 with a 95% bootstrap confidence interval of 0.16–0.87); when viral load is above this value, the CD8 T-cell response saturates. (C) We show a similar result if we use a smooth saturating function in place of the piecewise-linear function. In both B and C we see that the magnitude of the CD8 response increases with viral load, rapidly at first and then saturating at high viral loads. Both piecewise and smooth saturating models fit equally well based on AIC values.

References

    1. Harrer T, et al. Strong cytotoxic T cell and weak neutralizing antibody responses in a subset of persons with stable nonprogressing HIV type 1 infection. AIDS Res Hum Retroviruses. 1996;12(7):585–592. - PubMed
    1. Pereyra F, et al. Genetic and immunologic heterogeneity among persons who control HIV infection in the absence of therapy. J Infect Dis. 2008;197(4):563–571. - PubMed
    1. Kiepiela P, et al. CD8+ T-cell responses to different HIV proteins have discordant associations with viral load. Nat Med. 2007;13(1):46–53. - PubMed
    1. Schmidt NW, et al. Memory CD8 T cell responses exceeding a large but definable threshold provide long-term immunity to malaria. Proc Natl Acad Sci USA. 2008;105(37):14017–14022. - PMC - PubMed
    1. Chen CY, et al. A critical role for CD8 T cells in a nonhuman primate model of tuberculosis. PLoS Pathog. 2009;5(4):e1000392. - PMC - PubMed

Publication types

MeSH terms

Substances