. 2015 Mar 10;112(10):E1086-95.
doi: 10.1073/pnas.1413990112. Epub 2015 Feb 23.

Histone titration against the genome sets the DNA-to-cytoplasm threshold for the Xenopus midblastula transition

Affiliations

Histone titration against the genome sets the DNA-to-cytoplasm threshold for the Xenopus midblastula transition

Amanda A Amodeo et al. Proc Natl Acad Sci U S A. .

Abstract

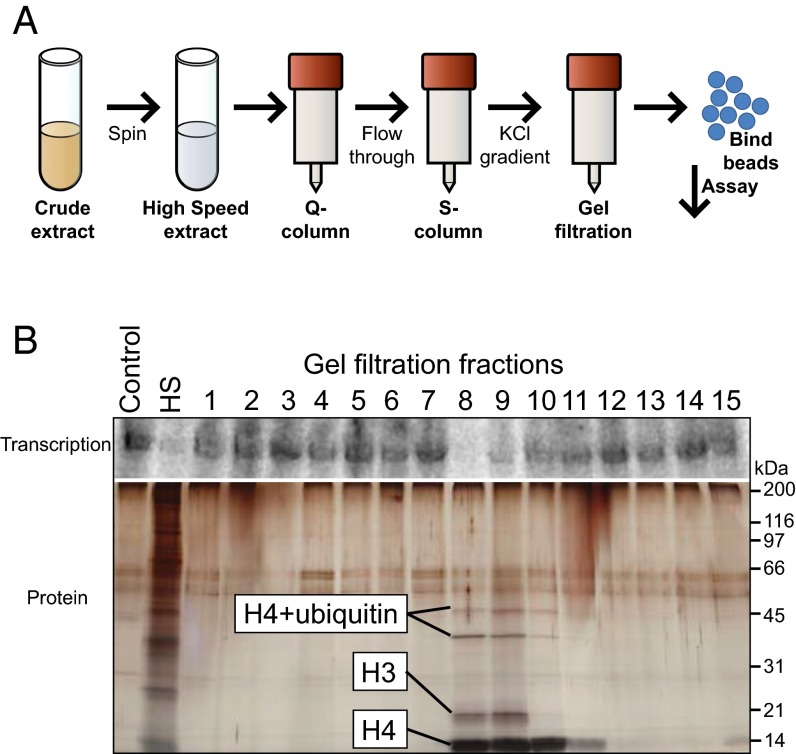
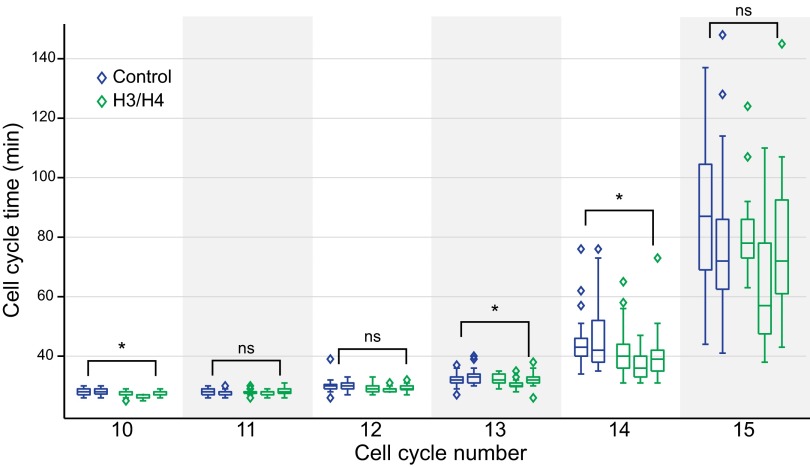
During early development, animal embryos depend on maternally deposited RNA until zygotic genes become transcriptionally active. Before this maternal-to-zygotic transition, many species execute rapid and synchronous cell divisions without growth phases or cell cycle checkpoints. The coordinated onset of transcription, cell cycle lengthening, and cell cycle checkpoints comprise the midblastula transition (MBT). A long-standing model in the frog, Xenopus laevis, posits that MBT timing is controlled by a maternally loaded inhibitory factor that is titrated against the exponentially increasing amount of DNA. To identify MBT regulators, we developed an assay using Xenopus egg extract that recapitulates the activation of transcription only above the DNA-to-cytoplasm ratio found in embryos at the MBT. We used this system to biochemically purify factors responsible for inhibiting transcription below the threshold DNA-to-cytoplasm ratio. This unbiased approach identified histones H3 and H4 as concentration-dependent inhibitory factors. Addition or depletion of H3/H4 from the extract quantitatively shifted the amount of DNA required for transcriptional activation in vitro. Moreover, reduction of H3 protein in embryos induced premature transcriptional activation and cell cycle lengthening, and the addition of H3/H4 shortened post-MBT cell cycles. Our observations support a model for MBT regulation by DNA-based titration and suggest that depletion of free histones regulates the MBT. More broadly, our work shows how a constant concentration DNA binding molecule can effectively measure the amount of cytoplasm per genome to coordinate division, growth, and development.

Keywords: cell size control; early vertebrate development; maternal zygotic transition; systems biology; transcription activation.


Conflict of interest statement

The authors declare no conflict of interest.

Figures

Fig. 1.
Fig. 1.
In vitro transcription is sensitive to the DNA-to-cytoplasm ratio. (A) Experimental design for B and C. Variable quantities of sperm chromatin are added to a constant volume of extract. (B) A representative autoradiograph showing transcription above a threshold DNA concentration (50 ng DNA per 1 µL extract). Transcription was quantified using the indicated boxed band corresponding to the Pol III transcript OAX (in the text and SI Appendix, Figs. S2 and S3). (C) Semilog plot of mean transcriptional response to increasing amounts of sperm chromatin shows transcription at or above 50 ng sperm DNA per 1 µL extract. (D) Semilog plot of titration of λ-phage DNA into egg extract that activates transcription from reporter sperm chromatin (present at ∼15 ng/µL) at a similar DNA concentration as in C.
Fig. 2.
Fig. 2.
A titratable factor inhibits transcription in Xenopus egg extract. (A and C) Schematics of experiments corresponding to B and D, respectively. DNA beads are used to bind, deplete, and transfer the inhibitory activity in egg extracts. (B) Extracts depleted of a transcriptional inhibitor with DNA-coated beads (purple curve) activate transcription at a lower sperm concentration than extracts exposed to beads not coupled to DNA (green curve). (D) DNA-coated beads preincubated in an extract are unable to induce transcription in a naïve extract (orange curve) compared with DNA beads preincubated with buffer (green curve). Transcription is measured from reporter sperm chromatin (present at 15 ng/µL). All error bars represent SEM.
Fig. 3.
Fig. 3.
Isolation of histones H3 and H4 as the inhibitory factor. (A) Schematic of the final purification protocol resulting in the gels shown in B. (B, Upper) Autoradiograph of the transcriptional inhibition activity of control (buffer), high-speed (HS) extract, and individual fractions from the final-size exclusion step of the purification. Fractions 8 and 9 show inhibitory activity. (B, Lower) Silver stain gel of the proteins bound to the beads in each fraction. A more detailed description of the purification can be found in Materials and Methods and SI Appendix, Fig. S5.
Fig. 4.
Fig. 4.
H3 and H4 concentrations are constant relative to tubulin before the MBT. Normalized histones (A) H3 and (B) H4 protein levels are constant through the MBT. Both proteins are normalized to tubulin and an extract control. For each time point, n = 3; error bars represent SEM.
Fig. 5.
Fig. 5.
H3/H4 tetramers set the threshold for transcriptional activation in extract. (A) Increasing the levels of histones H3 and H4 in egg extracts increases the concentration of sperm chromatin required to induce transcription. H3/H4 addition resulted in total concentrations equal to 1×, 1.6×, 2.1×, and 2.8× the untreated extract as measured using a Western blot for H3. (B) The concentration of DNA required for transcriptional activation (defined as the first point above 1.5× background) scales roughly linearly with histone concentration for both sperm chromatin (blue circles) and λ-phage DNA (red diamonds). Each point represents a titration as depicted in A. Points above the dashed line had thresholds beyond the detection limit. (C) Depletion of histones H3/H4 with DNA beads reduces the amount of DNA required to activate transcription (purple curve) compared with the control (green curve), and adding back H3 and H4 restores the transcriptional inhibition below the control threshold (blue curve). Dep, depleted. (D) Relationship between histone concentration and the amount of DNA required for transcriptional activation as described in B for the add-back experiments depicted in C. Histone H3 concentrations were quantified by Western blot.
Fig. 6.
Fig. 6.
Reduction of histone H3 causes premature initiation of the MBT in vivo. (A) H3 morphant embryos (red) have increased transcription at earlier time points compared with controls (blue) as measured by the total 32P-UTP incorporation in microinjected embryos (SI Appendix, Fig. S8). (B) The cumulative effect of longer cell cycles results in larger cells and therefore, lower cell density in the H3 morphant embryos (H3 MOs) compared with control-injected embryos (Control). Data are shown for 215 min after the ninth division (n = 3 embryos). (C) H3 morphant embryos appear normal until near the MBT, when they display increased cell cycle lengthening and larger cells compared with controls. The location of the zoomed panels is marked by the black boxes. (D) H3 morphant embryos die at gastrulation. (E) H3 morphant embryos display early cell cycle lengthening compared with control embryos. Cell cycle duration lengthens one cycle early in H3 morphant embryos compared with control morpholino. Circles represent embryos that did not reach a 15th division before the movie limit. All data are shown for >15 cells per embryo; there are three control embryos and four H3 morphant embryos from the same clutch. Division times were manually annotated from movies with a 1-min frame rate (Materials and Methods). The box height represents the 25th to 75th percentiles, and the centerline represents the median. The whiskers extend to the farthest data point that is not an outlier. Outliers are plotted as diamonds. Results from two similar experiments are shown in SI Appendix, Fig. S9. Div, division; ns, P value > 0.01 between H3 morphant and control embryos in consecutive cell cycles. *P values < 0.01 between H3 morphant and control embryos in the same cell cycle.
Fig. 7.
Fig. 7.
Increasing H3 and H4 shortens early post-MBT cell cycles. Injection increased H3 concentration by ∼25% as measured 7.5 h postfertilization. Time-lapse movies were analyzed and are presented as in Fig. 6E. Results from two additional H3/H4 injection experiments are shown in SI Appendix, Fig. S11. ns, P value > 0.01, and *P values < 0.01 between H3 morphant and control embryos in the same cell cycle.
Fig. 8.
Fig. 8.
Model of histone titration measuring the DNA-to-cytoplasm ratio up to the MBT. Schematic showing titration of histones, which are at constant concentration in the early embryo, against the exponentially increasing amount of DNA.

References

    1. Newport J, Kirschner M. A major developmental transition in early Xenopus embryos: II. Control of the onset of transcription. Cell. 1982;30(3):687–696. - PubMed
    1. Newport J, Kirschner M. A major developmental transition in early Xenopus embryos: I. Characterization and timing of cellular changes at the midblastula stage. Cell. 1982;30(3):675–686. - PubMed
    1. Di Talia S, et al. Posttranslational control of Cdc25 degradation terminates Drosophila’s early cell-cycle program. Curr Biol. 2013;23(2):127–132. - PMC - PubMed
    1. Farrell JA, O’Farrell PH. Mechanism and regulation of Cdc25/Twine protein destruction in embryonic cell-cycle remodeling. Curr Biol. 2013;23(2):118–126. - PMC - PubMed
    1. Farrell JA, Shermoen AW, Yuan K, O’Farrell PH. Embryonic onset of late replication requires Cdc25 down-regulation. Genes Dev. 2012;26(7):714–725. - PMC - PubMed

Publication types