. 2015 Mar 10;112(10):3020-5.
doi: 10.1073/pnas.1412887112. Epub 2015 Feb 23.

Climate-driven introduction of the Black Death and successive plague reintroductions into Europe

Affiliations

Climate-driven introduction of the Black Death and successive plague reintroductions into Europe

Boris V Schmid et al. Proc Natl Acad Sci U S A. .

Abstract

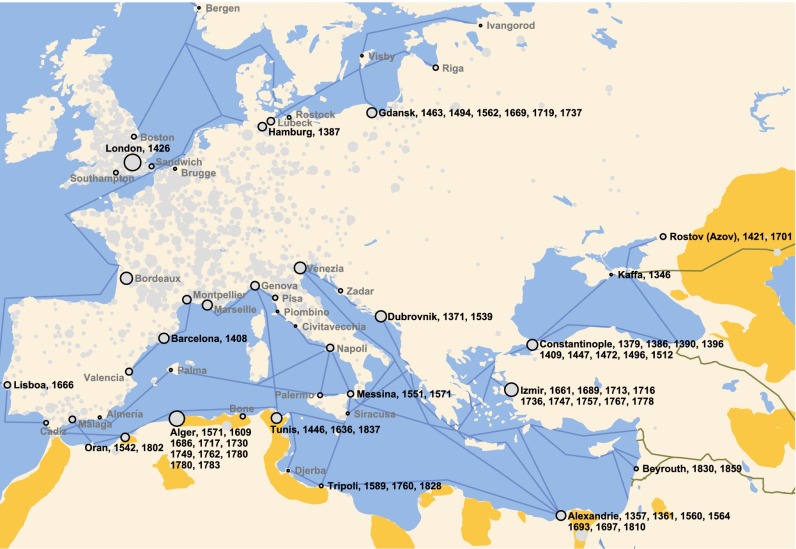
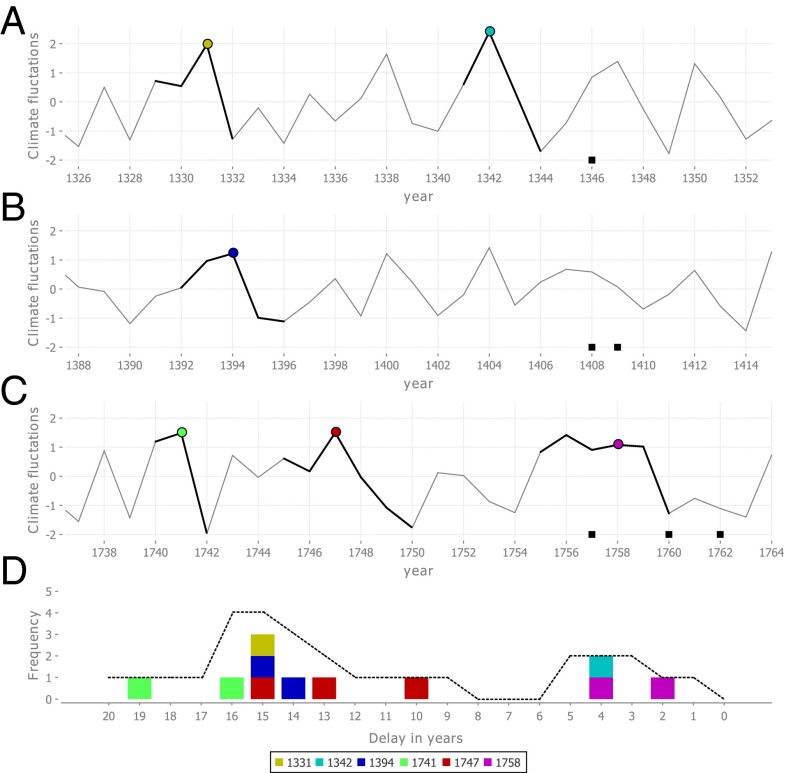
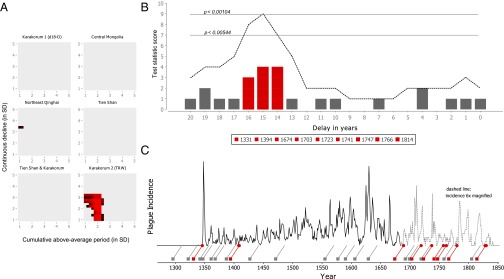
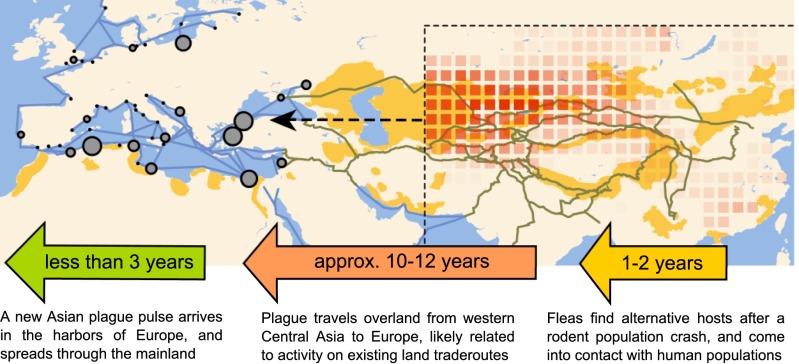
The Black Death, originating in Asia, arrived in the Mediterranean harbors of Europe in 1347 CE, via the land and sea trade routes of the ancient Silk Road system. This epidemic marked the start of the second plague pandemic, which lasted in Europe until the early 19th century. This pandemic is generally understood as the consequence of a singular introduction of Yersinia pestis, after which the disease established itself in European rodents over four centuries. To locate these putative plague reservoirs, we studied the climate fluctuations that preceded regional plague epidemics, based on a dataset of 7,711 georeferenced historical plague outbreaks and 15 annually resolved tree-ring records from Europe and Asia. We provide evidence for repeated climate-driven reintroductions of the bacterium into European harbors from reservoirs in Asia, with a delay of 15 ± 1 y. Our analysis finds no support for the existence of permanent plague reservoirs in medieval Europe.

Keywords: Yersinia pestis; climate-driven disease dynamics; medieval epidemiology.


Conflict of interest statement

The authors declare no conflict of interest.

Figures

Fig. 1.
Fig. 1.
Plague outbreaks in maritime harbors of Europe not related to nearby land-based or maritime harbor outbreaks. Plague outbreaks in the important harbors of medieval Europe (black circles) that were not preceded by land-based outbreaks in a radius of <500 km or maritime harbor outbreaks in harbors <1,000 km away in the 2 y prior are shown. The gray circles in the backdrop show the spatial extent of the entire plague dataset, with the circle size indicating the recorded number of plague outbreaks per city over four centuries. Maritime trade routes are indicated as blue lines, land-based trade routes connecting Europe to Asia are indicated as brown lines, and the locations of modern wildlife plague foci are indicated in orange.
Fig. 2.
Fig. 2.
Example of climate fluctuations, climate events, and the calculation of the permutation test statistic. (AC) Karakorum TRW climate proxy, highlighting in bold those climate fluctuations of an above-average period of ≥2.2 SDs, and a continuous decline of ≥1.4 SD, in the years before six potential plague reintroductions into Europe (▪). These climate fluctuations are translated to discrete single-year climate events by the start of their continuous decline (colored circles). (D) Plotting all of the possible intervals (≤20 y) between the six climate events and the six potential reintroduction years in AC in a single histogram shows the most common interval between climate events and plague reintroduction years, which, in this case, is 15 y (three occurrences). To allow for some variation in the time it takes for plague to travel from Asia to Europe, the unique number of climate events that occurred at a particular delay ±1 y is calculated (dashed line). The permutation test statistic is then the highest value that the dashed line reaches. In this example, the test statistic score is therefore 4 (consisting of the years 1331, 1394, 1741, and 1747), which is reached both for a delay of 15 ± 1 y and 16 ± 1 y.
Fig. 3.
Fig. 3.
Climate events in the Karakorum 2 (TRW) tree-ring record preceded European plague reintroductions by 15 ± 1 y. (A) Only the TRW record of the Karakorum mountain range results has climate fluctuations that result in significant (P < 0.05) permutation test scores for a large range of above-average periods and continuous declines tested (1–5 SDs). Colors represent the degree of significance, ranging from P < 0.05 (black) to P < 0.0005 (brightest red). (B) The threshold combination for which most reintroduction years were associated with climate events for a particular delay ±1 y is at a cumulative above-average period of ≥2.2 SD and a decline ≥1.4 SD (P < 0.00104): 11 of the reintroduction years were preceded by climate events at 15 ± 1 y. The plague reintroduction years in 1408 and 1409 map back to a single climate event in 1394, and the plague reintroduction years in 1828 and 1830 map back to a single climate event in 1814, thus reducing the 11 reintroductions to nine unique climate events. The dashed line indicates the permutation test statistic score (i.e., the number of unique climate events at a particular delay ± 1 y), and the two horizontal lines indicate P values associated with test statistic scores of 7 and 9, respectively. (C) Temporal distribution of these climate events during the second pandemic (squares, red when one of the nine climate events listed in B) and their relation to the plague incidence in Europe 15 y later (slanted lines).
Fig. 4.
Fig. 4.
Schematic of the process of plague reintroductions into Europe. A new reintroduction of plague consists of three stages, namely, a rodent population crash (1–2 y) after the onset of the decline in climatic conditions, transport of the disease to Europe (10–12 y), and the spread of the disease through the European maritime trade network (<3 y). The average spatial extents of the nine climate fluctuations that were found to correlate with plague reintroductions in Europe are shown as red squares, showing the difference in the Monsoon Asia Drought Atlas (26) between the onset of the decline in the climate fluctuation and 2 y later. Also shown are the relevant trade routes (brown and blue lines), known wildlife plague reservoirs (orange), and the European harbors associated with new maritime introductions of plague (gray circles).

References

    1. Haensch S, et al. Distinct clones of Yersinia pestis caused the black death. PLoS Pathog. 2010;6(10):e1001134. - PMC - PubMed
    1. Harbeck M, et al. Yersinia pestis DNA from skeletal remains from the 6(th) century AD reveals insights into Justinianic Plague. PLoS Pathog. 2013;9(5):e1003349. - PMC - PubMed
    1. Stenseth NC, et al. Plague: Past, present, and future. PLoS Med. 2008;5(1):e3. - PMC - PubMed
    1. Ell SR. Immunity as a factor in the epidemiology of medieval plague. Rev Infect Dis. 1984;6(6):866–879. - PubMed
    1. Davis DE. The scarcity of rats and the Black Death: An ecological history. J Interdiscip Hist. 1986;16(3):455–470.

Publication types

LinkOut - more resources