. 2015 Feb 10:9:28.
doi: 10.3389/fnins.2015.00028. eCollection 2015.

Quantitative analysis of axonal fiber activation evoked by deep brain stimulation via activation density heat maps

Affiliations

Quantitative analysis of axonal fiber activation evoked by deep brain stimulation via activation density heat maps

Christian J Hartmann et al. Front Neurosci. .

Abstract

Background: Cortical modulation is likely to be involved in the various therapeutic effects of deep brain stimulation (DBS). However, it is currently difficult to predict the changes of cortical modulation during clinical adjustment of DBS. Therefore, we present a novel quantitative approach to estimate anatomical regions of DBS-evoked cortical modulation.

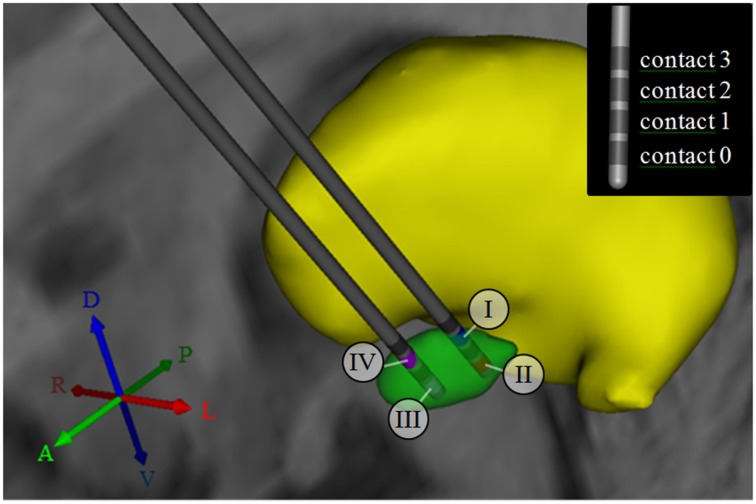
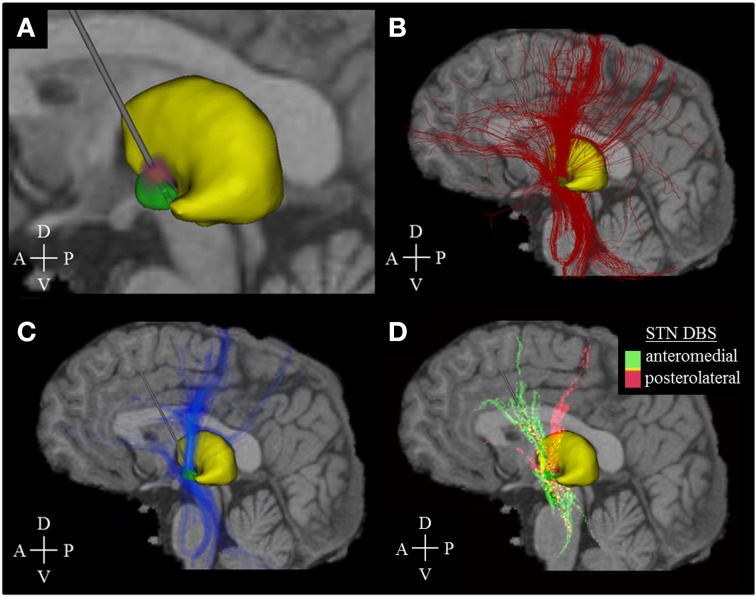
Methods: Four different models of the subthalamic nucleus (STN) DBS were created to represent variable electrode placements (model I: dorsal border of the posterolateral STN; model II: central posterolateral STN; model III: central anteromedial STN; model IV: dorsal border of the anteromedial STN). Axonal fibers of passage near each electrode location were reconstructed using probabilistic tractography and modeled using multi-compartment cable models. Stimulation-evoked activation of local axon fibers and corresponding cortical projections were modeled and quantified.

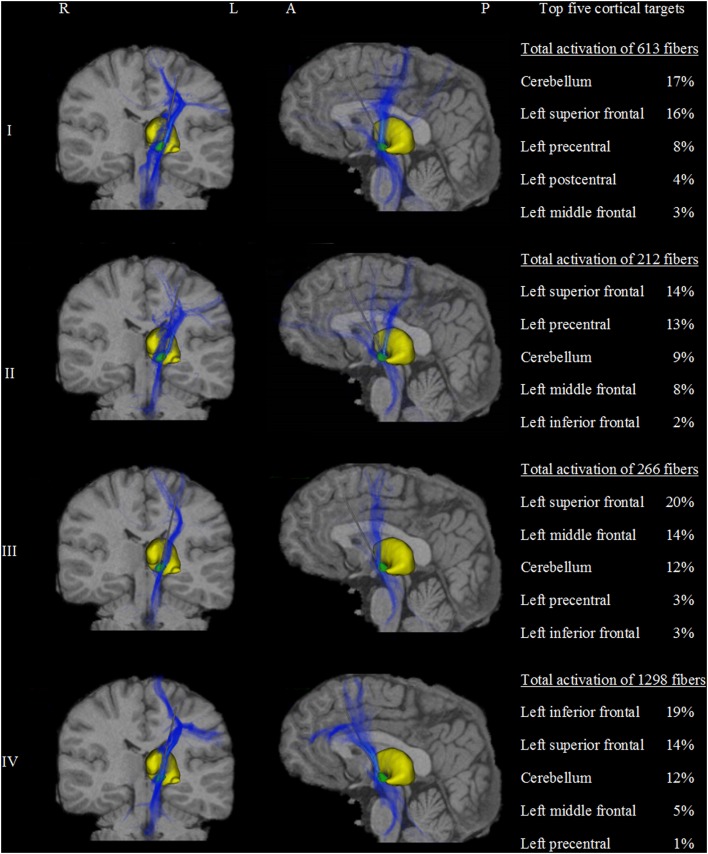
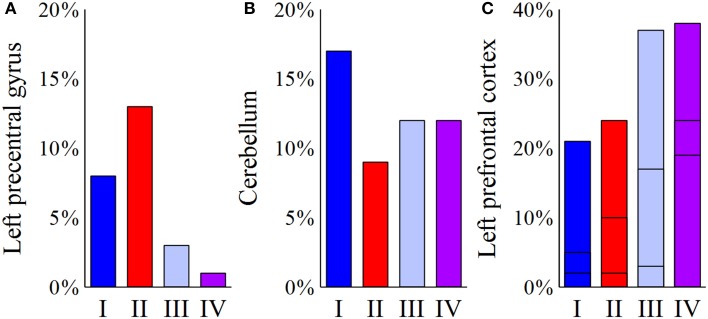
Results: Stimulation at the border of the STN (models I and IV) led to a higher degree of fiber activation and associated cortical modulation than stimulation deeply inside the STN (models II and III). A posterolateral target (models I and II) was highly connected to cortical areas representing motor function. Additionally, model I was also associated with strong activation of fibers projecting to the cerebellum. Finally, models III and IV showed a dorsoventral difference of preferentially targeted prefrontal areas (models III: middle frontal gyrus; model IV: inferior frontal gyrus).

Discussion: The method described herein allows characterization of cortical modulation across different electrode placements and stimulation parameters. Furthermore, knowledge of anatomical distribution of stimulation-evoked activation targeting cortical regions may help predict efficacy and potential side effects, and therefore can be used to improve the therapeutic effectiveness of individual adjustments in DBS patients.

Keywords: axonal activation; computational model; cortical excitability; deep brain stimulation; individualized medicine.


Figures

Figure 1
Figure 1
3D anatomical relationship between subcortical nuclei, and active contacts for models I–IV. The subthalamic nucleus (STN) is shown in green, while the thalamus is shown in yellow. For models I and II, the DBS electrode was placed in the posterolateral STN. For models III and IV, the electrode was shifted by 4 mm to a more anteromedial portion of the STN. The numbers I-IV indicate the selection of the active contact (cathode) for each of the four models. The inset in the upper right corner illustrates the consecutive numbering of the contact labels. Contact 2 was selected for monopolar stimulation in models I and IV, while contact 0 was selected for monopolar stimulation in models II and III. A, anterior; P, posterior; R, right; L, Left; D, dorsal; V, ventral.
Figure 2
Figure 2
Activation density heat maps. All images are sagittal views from the left. The image sections (A–C) represent the activation results of model I only, while section D comprises the data of all models (I–IV). (A) Voltage distribution (red-purple) generated by DBS simulation (stimulation amplitude: −1.5 V, pulse width: 60 μ s, stimulation frequency: 130 Hz). Brighter colors correspond to higher voltage amplitudes. (B) Fiber pathways (red) activated by the electric field that was generated by the voltage distribution in (A). (C) Activation density heat map, allowing for better identification of the main active fiber pathways. (D) Identification of active fibers pathways which are characteristic of a posterolateral (models I, II, pink color) or anteromedial (models III, IV, green color) DBS electrode placement. Yellow areas indicate an almost equal distribution between anteromedial and posterolateral stimulation. The associated mathematical operation is described in the running text. A, Anterior; P, Posterior; D, Dorsal; V, Ventral.
Figure 3
Figure 3
Activation density heat maps showing axonal activation for the four models (I–IV). Left and middle columns show coronal and sagittal views, respectively. The subthalamic nucleus is shown in green and the thalamus in yellow. High densities of active fibers are associated with brighter color and less transparency. The major differences of activation results between the four models are clearly observed. Models I and II were highly connected to the precentral gyrus and the dorsal segment of the superior frontal gyrus. Additionally, model I showed strong cerebellar projections. In contrast, models III and IV showed stronger connections to prefrontal areas such as the anterior part of the superior frontal gyrus and the middle and inferior frontal gyri. Model III was associated with the middle frontal gyrus. Similarly, model IV presents a predominant connection to the inferior frontal gyrus. The right column shows a quantitative comparison of the anatomical distribution of active fibers between the four STN DBS models. The top five cortical targets including the percentage of active fibers targeting those regions are illustrated. R, right; L, left; A, anterior; P, posterior.
Figure 4
Figure 4
Comparison of the four models (I–IV) with respect to the predominantly targeted cortical areas. For each model, the bar plots represent the percentage of active fibers targeting a distinct region of interest. (A) Posterolateral stimulation (models I and II) present a considerable connection of active fibers to the left precentral gyrus, as opposed to anteromedial stimulation (models III and IV). (B) For the cerebellum, the highest percentage of connected active fibers can be found in model I. (C) For the left prefrontal cortex, the plotted bars are divided into three sections. The bottommost part reflects the inferior frontal gyrus, the middle part illustrates connections to the middle frontal gyrus, and the topmost part represents fibers targeting the superior frontal gyrus. While model III present relatively high percentages of fibers projecting to the left middle frontal gyrus, activation results for the left inferior frontal cortex show a clear predominance of model IV.

References

    1. Albaugh D. L., Shih Y.-Y. I. (2014). Neural circuit modulation during deep brain stimulation at the subthalamic nucleus for Parkinson's disease: what have we learned from neuroimaging studies? Brain Connect. 4, 1–14. 10.1089/brain.2013.0193 - DOI - PMC - PubMed
    1. Butson C. R., Cooper S. E., Henderson J. M., McIntyre C. C. (2007). Patient-specific analysis of the volume of tissue activated during deep brain stimulation. Neuroimage 34, 661–670. 10.1016/j.neuroimage.2006.09.034 - DOI - PMC - PubMed
    1. Butson C. R., Maks C. B., McIntyre C. C. (2006). Sources and effects of electrode impedance during deep brain stimulation. Clin. Neurophysiol. 117, 447–454. 10.1016/j.clinph.2005.10.007 - DOI - PMC - PubMed
    1. Chabardès S., Polosan M., Krack P., Bastin J., Krainik A., David O., et al. . (2013). Deep brain stimulation for obsessive compulsive disorder: subthalamic nucleus target. World Neurosurg. 80, S31.e1–S31.e8. 10.1016/j.wneu.2012.03.010 - DOI - PubMed
    1. Chaturvedi A., Butson C. R., Cooper S. E., McIntyre C. C. (2006). Subthalamic nucleus deep brain stimulation: accurate axonal threshold prediction with diffusion tensor based electric field models. Conf. Proc. IEEE Eng. Med. Biol. Soc. 1, 1240–1243. 10.1109/IEMBS.2006.260502 - DOI - PubMed

LinkOut - more resources