. 2015 Apr;18(4):603-610.
doi: 10.1038/nn.3975. Epub 2015 Feb 25.

Neural circular RNAs are derived from synaptic genes and regulated by development and plasticity

Affiliations

Neural circular RNAs are derived from synaptic genes and regulated by development and plasticity

Xintian You et al. Nat Neurosci. 2015 Apr.

Abstract

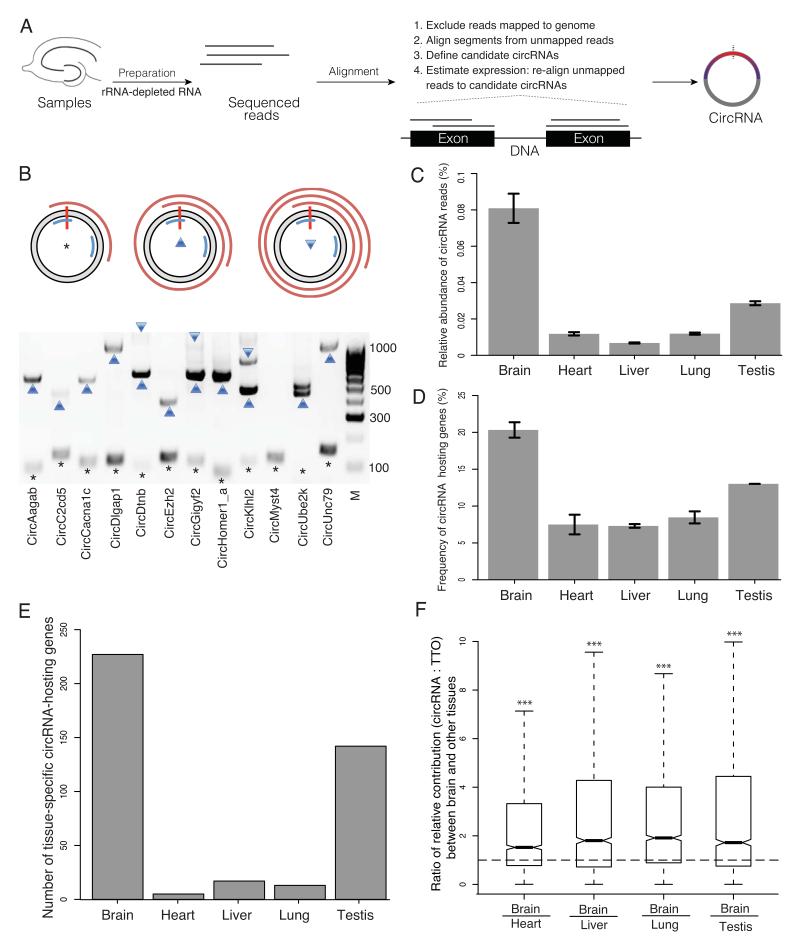
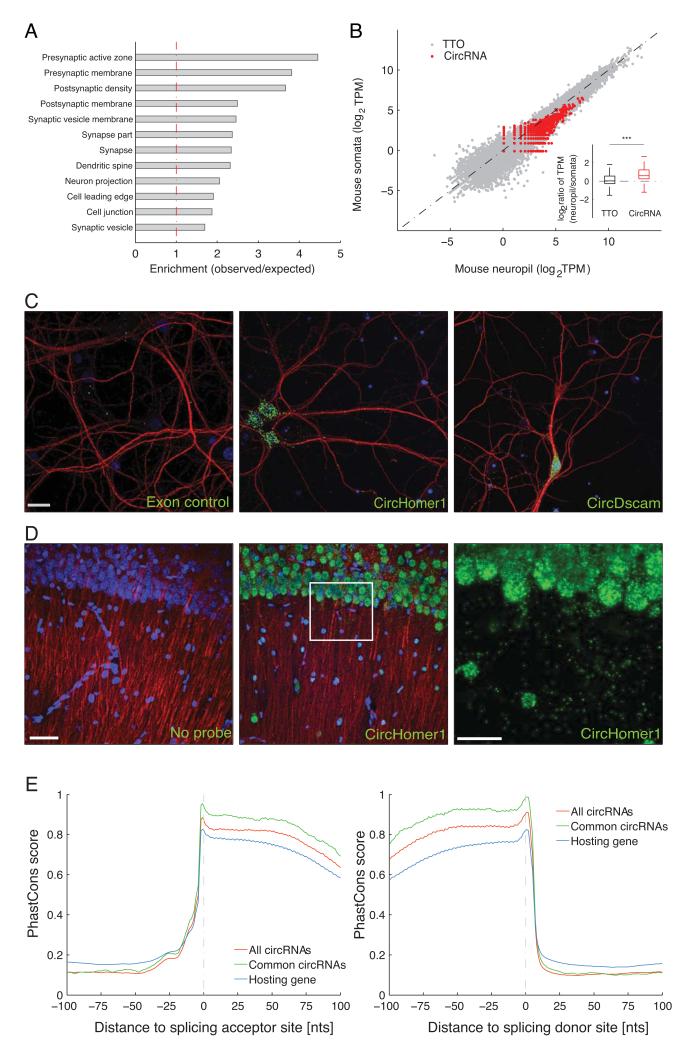
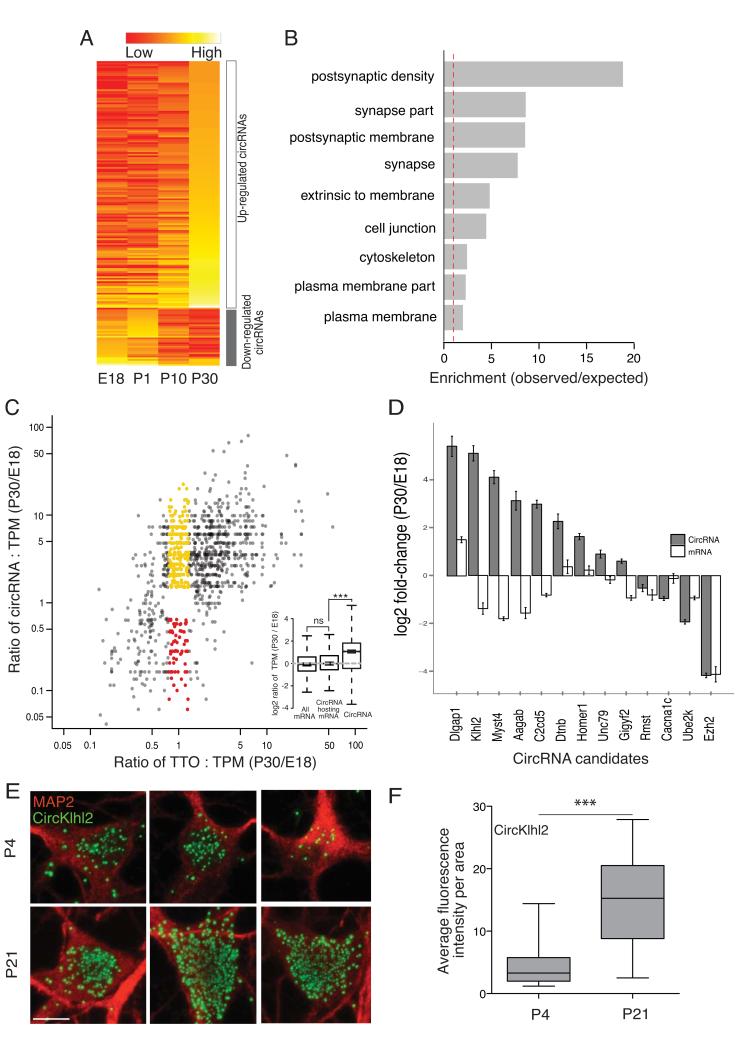
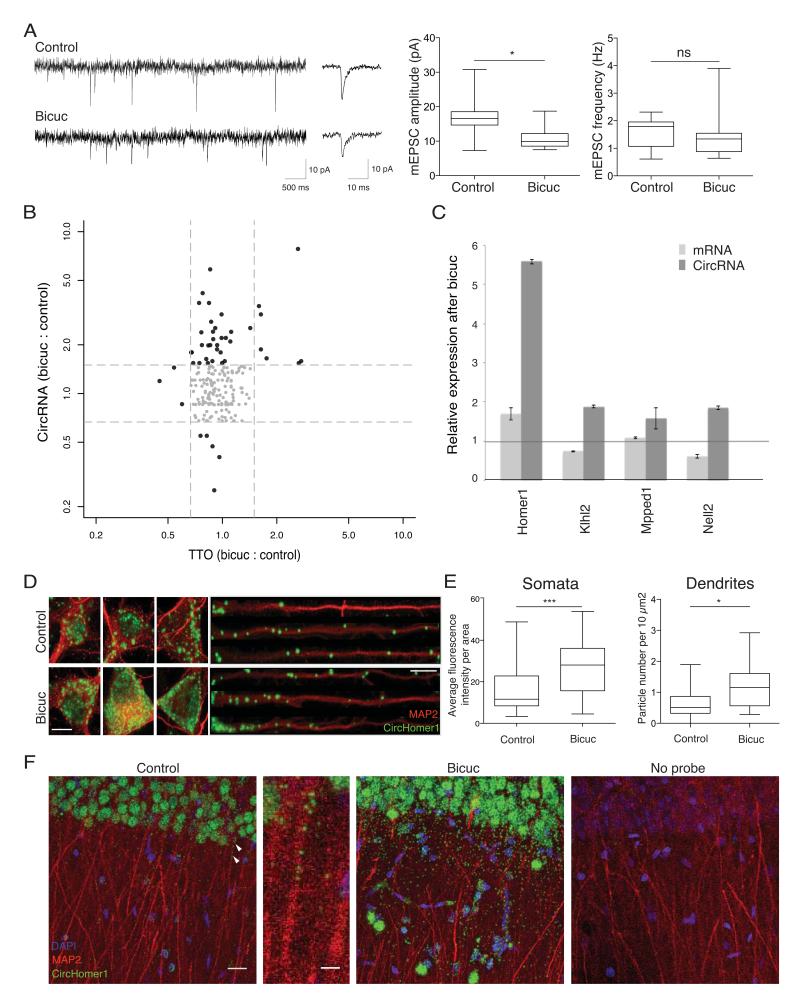
Circular RNAs (circRNAs) have re-emerged as an interesting RNA species. Using deep RNA profiling in different mouse tissues, we observed that circRNAs were substantially enriched in brain and a disproportionate fraction of them were derived from host genes that encode synaptic proteins. Moreover, on the basis of separate profiling of the RNAs localized in neuronal cell bodies and neuropil, circRNAs were, on average, more enriched in the neuropil than their host gene mRNA isoforms. Using high-resolution in situ hybridization, we visualized circRNA punctae in the dendrites of neurons. Consistent with the idea that circRNAs might regulate synaptic function during development, many circRNAs changed their abundance abruptly at a time corresponding to synaptogenesis. In addition, following a homeostatic downscaling of neuronal activity many circRNAs exhibited substantial up- or downregulation. Together, our data indicate that brain circRNAs are positioned to respond to and regulate synaptic function.


Figures

Figure 1
Figure 1. Profiling of circRNAs across tissues reveals enrichment in brain
A. Experiment and analysis pipeline. B. The rolling cycle cDNA products from circRNAs. The grey ring represents a circRNA with the red vertical bar marks the head-to-tail junction. Two blue arcs mark the PCR primers. The red spirals on the outside represent PCR products that were deep sequenced by PacBio technology. The asterisk, upward triangle and downward triangle symbols on the gel image denote the 0-cycle, 1-cycle and 2-cycle RT products identified by PacBio sequencing, respectively. Eleven out of 12 circRNAs tested generated rolling cycle products (the exception was circMyst4). C. The percentage of circular junction reads from all the reads mapped on the genome is shown for different tissues, with the highest value (0.75-0.87%) in brain, followed by testis (0.28-0.29%). D. The percentage of genes that produced circRNAs from all the expressed genes is shown across different tissues, with the highest value (20-21%) in brain, followed by testis (13%). E. The number of circRNA host genes that are exclusively expressed in one tissue is shown across different tissues, with the highest value in brain, F. The relative contribution of circRNA to the total transcription output of the same gene locus i.e. the ratio between the abundance of each circRNA and the total transcriptional output (TTO) of the hosting gene loci (measured in TPM, transcripts per million) is significantly higher in brain compared to all other tissues, The ratios of the relative contribution between brain and other four tissues are significantly larger than one (two-sided one-sample t-test, *** p < 2.2E-16). C.-F. Tissues were obtained from two animals.
Figure 2
Figure 2. Brain expressed circRNAs derived from genes coding for synaptic proteins and are enriched in synaptic tissues
A. Gene Ontology enrichment analysis of the genes producing brain expressed circRNAs. Functional groups related to synaptic function were overrepresented in the genes producing brain circRNAs. B. The abundance of circRNA and total transcriptional output of protein-coding gene loci (measured in TPM) were compared between neuropil (X-axis) and the somatic layer of the hippocampus (Y axis) in mouse. Each red dot represents one circRNA, and each dark dot represents one protein-coding gene locus. Inset shows that the abundance of circRNAs, but not total transcriptional output, is significantly higher in the synaptosome and neuropil fractions (two-sided, unpaired Student’s T-test, *** p < 2.2E-16). C-D. High resolution in situ hybridization experiments in cultured hippocampal neurons (C) or hippocampal slices (D) using probe sets designed to detect the indicated circRNA (green). In each case, many circRNA-positive particles are apparent in the cell bodies (nuclei stained with DAPI, blue), but also in the dendritic processes, detected using an anti-MAP2 antibody (red). A control (exon) probe designed to detect non-contiguous regions of two exons that could not form head-to-tail junction (see Methods) yielded just a few background particles. Scale bars = 20, 50 and 75 microns, in C and D and D-enlarged, respectively. For cells, one representative image from 3 - 43 images is shown, for slices one image from 4 images is shown. E. The exonic sequences around the splicing sites (Left: splicing acceptor; right splicing donor) involved in the formation of mouse circRNA head-to-tail junctions (red) are more conserved than those from the same gene locus, but not involved (blue). Y-axis denotes the average PhastCons score. X-axis marks the distance to the splicing site (negative and positive values means upstream and downstream, respectively). Importantly, the exonic sequences around the circRNA junctions common in mouse and rat (purple) are even more conserved, almost reaching the maximum PhastCons score.
Figure 3
Figure 3. Regulated expression of brain circRNAs during development
A. Heatmap of circRNA expression across four different developmental stages showing the regulation of several circRNA clusters between P0 and P10- the time at which synapses typically form. The abundance of circRNAs across four developmental stages is depicted on a scale from red (low) to yellow (high). A developmentally down-regulated cluster consisting of 43 circRNAs exhibited an early peak expression at E18 or P0 and then declined over subsequent developmental time points. A developmentally up-regulated cluster, consisting of 181 circRNAs, exhibited increasing expression that peaked at P10 or P30. B. The significantly enriched GO terms (p-value < 0.05 in either cluster). The host genes with circRNAs that exhibited peak expression associated with the time of synapse formation were enriched for synaptic function whereas the other group (down-regulated) did not exhibit significant enrichment of any GO terms. C. Fold change of both circRNA abundance (Y-axis) and the total transcriptional output (TTO) of their gene loci (X-axis) between stage E18 and P30. Each dot represents one circRNA. Dots in red and yellow highlight circRNAs that changed significantly whilst the total transcriptional output of their host loci was not substantially altered. Inset shows that while most circRNA-hosting genes do not change much in abundance compared to all genes (two-sided unpaired Student-t test, ns for p = 0.09709), circRNAs are significantly up-regulated (two-sided unpaired Student’s-t test, *** p < 2.2E-16). Six or seven mice were pooled in each of two replicates of E18. Three or four mice were pooled in each of two replicates of P30. D. The expression change for both circRNA and mRNA was validated using quantitative PCR for 13 circRNAs including Homer1, Dlgap1, Rmst, Myst4 and Ezh2. Error bars represent standard deviation. E–F. Validation of circRNA expression changes over developmental stages using high resolution in situ hybridization for circKlhl2 (green) at two time points -days in culture 4 (n = 26) or 21 (n = 24). circKlhl2 expression was significantly up-regulated between these developmental stages (two-sided unpaired Student’s t-test with Welch’s correction, *** p < 0.0001). The outline of the neuronal somata was identified using an anti-MAP2 antibody (red). Scale bar = 10 microns.
Figure 4
Figure 4. Regulation of circRNAs by homeostatic plasticity
A. Electrophysiology traces of miniature excitatory postsynaptic current (mEPSC) from control cultures and cultures treated with bicuculline for 12 hrs. Representative recordings (left), the average mEPSC waveform and quantification of mEPSC amplitudes and frequency (right). B. Expression changes of circRNA (Y-axis) and TTO (X-axis) after homeostatic plasticity. Each dot represented one circRNA. Grey dots represent circRNAs in which expression remained largely the same (less than 30% change) for both circRNA and TTO. C. Quantitative PCR validation of expression change for both circRNAs and their cognate host mRNAs following plasticity (error bars represent standard deviation). D. Validation of circRNA expression changes following homeostatic plasticity using high resolution in situ hybridization for circHomer1_a in control or bicuculine-treated neurons. Dendrites were identified using an anti-MAP2 antibody. Scale bar = 10 microns. E. circHomer1_a expression was significantly up-regulated in both the neuronal somata (n for control = 34; n for bicuculline = 43) and dendrites (n for control =12; n for bicuculline=13) following homeostatic plasticity. Primary hippocampal cell cultures were prepared from 10-20 animals. F. circHomer1_a expression was significantly upregulated in hippocampal slices following homeostatic plasticity. From left to right, control slice, zoom of a region of the control slice (indicated by arrows) showing presence of several circHomer1_a in a continuous stretch of dendrites, bicuculline-treated slices, and no probe control. Scale bars = 20 microns and 5 microns, from left to right. Bicuculline-treatment resulted in a significant upregulation of circHomer_1 in both stratum pyramidale (somatic layer) and stratum radiatum (neuropil layer), (n = 3 slices each for control and bicuculline treatment, p <0.0005 for somata and p<0.0011 for neuropil).

Comment in

  • Gear Up in Circles.
    Chen LL, Yang L. Chen LL, et al. Mol Cell. 2015 Jun 4;58(5):715-7. doi: 10.1016/j.molcel.2015.05.027. Mol Cell. 2015. PMID: 26046645

References

    1. Danan M, Schwartz S, Edelheit S, Sorek R. Transcriptome-wide discovery of circular RNAs in Archaea. Nucleic Acids Res. 2012;40:3131–3142. doi:gkr1009 [pii] 10.1093/nar/gkr1009. - PMC - PubMed
    1. Salzman J, Gawad C, Wang PL, Lacayo N, Brown PO. Circular RNAs are the predominant transcript isoform from hundreds of human genes in diverse cell types. PLoS One. 2012;7:e30733. doi:10.1371/journal.pone.0030733 PONE-D-11-22239 [pii] - PMC - PubMed
    1. Wang PL, et al. Circular RNA is expressed across the eukaryotic tree of life. PLoS One. 2014;9:e90859. doi:10.1371/journal.pone.0090859 PONE-D-13-49149 [pii] - PMC - PubMed
    1. Hansen TB, et al. Natural RNA circles function as efficient microRNA sponges. Nature. 2013;495:384–388. doi:nature11993 [pii] 10.1038/nature11993. - PubMed
    1. Memczak S, et al. Circular RNAs are a large class of animal RNAs with regulatory potency. Nature. 2013;495:333–338. doi:nature11928 [pii] 10.1038/nature11928. - PubMed

Publication types

Associated data